
Grafana Enterprise Metrics
Introducing a scalable, self-hosted Prometheus service that is seamless to use, simple to operate/maintain, and supported by Grafana Labs.
Offer Prometheus-as-a-Service on-premise for your teams today.
Traditional approach
DIY style of scaling Prometheus is complex and requires a lot of effort to maintain throughout different teams.
Scale is limited to a single machine
Lacks data governance, resulting in all-or-nothing access to metrics
Requires a lot of effort to deploy and maintain
Grafana Enterprise Metrics Approach
Enables Prometheus-as-a-Service for large organizations running at scale.
Centralized, horizontally scalable, replicated architecture
Centralized access control and authentication
Simple to deploy and maintain your complete set of metrics in one centralized, cost-effective way
Architected for scale
Grafana Enterprise Metrics provides a centralized, horizontally scalable, replicated architecture so you can easily manage and maintain your Prometheus implementation based on your specific architecture.
Easily store application and infrastructure metrics in one centralized cluster, or across multiple clusters without needing a dedicated team.
Operations made simple
Simple to get started
Grafana Enterprise Metrics gives organizations a fully assembled and configured monitoring stack out of the box so there’s no need to build systems from open source components
Simple to manage
Easily create and manage tenants and set up authentication for them with an intuitive API-driven UI.
Simple to customize
Best-in-class query performance means you can quickly create real-time dashboards that can be shared throughout your organization.
Global insights for the whole team
Run a better service with built-in global insights into how your teams use Grafana Enterprise Metrics.
Quickly fix problems like cardinality explosions or query errors
Is there a cardinality explosion?
Where are query errors occurring?
Control costs by weeding out series that are never used or inefficiently used
Which series are most popular, and which ones are never used?
How much storage space does each series and source consume?
What’s the ingestion and query rate of each series?
Find out who’s doing what, for security, chargebacks, and better service
Where is data coming from?
Which users are querying which data?
Integrates with your tooling

Grafana Enterprise
Integrate with Grafana Enterprise to provide an easy-to-use UI to manage Grafana Enterprise Metrics clusters and tenants.

Prometheus
Integrates with your existing Prometheus ecosystem so there’s no need to manually edit and manage configuration files. View and edit your Prometheus-style alerting rules all in one place.

Graphite
Integrates with Graphite-based data ingestion and querying, so you can either modernize your existing Graphite systems or transition to Prometheus. Let your team choose the Graphite query language or PromQL.
Next-level security
Enterprise-grade access control allows you to go beyond coarse-level read and write permissions to permissions based on Prometheus label value or tenant ID.
Support
With Grafana Enterprise Metrics, your team gets support, training, and consulting provided by the Grafana Labs team, including maintainers of Prometheus and Grafana Mimir. We’ll help with anything your organization needs to implement Prometheus and Grafana Enterprise Metrics.

Features
PrometheusA systems and service monitoring system with flexible queries and real-time alerting | Grafana Enterprise MetricsPrometheus with enterprise-grade scalability, durability, administration, integrations, security, and support | |
|---|---|---|
Runs on-premiseDeploy in your own data center or cloud capacity. | ||
PromQLA powerful language for querying and representing data. | ||
Efficient storage of time seriesTime series data stored in an efficient custom format. | ||
AlertmanagerPrecise alerting rules, rule evaluation, and many integrated outputs. | ||
Long-term storageDurable storage of Prometheus and Graphite metrics. | ||
High availabilityReplication ensures there are no gaps in metric data when a machine fails. | ||
Horizontal scalabilityAutomatically and seamlessly shard data among replicas, so you can grow and shrink the cluster on demand. Scale to hundreds of millions of active metrics series at millions of data points per second. | ||
A global view of metricsPerform queries that aggregate metrics across multiple Prometheus instances and long-term storage. | ||
Multi-tenancyIsolate data and queries from independent teams or business units in a single cluster. | ||
GovernanceSet per-tenant limits on querying and metrics written to ensure fair usage of the cluster. | ||
Centralized authenticationCreate keys to authenticate all reads and writes to your cluster, or use JWTs from your existing OAuth OpenID Connect implementation. | ||
Label-based access controlsCreate policies that restrict users to a subset of team or business unit metrics based on label values. | ||
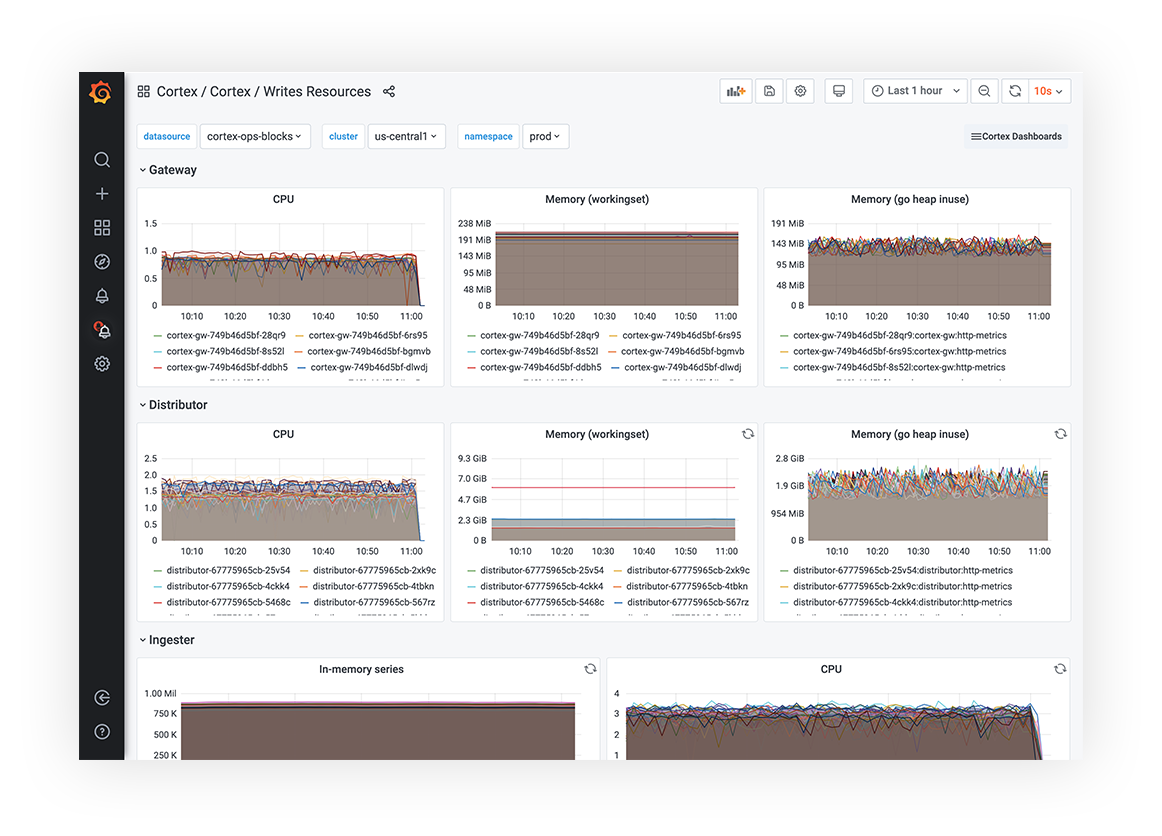
Out-of-the-box self-monitoringShips with system-health metrics readily available and exposed via automatically provisioned dashboards that reflect best-practice monitoring. | ||
Cross-cluster query federationMerge query results from metric clusters running in different data centers or geographies to create a global view of your data. | ||
Administration UIUse a UI built into Grafana to edit access policies, tenant limits, and configuration options and monitor GEM system health. | ||
IndemnificationProtection and peace of mind about offering Grafana Enterprise Metrics as a critical service within your organization. | ||
Customer supportIncludes services like training and consulting as well as bug fixes and security updates. | ||
Integrated experienceIntegration with Grafana Enterprise, Prometheus, Graphite, Loki, and Tempo. | ||
Usage insightsQuickly answer how the system is being utilized at a per-team/per-business unit granularity. Get the information needed for usage-based billing to internal customers. | Coming soon. |
Resources
Demo video: Running Prometheus-as-a-service with Grafana Enterprise Metrics
Blog: What’s new in Grafana Enterprise Metrics for scaling Prometheus
Documentation: Grafana Enterprise Metrics
Webinar: Intro to Grafana Mimir
Try Grafana Enterprise Metrics
Offer your teams a scalable Prometheus service that is seamless to use, simple to maintain, and supported by Grafana Labs.