![]()
Compose and scale observability with one or all pieces of the stack – on your infrastructure.
Scalability guaranteed
Purpose-built to handle the scale of today’s data volumes and tomorrow’s growth
Security & authentication
Provides secure access and better data protection
Support
Backed by support, training, and consulting from the Grafana Labs team
Correlated data
Integrates metrics and logs with Grafana
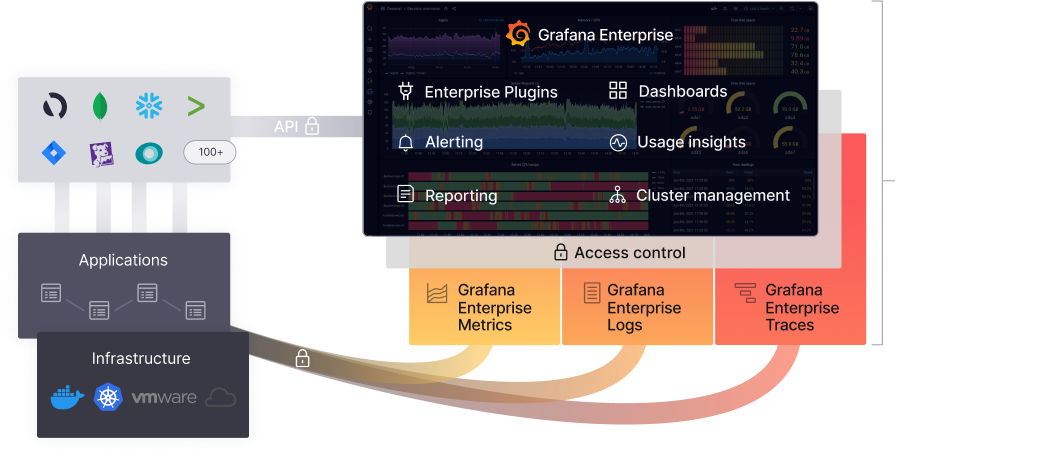
Scalable. Simple. Secure. Supported.
The Grafana Enterprise Stack includes features that provide better scalability, collaboration, operations, and governance in a self-managed environment.
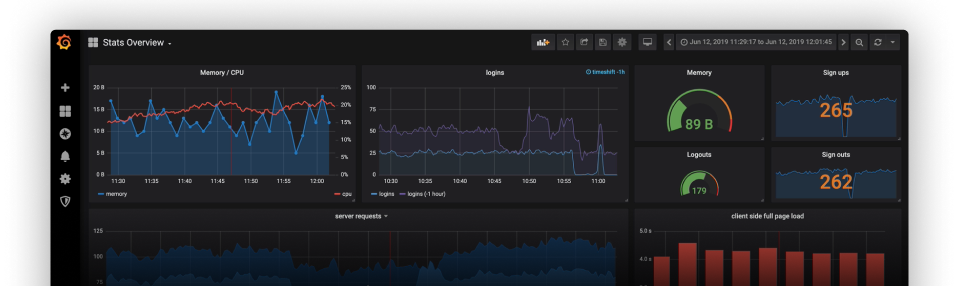
Grafana Enterprise
Grafana’s powerful visualization and alerting, enhanced with access to Enterprise data source plugins and built-in collaboration features.
Enterprise Logs
A unique approach to log indexing, storage, and administration architecture that enables companies to ingest and analyze logs, securely at scale.
Enterprise Metrics
A scalable, self-managed Prometheus service that is simple to use, operate, and maintain, and supported by Grafana Labs.
Enterprise Traces
A scalable, self-managed tracing service that links logs and metrics with traces.
Architected for scale
Built with modern distributed systems principles to grow with your applications and infrastructure. No artificial limits or barriers, just true horizontal scalability.

- Achieve maximum potential observability since metric and log limits are no longer a barrier.
- Save money by not supporting the overhead of a monitoring infrastructure, both in resources and people time.
- Easily store application and infrastructure data in one centralized cluster, or across multiple clusters without needing a dedicated team.
Simple, organization-wide administration and security
Confidently democratize data across your entire company with advanced admin tools to govern, audit, and secure user permissions and data.

Simple to manage
Not everyone needs access to the same data. Create flexible, secure views of relevant data for each team to optimize self-service, without additional overhead.
Simple to synchronize
Centralized authentication allows you to seamlessly integrate with your existing LDAP/Active Directory platform to allow a single point of control.
Simple to customize
Best-in-class query performance means you can quickly create real-time dashboards that can be shared throughout your organization.
Simple to secure
Export detailed user event logs to a file or to Enterprise Logs, in order to track and prevent suspicious activity.
Services and support
Personalized training to help you maximize your usage of Grafana, Graphite, Prometheus, and Loki, led by the experts. Grafana Labs will help your teams establish best practices in instrumentation and deployment, as well as be an on-demand resource for ongoing questions.
Observability is our thing
45% of all Prometheus team members
89% of the Grafana team members, including project founders
91% of the Loki team members, including project founders
100% of all Tempo maintainers, including project founders

Turn your team into experts
- Engineering-led learning to help your teams uplevel their skills and observability strategy
- Roadmap assurance and the opportunity to work with us to accelerate new features and functionality and shape the future of Grafana Enterprise
- Best practices embedded throughout various engagements and tools
Correlate your data
Understanding all relevant data — and the relationships between them — is important. The Grafana Enterprise Stack allows teams to seamlessly correlate insights among metrics and logs.

- Easily correlate data to get to the root cause faster.
- Reduce mean time to recovery (MTTR) and de-risk feature launches.