Observability with logs

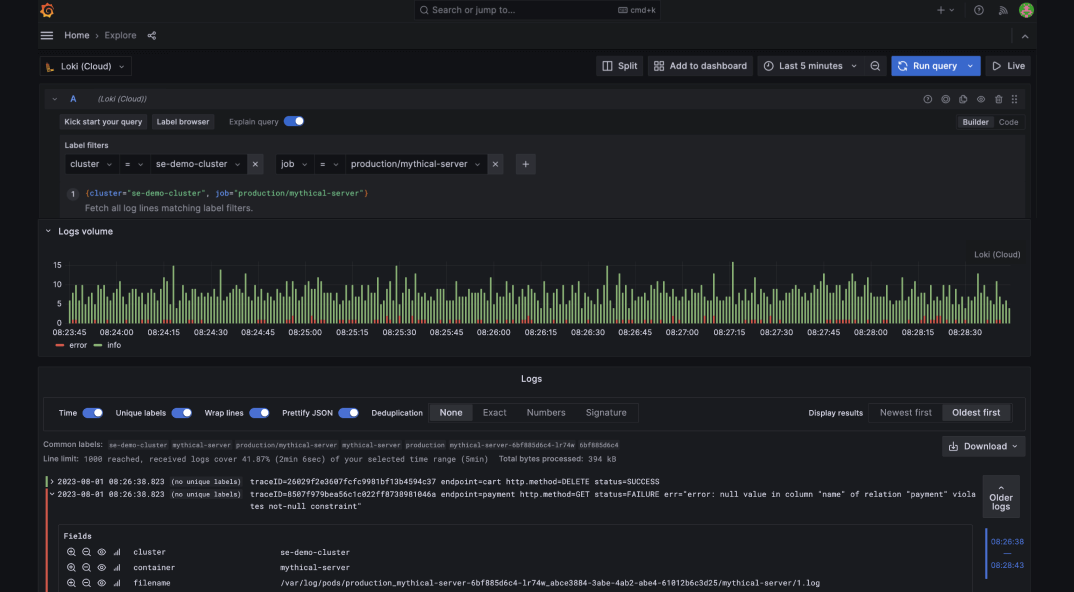
Grafana Logs (powered by Loki) brings together logs from all your applications and infrastructure in a single place. By using the exact same service discovery and label model as Prometheus, Grafana Logs can systematically guarantee your logs have consistent metadata with your metrics, making it easy to move from one to the other.

Why use Grafana for logging?

easy to start

Easy to start

With Grafana Logs, you can send logs in any format, from any source so it’s really easy to add to your existing infrastructure and get up and running quickly.
  • Leverage a wide array of clients for shipping logs like Promtail, Fluentbit, Fluentd, Vector, Logstash, and the Grafana Agent, as well as a host of unofficial clients you can learn about here →
  • Use Promtail, our preferred agent, which is extremely flexible and can pull in logs from many sources, including local log files, the systemd journal, GCP, AWS Cloudwatch, AWS EC2 and EKS, Windows events logs, the Docker logging driver, Kubernetes, and Kafka.
  • There aren’t any ingestion log formatting requirements — all formats welcome including JSON, XML, CSV, logfmt, unstructured text.

Flexible & cost-effective scale

Many logging solutions rely on full-text indexing at ingest time to make querying fast. Grafana Logs takes a different approach, building a minimal index based on log metadata and instead accelerating queries through massive parallelization, allowing it to scan up to 80 GB of log lines per second. By shifting the compute requirements from the write path to the read path, Grafana Logs has a dramatically lower cost to operate, since the majority of logs lines that are written are never read back.
  • Easy to scale from MB to PB a day if needed
  • Effectively handles sudden spikes in query and ingestion load
  • Horizontally scalable microservice architecture designed for Kubernetes
  • Logs are stored in object storage which provides durable, yet affordable long term storage
  • Run on everything from your personal Raspberry Pis to your company’s massive, horizontally scaled clusters
integrate with tools
powerful and flexible

A powerful and flexible query language

Grafana Logs uses a similar label format and query language to Prometheus, making it easier to learn and faster to switch between metrics and logs when diagnosing an issue.

  • Query logs with the same syntax used for querying metrics
  • Write log queries that allow you to dynamically filter and transform your log lines
  • Easily calculate metrics from your logs, like the rate of errors or top K sources with the highest log volume
  • Minimal indexing at ingest time means you can slice and dice your logs dynamically at query time to answer new questions as they arise

Cloud native

Prometheus

prometheus

Leverage your existing Prometheus expertise

Prometheus style data model, query language (LogQL) and alerting
Ad-hoc prometheus metrics from your logs
Prometheus style discovery and scraping configuration
Golang

prometheus

Effective use of hardware resources

written in Golang

Low memory overhead
Native compilation (so no virtual machine)
Grafana and k8s

prometheus

Compatible with your existing tools

If you’re already using Logstash, Fluentd, etc. - you can just point your logs at a new target
Horizontal scalable microservice architecture designed for Kubernetes
Designed to be used with Grafana visualization
“Grafana and Loki have been helpful in having identical stacks making it easier to maintain a scalable infrastructure to support business growth. From a technical perspective, we have completely harmonized metrics across all sides and the data is accessible to anyone in the company which helps in troubleshooting.”
Lauren Bel
Head of IT Architecture & Innovation, Pernod Ricard
“Since the time we installed Loki, there has not been a single incident or an instance where Loki went down for us, regardless of the volume of application logs that we were getting.”
Piyush Baderia
DevOps Engineer, Paytm

Choose the version that works best for you

To use Grafana Logs, you have three options:

Grafana Loki

An open source, horizontally scalable, highly available, multi-tenant log aggregation system inspired by Prometheus.

For users who prefer to set up, administer, and maintain their own installation.

Cloud Logs

Offered as a fully managed service, Grafana Cloud Logs is a lightweight and cost-effective log aggregation system based on Grafana Loki.

Managed and administered by Grafana Labs with free and paid options for individuals, teams, and large enterprises.

Includes a robust free tier with access to 50GB of logs.

Enterprise Logs

A self-managed logging solution that runs securely at scale with expert support from Grafana Labs.

For organizations that have specific privacy or security requirements and need a self-managed environment.

Effective debugging and troubleshooting

Grafana Logs are systematically and consistently labelled in the same way as Prometheus metrics and uses the same Service Discover mechanism. This guarantees that you can always find the logs for a given graph, allowing for faster troubleshooting in one UI with a few clicks.

  • Reduces the amount of time it takes to get to the root cause of a problem
  • Easily correlate your metrics, logs and traces all in Grafana
effective debugging
visualize logs as metrics

Visualize logs as metrics

You might already know that you can use Prometheus and Graphite metrics for monitoring, but you can also create metrics from your logs.

  • Find the logs for a given graph, allowing for faster troubleshooting in one UI with a few clicks
  • Helpful when you can’t instrument your application with metrics or when dealing with high cardinality

Prometheus alerting for your Logs

Grafana Logs integrates with Prometheus Alertmanager, which helps reduce alert fatigue with summarization, notification rate limiting, silencing, and alert dependencies.
  • Use your existing receiver config and send alerts to multiple notification channels, email, PagerDuty, Slack, webhooks, and more
  • Generate alerts directly from your logs and send them to a Prometheus Alertmanager
prometheus alerting
gradually transition off your logging tools

Gradually transition off of your costly or legacy logging tools

Grafana Logs works alongside your technologies, making it easy to get started without having to rip out your existing logging tools. Bring all of your log data together with other sources, as Grafana’s unique architecture queries data directly where it lives rather than moving (and paying) for redundant storage and ingestion.
  • Visualize log data from your current logging tool (such as Splunk, Elastic, or other providers) alongside your Grafana Logs data
  • Avoid vendor lock-in and give your teams the tools they actually want to use
  • Create meta panels or comparisons between sources

Build real-time, interactive dashboards using log data

ngnix

By creating a custom JSON access log, you can easily visualize things like total traffic, error rates, unique visitors, visitor demographics and more.

ngnix

In the top-left panel of the homepage dashboard, you’ll find a link to the Grafana Agent Logs Quickstart which will show you how to roll out a Grafana Agent DaemonSet to collect Container and Pod logs. You can then correlate these with your Pod and application metrics.

ngnix

This Loki Syslog all-in-one example is geared to help you get up and running quickly with a Syslog ingestor and visualize logs. It uses Grafana Loki and Promtail as a receiver for forwarded syslog-ng logs.

ngnix

Easily forward your logs and your workload metadata to a Loki instance to consolidate and query all of your logs and metadata.

ngnix

Promtail is an agent which ships the contents of local logs to a private Grafana Loki instance or Grafana Cloud. It is usually deployed to every machine that has applications needing to be monitored.

Correlate your data

Understanding all relevant data — and the relationships between them — is important for root-causing incidents as quickly as possible and identifying the real source of unexpected system behavior. Grafana allows teams to seamlessly visualize and move among all of their data, all in one place.