Grafana Cloud thoughtfully integrates the best-in-breed open source technologies into a curated observability platform, all managed and scaled by the team at Grafana Labs.
Grafana Cloud is greater than the sum of its features. Seamlessly switch between metrics, logs, and traces. Correlate data and get to the root cause more easily and quickly. Reduce mean time to recovery (MTTR) and de-risk feature launches. Give your team the tools they want to use. Focus on what you do best; leave the platform to us.
Cloud integrations
The Grafana and Prometheus open source projects are de facto standards for observability, with wide grassroots adoption. Both are easy to get started with and to use. But it can take weeks to get the best out of a complete integrated stack — including logs, traces, an agent, dashboards, alerts, etc. — and not every organization has the time and resources to do this.


Grafana Cloud comes with an ever-expanding set of pre-built integrations to get the most out of these technologies quickly and easily. Start monitoring popular infrastructure components such as MySQL, Postgres, Redis, or Memcache with just a few clicks. Choose from preconfigured dashboards and alerts, and use our comprehensive agents to gather important metrics, logs, and traces in one place.
Try on Grafana Cloud Learn moreCloud dashboards (Grafana)
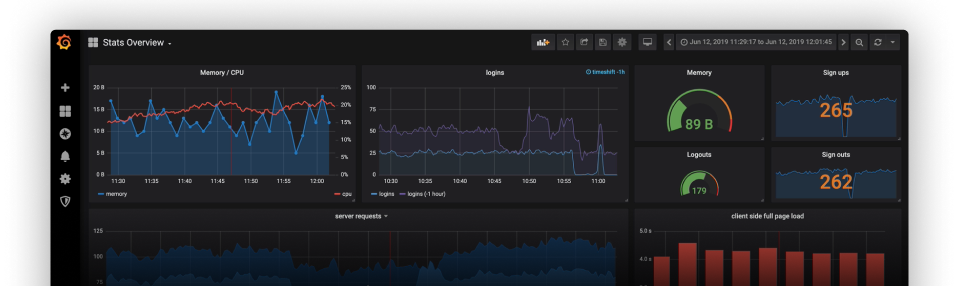
Grafana is at the center of every Grafana Cloud stack. Grafana allows you to query, visualize, alert on, and understand your metrics no matter where they are stored. Create, explore, and share beautiful dashboards with your team and foster a data-driven culture. The Grafana Cloud Pro plan includes features previously reserved for Grafana Enterprise customers, including data source permissions, reporting, and usage insights.


As with every service in Grafana Cloud, we take care of making your Grafana securely available over the internet, avoiding the need to deal with firewalls and set up SSL. Grafana Cloud is operated by our expert team with 24x7, follow-the-sun on-call coverage and backed by our SLA. We handle all the reliability, availability, and scalability aspects of your Grafana instance. We ensure every user stays up to date with the latest features by seamlessly upgrading to the most recent release.
Try on Grafana Cloud Learn moreCloud metrics
Prometheus is the de facto standard monitoring system for cloud native applications and infrastructure. With its pull-based collection, Prometheus offers cloud native, vertically scalable monitoring for your application. But federating together multiple Prometheus instances across many regions can be complicated and time consuming. And horizontally sharding Prometheus servers as your deployment grows takes time and understanding.


Included in your Grafana Cloud stack is a massively scalable, high-performance, and highly available Prometheus instance. Bring together the raw, unsampled metrics for all your applications and infrastructure, spread around the globe, in one place. Query high cardinality data with blazing fast PromQL and Graphite queries. Centralize the analysis, visualization, and alerting on all of your metrics. Grafana Cloud’s default 13-month retention (in the Pro plan) allows you to combine application and infrastructure metrics for use cases such as capacity planning.

- Multi-tenant, highly scalable Prometheus metrics storage
- Custom long-term retention at 13 months
- Single query endpoint centralizing all individual Prometheus instances
- Highly scalable Graphite metrics storage
- Custom long-term retention per original schemas (default 24 months)
- Much faster query performance
- Query the same data with both PromQL and Graphite's query language
Cloud logs
The move to cloud native and microservice-based architectures has led to an explosion in the volume of logs. At the same time, continuous integration and deployment are allowing developers to iterate faster and take more risks. For many developers, logs are an “insurance policy”; applications will fail in new and exciting ways, and good logs will allow you to figure them out. Therefore to move quickly with complex architectures, you need a high-volume, cost-effective log aggregation system.


Grafana Cloud’s logging service is powered by Grafana Loki, our Prometheus-inspired log aggregation project. Our high-performance system allows you to bring together logs from all your applications and infrastructure in a single place. By using the exact same service discovery as Prometheus, Loki can systematically guarantee your logs have consistent labels with your metrics. This allows you to seamlessly switch between metrics and logs, preserving context and saving time. Loki’s LogQL query language allows you to apply all the knowledge and skills learned from Prometheus’s PromQL and query your logs in the same way you would query your Prometheus metrics. Extract and analyze metrics derived from log data — useful for legacy applications that don’t expose metrics.
Cloud traces
The popularity of the microservices architecture pattern has led to an increase in complexity — a single request can now involve many tens or hundreds of individual services. It can sometimes be tricky or impossible to attribute latency spikes and errors to a single service; long-tail latency can often be caused by the emergent behavior of hundreds or thousands of services. Traditional debugging and profiling tools cannot capture the whole picture. Distributed tracing is a powerful technique for diagnosing latency and errors in these architectures. Visualize the flow of a request as it traverses multiple services, identify where problems start, and root out the cause.


Powered by Grafana Tempo, Grafana Cloud provides an easy-to-use, highly scalable, and cost-effective distributed tracing system. A common technique for controlling the resource usage of many systems is sampling: only recording traces for a subset of your requests. But what if the request you want to investigate wasn’t sampled? Tempo doesn’t index the traces — making it possible to store orders of magnitude more trace data for the same cost, and removing the need for sampling. Tempo instead relies on deep integrations within Grafana to allow you to pivot seamlessly between metrics, logs, and traces — for example, leveraging your existing logs to find the trace you care about.
Compatible with:
![]()
![]()
![]()
Cloud alerting
Prometheus and Alertmanager offer some of the most powerful alerting capabilities available. A single, consistent alerting rule can generate multiple notifications, powered by Prometheus’s multi-dimensional, label-based data model. Alertmanager can use these labels to route notifications for the same alert rule to different teams. Alertmanager can also group and deduplicate notifications together into a single email to reduce interruptions. With the open source tools, all of this power is controlled by a set of YAML-based configuration files, loaded on the same machine as Prometheus and Alertmanager. But often the team that wants to build alerting rules is different from the team that manages the Prometheus servers.


With Grafana Cloud alerting, a simple UI embedded right in your Grafana instance can be used to manage alerts — allowing your alerting to become self-service. Create, manage, and silence all of your alerts within one simple Grafana Cloud alerting page. All these options are also available via a RESTful API with tooling to enable a GitOps-style workflow.
Grafana Cloud also allows Prometheus-style alerting on the contents of the logs. A unified experience allows you to manage alerting rules for both metrics and logs directly in Grafana. This is especially useful for third-party systems that don’t export metrics.
Try on Grafana Cloud Learn moreSynthetic monitoring
Monitoring your service from within your own infrastructure allows you to get detailed insights into its behavior. But it can’t tell you how your service is performing from outside your infrastructure, or from the other side of the world. Getting these signals requires a large deployment of probes throughout the world, hosted on many providers. Deploying, maintaining, and upgrading these seldom represents a good investment for a single organization.


Let Grafana Cloud manage them for you with synthetic monitoring. Observe how systems and applications are performing from a user’s point of view by monitoring applications and API endpoints from dozens of locations around the world. We deploy the open source Prometheus blackbox exporter and provide a simple management UI and API for you to configure them. Continually test remote targets using HTTP/HTTPS, DNS, TCP, and ICMP Ping to assess the availability, performance, and correctness of your service.
Grafana tutorial: simple synthetic monitoring for applications
Learn more →
Intro to synthetic monitoring - and Grafana Labs’ new iteration on worldPing
Learn more →
Grafana Alloy
Grafana Alloy is an open source OpenTelemetry collector with built-in Prometheus pipelines and support for metrics, logs, traces, and profiles. Read about Grafana’s transition from Agent to Alloy.
- Pull configs from anywhere, such as GitHub, S3, and HTTP endpoints.
- Natively ingest metrics, logs, traces, and profiles with compatibility formats like Prometheus, OpenTelemetry, Mimir, Loki, Tempo, and Pyroscope.
- Enable SREs to get production-ready pipelines immediately.
- And much more.
Grafana Labs is proud to lead the development of the Alloy project, building first-class support for Alloy into Grafana and ensuring Grafana Labs customers receive Alloy support and features they need.
Try on Grafana Cloud Learn moreGrafana Machine Learning
Use Grafana Machine Learning to run modern data science techniques on your Grafana Cloud metrics.
You can visualize the predictions, and you can solve real-world problems. For example:
- Adaptive alerting - alerts that follow the natural ebb and flow of your systems.
- Anomaly detection - detect the unexpected.
- Capacity planning - Automatically anticipate when you need to scale up and down.
With just a few clicks, anybody can train ML models capable of making confident predictions into the future.

Grafana OnCall
Grafana OnCall is an easy-to-use on-call management tool built to help DevOps and site reliability engineering (SRE) teams improve their collaboration and ultimately resolve incidents faster — right within Grafana Cloud.
With Grafana OnCall, teams will no longer have to manage separate alerts from Grafana, Prometheus, and Alertmanager, lowering the risk of missing an important update while also limiting the time spent receiving and responding to notifications. OnCall is easily integrated into Grafana Cloud deployments and works with existing alerting sources and monitoring tools, so teams can get up and running quickly and easily.

External data source plugins
The Grafana instance at the center of your Grafana Cloud stack can bring together data from over 60 different data sources and visualize them side-by-side on the same dashboard — including data not hosted on Grafana Cloud.
Adding data sources within your Grafana Cloud account is as simple as one click. Leave your data where it is and get full visibility into your application stack with data source plugins.
Try on Grafana Cloud Learn more