Your observability stack, faster and easier
With Grafana Cloud, enable observability — from operational dashboards to a fully centralized system and everything in between — without the overhead of building and maintaining your own stack.
A free plan THAT’S Actually useful
- 10k metrics
- 50GB logs
- 50GB traces
- 50GB profiles
- 500VUh k6 testing
- 50k frontend sessions
- 2232 app o11y host hours
- 14-day retention
- 3 active users
Choose your own observability adventure
Open and composable architecture gives you the flexibility to host your metrics, logs, and traces in Grafana Cloud or mix and match tools to avoid vendor lock-in. Whatever you need, we manage it for you.
Unify real-time data for actionable outcomes
Plug into Grafana Cloud’s ecosystem of data sources and integrations. Unify disparate data and natively correlate between metrics, logs, and traces to speed up root cause analysis and reduce MTTR.
Get started in minutes with integrated solutions
Guided workflows and prebuilt dashboards help you instantly monitor your cloud native infrastructure, services, and applications. Extend your observability with solutions for IRM, load testing, Kubernetes monitoring, and more.
Why Grafana Cloud is your best observability platform
The only composable observability platform
Grafana Cloud is the only platform that adapts to your needs, whether you’re just getting started with observability or you already have tools in place.
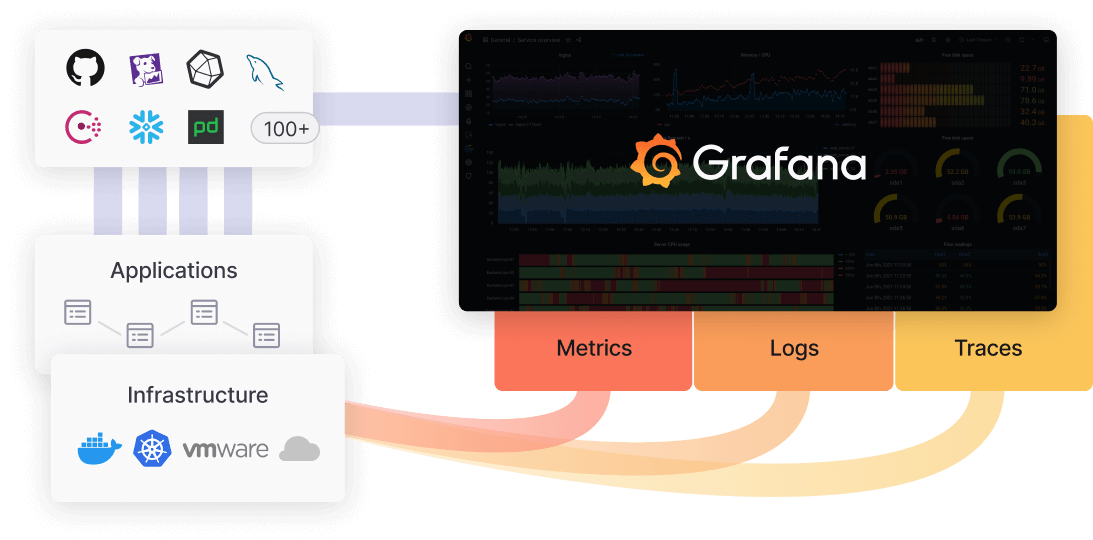
- Unify data from more than 100+ external data sources into a single dashboard to gain full stack visibility, track real-time SLI/SLO metrics, and more.
- Send your local Prometheus, Graphite, InfluxDB, or Datadog metrics to a common backend on Grafana Cloud.
- Leverage the tightly integrated stack to correlate metrics with logs and traces for actionable insights.


Turnkey infrastructure integrations
Choose from more than 50 curated infrastructure integrations that include only the metrics and logs you need to monitor, without causing cardinality problems.
- Out-of-the-box dashboards, metrics, alerts, and logs for Kubernetes and legacy infrastructure.
- Single agent setup for collecting metrics, logs, and traces.
- Discover underutilized resources within Kubernetes clusters.
Cost-efficient observability at massive scale
Keep up with the explosive growth in telemetry data without compromising query speeds, dashboard performance, or your budget. Native multi-tenancy and high availability can support enterprise-level scale, and object storage makes long-term storage reliable and cost-effective.
- Scale up to 1B active series with Grafana Mimir, our horizontally scalable TSDB.
- Store more logs using less storage thanks to Grafana Loki’s minimal indexing architecture.
- Keep rampant metrics growth in check with prebuilt cardinality dashboards.


Lower total cost of ownership (TCO) and operational overhead
- Grafana Cloud is available in the top three cloud providers so you can leverage the platform and region of your choice.
- Automatic software updates, access to new features, and zero downtime for upgrades and bug fixes.
- Unlimited 365x24x7 customer support.
Improve reliability with AI
- Predict future capacity needs and account for seasonal fluctuations with metric forecasts.
- Detect anomalies in your system with outlier detection, and take early action to prevent further impact.
- Run automated system checks and resolve issues faster with Sift investigations.


Built-in security and cloud administration
- Securely query private data with Private Data Source Connect.
- SSO/SAML/LDAP for user authentication. (Pro and Advanced)
- Data source permissions plus role-based access control (RBAC) to control who can access what. (Pro and Advanced)
Grafana Cloud is secure and compliant. Visit the Trust Center for certifications and security docs.
What is Grafana Cloud?
Grafana Cloud is a fully managed cloud-hosted observability platform ideal for cloud native environments.
Grafana Cloud is a tightly integrated stack for metrics, logs, and traces unified within the best dashboarding platform for visualizing data.
Grafana Cloud is also integrated with Grafana k6 for performance testing and Grafana Incident and Grafana OnCall for managing your incident response workflow, making it the world’s most composable and comprehensive observability stack.

Powered by open source
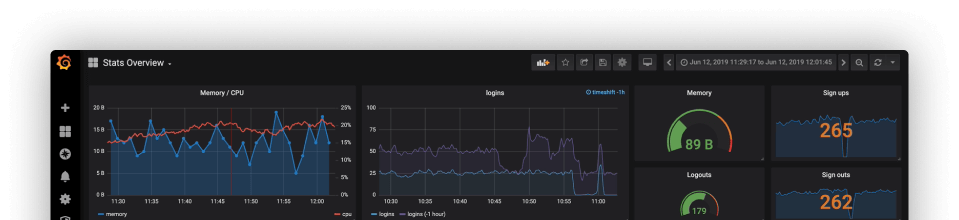
Grafana dashboards
Get unlimited dashboards managed for you in a dedicated Grafana instance. Plus, gain instant access to new features thanks to seamless upgrades to the latest releases.
Metrics
Bring together raw, unsampled metrics for all your applications and infrastructure, no matter where they live, in one place. Then, with our backend powered by Grafana Mimir, explore high cardinality data with our blazing fast queries.
Logs
Discover root causes faster with our high-performance log aggregation and storage system powered by Grafana Loki.
Traces
Leverage our highly scalable, cost-effective distributed tracing system that is powered by Grafana Tempo and compatible with OpenTelemetry, Zipkin, and Jaeger.
Grafana Agent
Simplify deployment and management of your telemetry data with Grafana Agent, a lightweight collector for sending metrics, logs, and traces to Grafana Cloud.
One observability platform, multiple solutions
Performance testing with Grafana k6 as you build
Grafana k6 enables you to test existing SLOs and deploy new features with confidence. You can also bring together cross-functional teams to prevent system failures and consistently deliver fast and reliable applications.
Monitor your infrastructure and services post-launch
Grafana Cloud provides infrastructure observability integrations, like our Kubernetes Monitoring solution, that allow you to build a truly hybrid system so you can monitor different cloud providers and pair them with open source tools or an on-prem stack.
Improve incident response and resolution when things go wrong
Grafana Alerting, Grafana Incident, and Grafana OnCall make it simple to integrate incident response and management (IRM) into the workflows you know and love.
Start getting real-time insights into your observability data today
1
Launch your Grafana Cloud stack
2
Connect your data and services
3
Build your Grafana dashboards — or use one of ours
4
Explore and monitor your applications and services in real time
Your guide to Grafana Cloud plans
Cloud FreeNo payment. Ever.
Cloud ProPay as you go
Cloud AdvancedPremium bundle
Get started with Grafana Cloud