Plugins 〉DarkSky


Developer

andig

Sign up to receive occasional product news and updates:


Grafana Cloud
Grafana Cloud
  • Grafana, of course
  • 10k series Prometheus metrics
  • 50 GB logs
  • 50 GB traces
  • 2,232 app o11y host hours
  • ...and more
Create free account

No credit card needed, ever.


Support for the Dark Sky API ended on March 31, 2023, and has been replaced by Apple’s WeatherKit API.
Data Source
community

DarkSky

  • Overview
  • Installation
  • Related content

DarkSky Datasource - weather and forecast data for Grafana

Donate

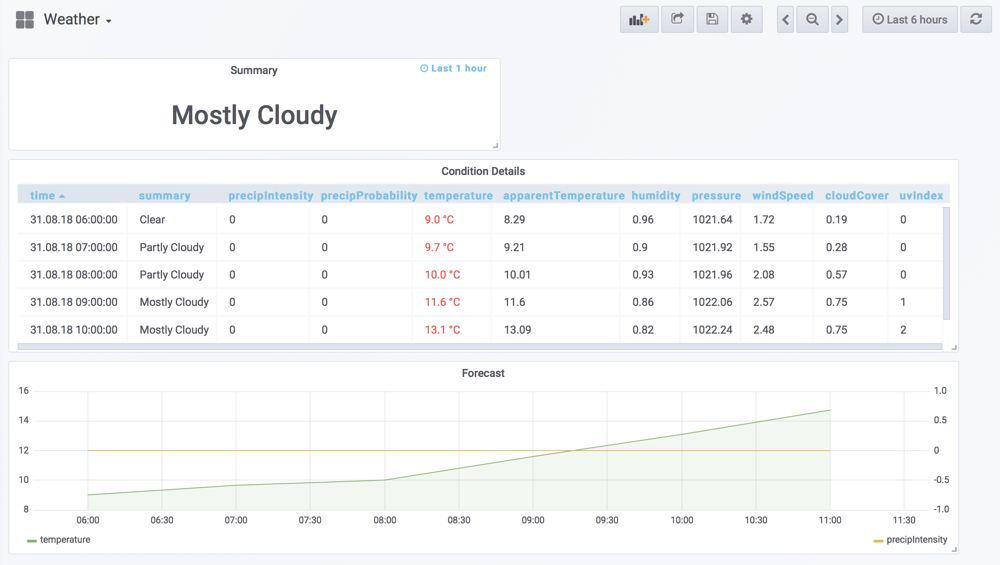
This plugin allows to graph historic weather conditions and forecast data as returned by the DarkSky API.

dashboard

Requirements

  1. API key

    Register for a DarkSky API key at DarkSky. The free plan will allow 1000 API calls per day.

  2. Geo location

    Weather data will be available for the location defined when creating the data source. If unsure you can always use Google Maps or IP location APIs like ipgeolocation.io.
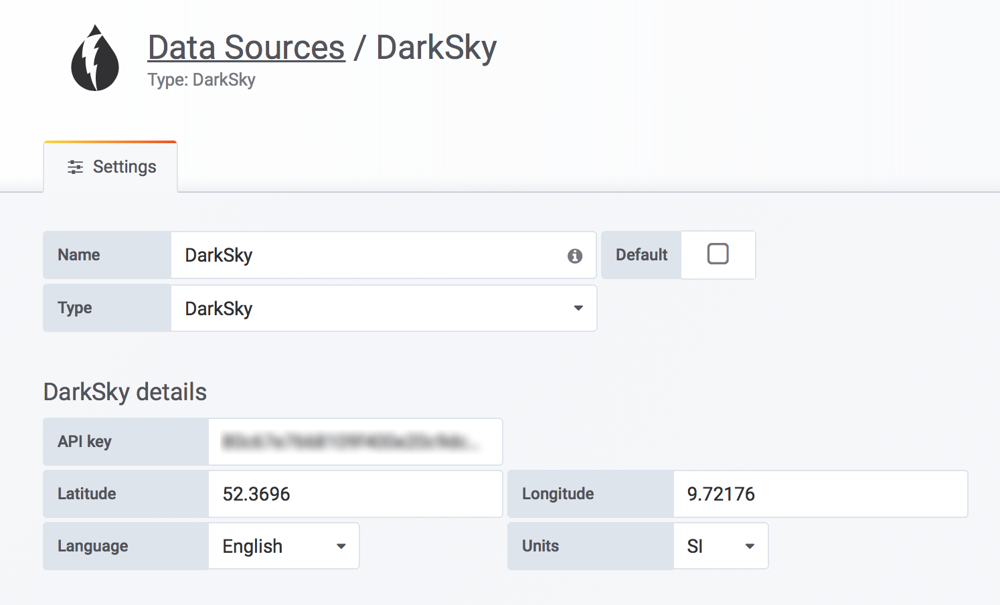
Configuration

Example configuration:

config

Frequently asked questions

  1. I've selected a metric- why does it not appear at certain zoom levels?

    The DarkSky API offers different data nodes, e.g. hourly and daily data. Not all metrics are available on all levels. During selection, this datasource offers all metrics available on any level of DarkSky data. If in doubt which metric to choose please take a look at the raw DarkSky API response.

Development

Using Docker:

  1. Clone the repo and cd into the folder grafana-darksky
  2. make sure you have yarn installed
  3. install the project dependencies: yarn install
  4. Start the watch task with yarn: yarn watch
  5. run the docker from the docker compose file with: docker-compose -f "docker-compose.yml" up -d --build
  6. Open grafana at http://localhost:3000
  7. Login with "admin" and password "admin"
  8. Now you can get started

Installing DarkSky on Grafana Cloud:

For more information, visit the docs on plugin installation.

Installing on a local Grafana:

For local instances, plugins are installed and updated via a simple CLI command. Plugins are not updated automatically, however you will be notified when updates are available right within your Grafana.

1. Install the Data Source

Use the grafana-cli tool to install DarkSky from the commandline:

grafana-cli plugins install 

The plugin will be installed into your grafana plugins directory; the default is /var/lib/grafana/plugins. More information on the cli tool.

2. Configure the Data Source

Accessed from the Grafana main menu, newly installed data sources can be added immediately within the Data Sources section.

Next, click the Add data source button in the upper right. The data source will be available for selection in the Type select box.

To see a list of installed data sources, click the Plugins item in the main menu. Both core data sources and installed data sources will appear.