MySQL Server Exporter
On this page:
Introduction
The following quickstart provides setup instructions and preconfigured dashboards, alerting rules, and recording rules for the MySQL Exporter. After running through the steps in this quickstart, you will have:
Set up and configured MySQL Exporter to collect MySQL metrics like queries per second (QPS) and InnoDB buffer pool size. MySQL Exporter will expose these as Prometheus-style metrics.
Configured Prometheus to scrape MySQL Exporter metrics and optionally ship them to Grafana Cloud.
Set up a preconfigured and curated set of recording rules to cache frequent queries.
Imported Grafana dashboards to visualize your metrics data.
Set up Prometheus alerting rules to alert on your metrics data.
Metrics usage
This exporter publishes roughly 1000 Prometheus time series by default. To see a list of metrics shipped by default with this exporter, please download a sample metrics scrape here.
Note that depending on its configuration, MySQL Exporter may collect and publish far more metrics than this default set. To learn more about configuring MySQL Exporter and toggling its collectors, please see the MySQL Exporter GitHub repository.
Beyond toggling MySQL Exporter’s settings, you can reduce metrics usage by dropping time series you don’t need to store in Prometheus or Grafana Cloud. To learn how to do this, please see Reducing Prometheus metrics usage with relabeling from the Grafana Cloud docs.
Grafana Cloud’s Linux Node Integration
If you’re using Grafana Cloud, you can skip all of the steps in this guide by installing the MySQL Integration, which is designed to help you get up and running in a few commands and clicks. Sign up for free.
To learn how to get MySQL metrics using the MySQL Integration, please see MySQL Integration from the Grafana Cloud docs.
On this page:
MySQL Exporter Quickstart
In this guide you’ll learn how to set up and configure the MySQL Server Exporter to collect MySQL metrics like queries per second (QPS) and InnoDB buffer pool size, and expose them as Prometheus-style metrics. You’ll then configure Prometheus to scrape MySQL metrics and optionally ship them to Grafana Cloud. Finally, you’ll set up a preconfigured and curated set of recording rules, Grafana dashboards, and alerting rules. At the end of this guide you’ll have dashboards that you can use to visualize your MySQL Server metrics, and set of preconfigured alerts.
If you’re using Grafana Cloud, the MySQL Integration can help you get up and running quickly. The MySQL Integration embeds the MySQL exporter into the Grafana Cloud Agent and automatically provisions alerting rules and dashboards, so you don’t have to run through the steps in this guide. To learn how to set up Node Exporter using the MySQL Integration, please see MySQL Integration from the Grafana Cloud docs.
Prerequisites
Before you get started, you should have the following available to you:
- A machine compatible with a MySQL Server Exporter release. To see a list of available releases, please see Releases.
- MySQL running on your machine. To learn more about installing and running MySQL, please see the MySQL Installation Guide.
- Prometheus running in your environment or directly on the machine. To learn how to install Prometheus, please see Installation from the Prometheus docs.
- Grafana running in your environment or directly on the machine. To learn how to install Grafana, please see Install Grafana from the Grafana docs.
- (Optional) A Grafana Cloud account. Grafana Cloud hosts Grafana and a Mimir-based Prometheus metrics endpoint. You will still need to scrape metrics, using either Prometheus installed in your environment, or the Grafana Cloud Agent. To learn more about Grafana Cloud, please see Grafana Cloud.
Step 1: Setting up the MySQL Server Exporter
In this step you’ll set up the MySQL Server exporter on your machine to collect and expose MySQL metrics in Prometheus format. This guide uses an Ubuntu 20.04 system with MySQL 8.0.23. Steps may vary slightly depending on your operating system and MySQL version.
To begin, log in to your machine and download the relevant MySQL Exporter binary. This guide uses the linux-amd64 binary but you should choose the one corresponding to your system’s OS and architecture:
wget https://github.com/prometheus/mysqld_exporter/releases/download/v0.12.1/mysqld_exporter-0.12.1.linux-amd64.tar.gzReplace v0.12.1.linux-amd64 with the version you’d like to install. This guide may become stale so it’s best to check the MySQL Exporter Releases page for the latest stable version.
Unzip the tarball and cd into the directory:
tar xvfz mysqld_exporter-*.*-amd64.tar.gz
cd mysqld_exporter-*.*-amd64Before you run the MySQL exporter, you first need to create the MySQL user that it’ll use to fetch database metrics. Log in to your MySQL database and run the following command as a user with administrative privileges:
CREATE USER 'exporter'@'localhost' IDENTIFIED BY 'enter_password_here' WITH MAX_USER_CONNECTIONS 3;Query OK, 0 rows affected (0.03 sec)Note: It’s recommended to set a maximum connection limit for the exporter user to avoid overloading the server with monitoring scrapes under heavy load. This is not supported on all MySQL/MariaDB versions; for example, MariaDB 10.1 (provided with Ubuntu 18.04) does not support this feature.
Next, grant this new user the appropriate permissions to fetch database metrics:
GRANT PROCESS, REPLICATION CLIENT, SELECT ON *.* TO 'exporter'@'localhost';Query OK, 0 rows affected (0.02 sec)Now that you’ve created the exporter MySQL user, you’re ready to test the exporter.
Set the following environment variable:
export DATA_SOURCE_NAME='exporter:enter_password_here@(mysql_hostname:3306)/'Be sure to replace exporter with the user you created above, enter_password_here with the password you defined, and mysql_hostname with the hostname of the MySQL instance (localhost if you’re on the same machine).
Finally, run the exporter:
./mysqld_exporterINFO[0000] Starting mysqld_exporter (version=0.12.1, branch=HEAD, revision=48667bf7c3b438b5e93b259f3d17b70a7c9aff96) source="mysqld_exporter.go:257"
INFO[0000] Build context (go=go1.12.7, user=root@0b3e56a7bc0a, date=20190729-12:35:58) source="mysqld_exporter.go:258"
INFO[0000] Enabled scrapers: source="mysqld_exporter.go:269"
INFO[0000] --collect.slave_status source="mysqld_exporter.go:273"
INFO[0000] --collect.global_status source="mysqld_exporter.go:273"
INFO[0000] --collect.global_variables source="mysqld_exporter.go:273"
INFO[0000] --collect.info_schema.query_response_time source="mysqld_exporter.go:273"
INFO[0000] --collect.info_schema.innodb_cmp source="mysqld_exporter.go:273"
INFO[0000] --collect.info_schema.innodb_cmpmem source="mysqld_exporter.go:273"
INFO[0000] Listening on :9104 source="mysqld_exporter.go:283"If you see the above output, you successfully ran the MySQL Server exporter.
MySQL Exporter publishes MySQL metrics in Prometheus format on port 9104. You can test this using curl. You will need to open a new SSH session or background the MySQL Exporter process to use curl.
curl http://localhost:9104/metrics. . .
process_resident_memory_bytes 1.2079104e+07
# HELP process_start_time_seconds Start time of the process since unix epoch in seconds.
# TYPE process_start_time_seconds gauge
process_start_time_seconds 1.61377616023e+09
# HELP process_virtual_memory_bytes Virtual memory size in bytes.
# TYPE process_virtual_memory_bytes gauge
process_virtual_memory_bytes 1.16355072e+08
# HELP process_virtual_memory_max_bytes Maximum amount of virtual memory available in bytes.
# TYPE process_virtual_memory_max_bytes gauge
process_virtual_memory_max_bytes -1
# HELP promhttp_metric_handler_requests_in_flight Current number of scrapes being served.
# TYPE promhttp_metric_handler_requests_in_flight gauge
promhttp_metric_handler_requests_in_flight 1
# HELP promhttp_metric_handler_requests_total Total number of scrapes by HTTP status code.
# TYPE promhttp_metric_handler_requests_total counter
promhttp_metric_handler_requests_total{code="200"} 1
promhttp_metric_handler_requests_total{code="500"} 0
promhttp_metric_handler_requests_total{code="503"} 0If you see the above output, you’re ready to begin scraping MySQL metrics using Prometheus.
To avoid running and managing MySQL Exporter from the command line, you can create a systemd service. To learn how to do this, please see Creating a systemd service to manage the agent. Replace the path to the agent binary with the path to MySQL Exporter.
You can use a my.cnf file to set the username and password the MySQL Exporter will use. In addition, the exporter provides many flags to configure which metrics to scrape and where to publish them. To learn more about these features, please see the MySQL Exporter GitHub repository.
Step 2: Scraping MySQL Exporter using Prometheus
Now that the MySQL Exporter is up and running on your machine, you can configure a Prometheus scrape job to collect and store MySQL Exporter metrics.
Add the following scrape job config to the scrape_configs section of your prometheus.yml configuration file:
- job_name: mysql
  static_configs:
- targets: ['mysql_exporter_machine_IP_address:9104']Replace mysql_exporter_machine_IP_address with the IP address of the machine running MySQL Exporter. If you’re running Prometheus on the same machine, this will be localhost. To learn more about configuring Prometheus, please see Configuration from the Prometheus docs.
If you don’t have a prometheus.yml configuration file, create a simple one using your favorite text editor. Open your preferred text editor and paste in the following Prometheus configuration:
global:
  scrape_interval: 15s

scrape_configs:
- job_name: mysql
  static_configs:
- targets: ['mysql_exporter_machine_IP_address:9104']This configuration tells Prometheus to scrape all jobs every 15 seconds. The only configured scrape job is called mysql and defines a mysql_exporter_machine_IP_address:9104 target. By default, Prometheus will scrape the /metrics endpoint using HTTP.
Save and close the file. You can then run Prometheus with the file using the following command:
./prometheus --config.file=./prometheus.ymlShipping metrics to Grafana Cloud
To ship MySQL Exporter metrics to Grafana Cloud from Prometheus, configure the remote_write parameter in your prometheus.yml configuration file. To learn more, please see Metrics — Prometheus from the Grafana Cloud docs. To learn more about the remote_write parameter, please see remote_write from the Prometheus docs.
Step 3: Configure recording rules
Using recording rules, you can precompute and cache frequently queried metrics. For example, if a dashboard panel uses a computationally intensive query like a rate(), you can create a recording rule that runs at a regular reduced interval and saves the result of the intensive query in a new time series. This avoids fetching and computing data every time the dashboard gets refreshed. To learn more about Prometheus recording rules, please see Recording Rules from the Prometheus docs.
You should load the following recording rules before loading the dashboards in this guide. The dashboard queries and alerting rules use recording rules to reduce load on the Prometheus or Grafana Cloud Metrics servers, depending on where you’re evaluating the rules.
You can fetch the recording rule YAML file here.
This recording rule YAML file was generated using the MySQL Exporter mixin.
Load recording rules into Prometheus
To load recording rules into Prometheus, add the following to your prometheus.yml configuration file:
rule_files:
- "mysql_exporter_recording_rules.yml"Be sure to replace mysql_exporter_recording_rules.yml with the path to your MySQL Exporter recording rules YAML file.
Load recording rules into Grafana Cloud
To learn how to load recording rules into Grafana Cloud, please see Prometheus and Loki rules with cortextool.
Step 4: Configuring dashboards
This quickstart includes one dashboard: MySQL Overview.
To learn how to import this dashboard into Grafana, please see Importing a dashboard from the Grafana docs.
The dashboard queries depend on the recording rules defined in the previous step. Be sure to import these before importing the dashboards.
You can fetch the dashboard here.
Step 5: Configuring alerts
With Prometheus alerting rules, you can define alerts that fire when PromQL expressions breach some threshold or satisfy specified conditions over a period of time. For example, you can define a HighRequestLatency alert that fires when a request latency metric is greater than some threshold over a period of time. As soon as the alerting condition is triggered, the alert moves into Pending state. After satisfying the condition for the period of time defined by the for parameter, the alert moves into Firing state. You can configure routing and notifications for firing alerts using a tool like Alertmanager. Alertmanager is also built-in to Grafana Cloud.
You can fetch the alerting rule YAML file here.
Load alerting rules into Prometheus
To load alerting rules into Prometheus, add the following to your prometheus.yml configuration file:
rule_files:
- "mysql_exporter_alerting_rules.yml"Be sure to replace mysql_exporter_alerting_rules.yml with the path to your MySQL alerting rules YAML file.
Load alerting rules into Grafana Cloud
To learn how to load alerting rules into Grafana Cloud, please see Prometheus and Loki rules with cortextool.
Conclusion
In this quickstart you installed and ran MySQL Exporter on your Linux machine. You then configured Prometheus to scrape the database and MySQL cluster metrics exposed by MySQL Exporter. You loaded recording rules and alerting rules into Prometheus, and finally imported Grafana dashboards to visualize your MySQL metrics.
If you’re using Grafana Cloud, you can skip all of the steps in this guide by installing the MySQL integration with the Grafana Cloud Agent. This integration embeds a preconfigured MySQL Exporter into the agent and automatically provisions Grafana dashboards and Prometheus alerting and recording rules, so you don’t have to import them manually. To learn how to set up the MySQL integration, please see Grafana Cloud Integrations.
The dashboards, recording rules, and alerting rules were generated using the MySQL Exporter Mixin. Mixins are reusable templates for dasboards, recording rules, and alerts curated and designed by subject matter experts. To learn more, please see the MySQL Mixin repository.
On this page:
You should load the following recording rules before loading the dashboards in this guide. The dashboard queries use recording rules to reduce load on the Prometheus or Grafana Cloud Metrics servers, depending on where you’re evaluating the rules.
This quickstart includes the following recording rules:
record: instance:mysql_slave_lag_seconds- PromQL:
mysql_slave_status_seconds_behind_master - mysql_slave_status_sql_delay
- PromQL:
instance:mysql_heartbeat_lag_seconds- PromQL:
mysql_heartbeat_now_timestamp_seconds - mysql_heartbeat_stored_timestamp_seconds
- PromQL:
job:mysql_transactions:rate5m- PromQL:
sum without (command) (rate(mysql_global_status_commands_total{command=~"(commit|rollback)"}[5m]))
- PromQL:
groups:
- name: mysqld_rules
  rules:
  - expr: mysql_slave_status_seconds_behind_master - mysql_slave_status_sql_delay
    record: instance:mysql_slave_lag_seconds
  - expr: mysql_heartbeat_now_timestamp_seconds - mysql_heartbeat_stored_timestamp_seconds
    record: instance:mysql_heartbeat_lag_seconds
  - expr: sum without (command) (rate(mysql_global_status_commands_total{command=~"(commit|rollback)"}[5m]))
record: job:mysql_transactions:rate5mThis recording rule YAML file was generated using the MySQL Exporter mixin.
On this page:
Note: These dashboards may depend on the recording rules in the previous tab. Be sure to import these before importing the dashboards.
MySQL Overview Dashboard
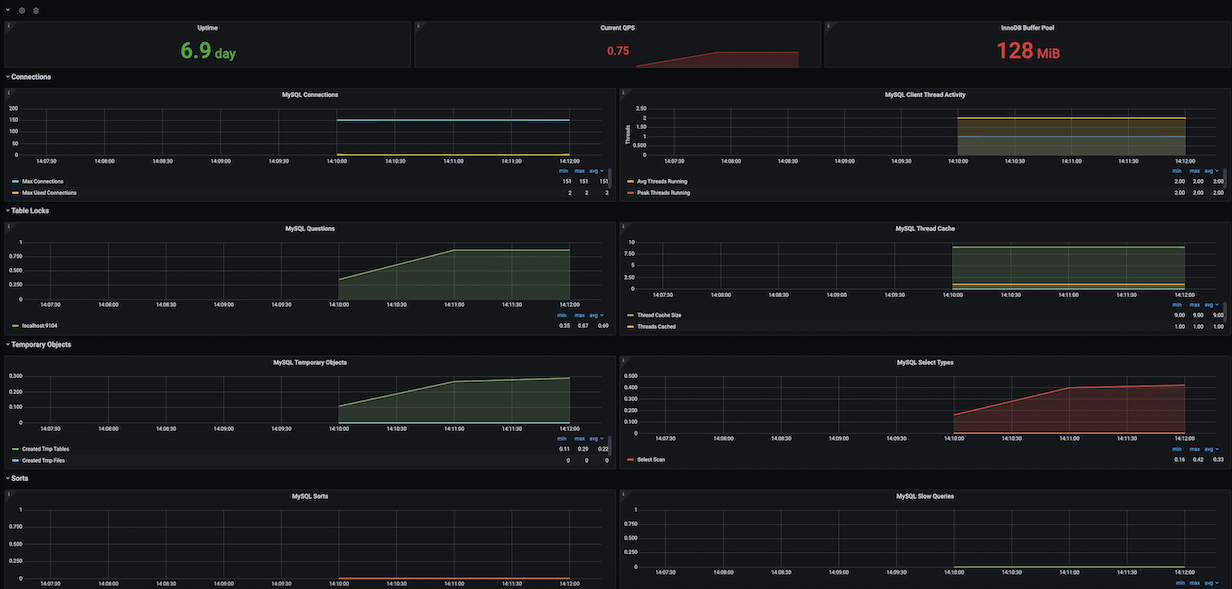
This dashboard includes panels for the following metrics:
- Uptime
- Current QPS
- InnoDB Buffer Pool
- MySQL Connections
- MySQL Client Thread Activity
- MySQL Questions
- MySQL Thread Cache
- MySQL Temporary Objects
- MySQL Select Types
- MySQL Sorts
- MySQL Slow Queries
- MySQL Aborted Connections
- MySQL Table Locks
- MySQL Network Traffic
- MySQL Internal Memory Overview
- Top Command Counters
- MySQL Handlers
- MySQL Transaction Handlers
- Process States
- Top Process States Hourly
- MySQL Query Cache Memory
- MySQL Query Cache Activity
- MySQL File Openings
- MySQL Open Files
- MySQL Table Open Cache Status
- MySQL Open Tables
- MySQL Table Definition Cache
You can import the dashboard directly using the following dashboard ID: 14057.
You can fetch the dashboard JSON here.
This dashboard was generated using the MySQL exporter mixin.
On this page:
This quickstart includes the following alerting rules:
MySQLDownMySQL [job] on [instance] is not up.
MySQLGaleraNotReady[job] on [instance] is not ready.
MySQLGaleraOutOfSync[job] on [instance] is not in sync.
MySQLGaleraDonorFallingBehind[job] on [instance] is a donor (hotbackup) and is falling behind (queue size [value]).
MySQLReplicationNotRunningSlave replication (IO or SQL) has been down for more than 2 minutes.
MySQLReplicationLagThe mysql slave replication has fallen behind and is not recovering.
MySQLInnoDBLogWaitsThe innodb logs are waiting for disk at a rate of [value] / second.
###
# Sample prometheus rules/alerts for mysqld.
#
# NOTE: Please review these carefully as thresholds and behavior may not meet
#       your SLOs or labels.
#
###

groups:
- name: MySQLdAlerts
  rules:
  - alert: MySQLDown
    annotations:
      description: MySQL {{$labels.job}} on {{$labels.instance}} is not up.
      summary: MySQL not up
    expr: mysql_up != 1
    for: 5m
    labels:
      severity: critical
- name: GaleraAlerts
  rules:
  - alert: MySQLGaleraNotReady
    annotations:
      description: '{{$labels.job}} on {{$labels.instance}} is not ready.'
      summary: Galera cluster node not ready
    expr: mysql_global_status_wsrep_ready != 1
    for: 5m
    labels:
      severity: warning
  - alert: MySQLGaleraOutOfSync
    annotations:
      description: '{{$labels.job}} on {{$labels.instance}} is not in sync ({{$value}} != 4).'
      summary: Galera cluster node out of sync
    expr: (mysql_global_status_wsrep_local_state != 4 and mysql_global_variables_wsrep_desync == 0)
    for: 5m
    labels:
      severity: warning
  - alert: MySQLGaleraDonorFallingBehind
    annotations:
      description: '{{$labels.job}} on {{$labels.instance}} is a donor (hotbackup) and is falling behind (queue size {{$value}}).'
      summary: xtradb cluster donor node falling behind
    expr: (mysql_global_status_wsrep_local_state == 2 and mysql_global_status_wsrep_local_recv_queue > 100)
    for: 5m
    labels:
      severity: warning
  - alert: MySQLReplicationNotRunning
    annotations:
      description: Slave replication (IO or SQL) has been down for more than 2 minutes.
      summary: Slave replication is not running
    expr: mysql_slave_status_slave_io_running == 0 or mysql_slave_status_slave_sql_running == 0
    for: 2m
    labels:
      severity: critical
  - alert: MySQLReplicationLag
    annotations:
      description: The mysql slave replication has fallen behind and is not recovering
      summary: MySQL slave replication is lagging
    expr: (instance:mysql_slave_lag_seconds > 30) and on(instance) (predict_linear(instance:mysql_slave_lag_seconds[5m], 60 * 2) > 0)
    for: 1m
    labels:
      severity: critical
  - alert: MySQLReplicationLag
    annotations:
      description: The mysql slave replication has fallen behind and is not recovering
      summary: MySQL slave replication is lagging
    expr: (instance:mysql_heartbeat_lag_seconds > 30) and on(instance) (predict_linear(instance:mysql_heartbeat_lag_seconds[5m], 60 * 2) > 0)
    for: 1m
    labels:
      severity: critical
  - alert: MySQLInnoDBLogWaits
    annotations:
      description: The innodb logs are waiting for disk at a rate of {{$value}} / second
      summary: MySQL innodb log writes stalling
    expr: rate(mysql_global_status_innodb_log_waits[15m]) > 10
    labels:
severity: warningThis alerting rule YAML file was generated using the MySQL Exporter mixin.
On this page:
Grafana Cloud comes with an ever-expanding set of integrations to quickly get an observability stack up and running in minutes. The MySQL Integration, built-in to the Grafana Cloud Agent, exposes and scrapes essential MySQL metrics and pushes them to Grafana Cloud. The agent will scrape metrics using an embedded MySQL Exporter, and Grafana Cloud will automatically provision tailored Grafana dashboards and alerts for visualizing and acting on this data.
To learn more, check out the Grafana Cloud docs.
How it works
Configuring, installing, connecting, and maintaining Prometheus monitoring components typically involves significant domain knowledge. It can take quite a while to go from setup to dashboard and alerts. As the creators of Grafana - and core contributors to Prometheus and Cortex - we build simple integrations to abstract some of this work away in order to quickly get started. How it works:
- Sign up (or log in) for a free Grafana Cloud account.
- Select the target you’d like to observe (an ever-expanding catalogue).
- Run a one-line command to install the Grafana Cloud Agent. The agent embeds and preconfigures Exporters to expose default metrics, and pushes them to the Grafana Cloud metrics backend.
- Voila! You’ll see tailored Grafana dashboards and will benefit from sane alerting defaults.
Looking for a different Exporter or integration? Check out our growing library of integrations for popular components like MySQL, Postgres, Redis, Memcached and more.