Elasticsearch Exporter
On this page:
Introduction
The following quickstart provides setup instructions and preconfigured dashboards, alerting rules, and recording rules for Elasticsearch Exporter. After running through the steps in this quickstart, you will have:
Set up and configured Elasticsearch Exporter to collect Elasticsearch metrics like cluster status, active shards, JVM metrics, Elasticsearch load. Elasticsearch Exporter will expose these as Prometheus-style metrics.
Configured Prometheus to scrape Elasticsearch Exporter metrics and optionally ship them to Grafana Cloud.
Set up a preconfigured and curated set of recording rules to cache frequent Prometheus queries.
Imported Grafana dashboards to visualize your metrics data.
Set up Prometheus alerting rules to alert on your metrics data.
Metrics usage
This exporter publishes roughly 392 Prometheus time series by default. To see a list of metrics shipped by default with this exporter, please download a sample metrics scrape here.
Note that depending on its configuration, Elasticsearch Exporter may collect and publish far more metrics than this default set. To learn more about configuring Elasticsearch Exporter and toggling its collectors, please see the Elasticsearch Exporter GitHub repository.
Beyond toggling Elasticsearch Exporter’s settings, you can reduce metrics usage by dropping time series you don’t need to store in Prometheus or Grafana Cloud. To learn how to do this, please see Reducing Prometheus metrics usage with relabeling from the Grafana Cloud docs.
Grafana Cloud’s Elasticsearch Integration
If you’re using Grafana Cloud, you can skip all of the steps in this guide by installing the Elasticsearch Exporter Integration, which is designed to help you get up and running in a few commands and clicks. Sign up for free.
To learn how to set up Elasticsearch Exporter using the Elasticsearch Exporter Integration, please see Elasticsearch Exporter Integration from the Grafana Cloud docs.
On this page:
Elasticsearch Exporter Quickstart
In this guide you’ll learn how to set up and configure the Elasticsearch Exporter to collect Elasticsearch metrics like cluster status, active shards, JVM metrics, Elasticsearch load, and expose them as Prometheus-style metrics. You’ll then configure Prometheus to scrape Elasticsearch metrics and optionally ship them to Grafana Cloud. Finally, you’ll set up a preconfigured and curated set of recording rules, Grafana dashboards, and alerting rules. At the end of this guide you’ll have dashboards that you can use to visualize your Elasticsearch metrics, and set of preconfigured alerts.
If you’re using Grafana Cloud, the Elasticsearch Integration can help you get up and running quickly. The Elasticsearch Integration embeds the Elasticsearch Exporter into the Grafana Cloud Agent and automatically provisions alerting rules and dashboards, so you don’t have to run through the steps in this guide. To learn how to set up Elasticsearch Exporter using the Elasticsearch Integration, please see Elasticsearch Integration from the Grafana Cloud docs.
Prerequisites
Before you get started, you should have the following available to you:
- A machine compatible with a Elasticsearch Exporter release. To see a list of available releases, please see Releases.
- Elasticsearch running on your machine. To learn more about installing and running Elasticsearch, please see the Elasticsearch Installation Guide.
- Prometheus running in your environment or directly on the machine. To learn how to install Prometheus, please see Installation from the Prometheus docs.
- Grafana running in your environment or directly on the machine. To learn how to install Grafana, please see Install Grafana from the Grafana docs.
- (Optional) A Grafana Cloud account. Grafana Cloud hosts Grafana and a Mimir-based Prometheus metrics endpoint. You will still need to scrape metrics, using either Prometheus installed in your environment, or the Grafana Cloud Agent. To learn more about Grafana Cloud, please see Grafana Cloud.
Step 1: Setting up Elasticsearch Exporter
In this step you’ll set up the Elasticsearch exporter on your machine to collect and expose Elasticsearch metrics in Prometheus format. This guide uses an Ubuntu 20.04 system with Elasticsearch 7.12.0. Steps may vary slightly depending on your operating system and Elasticsearch version.
To begin, log in to your machine and download the relevant Elasticsearch Exporter binary. This guide uses the linux-amd64 binary but you should choose the one corresponding to your system’s OS and architecture:
wget https://github.com/justwatchcom/elasticsearch_exporter/releases/download/v1.1.0/elasticsearch_exporter-1.1.0.linux-amd64.tar.gzReplace v1.1.0 with the version you’d like to install. This guide may become stale so it’s best to check the Elasticsearch Exporter Releases page for the latest stable version.
Unzip the tarball and cd into the directory:
tar xvfz elasticsearch_exporter-1.1.0.linux-amd64.tar.gz
cd elasticsearch_exporter-1.1.0.linux-amd64If you are running Elasticsearch on the same Linux machine, your Elasticsearch endpoint will be http://localhost:9200. Depending on your setup, this may be different and can be set using the --es.uri flag.
Finally, run the exporter:
./elasticsearch_exporter --es.uri="http://localhost:9200"
level=info ts=2021-03-31T10:39:42.180223026Z caller=clusterinfo.go:200 msg="triggering initial cluster info call"
level=info ts=2021-03-31T10:39:42.180423443Z caller=clusterinfo.go:169 msg="providing consumers with updated cluster info label"
level=info ts=2021-03-31T10:39:42.18398451Z caller=main.go:148 msg="started cluster info retriever" interval=5m0s
level=info ts=2021-03-31T10:39:42.184156478Z caller=main.go:188 msg="starting elasticsearch_exporter" addr=:9114If you see the above output, you successfully ran Elasticsearch Exporter.
Elasticsearch Exporter publishes Elasticsearch metrics in Prometheus format on port 9114. You can test this using curl. You will need to open a new SSH session or background the Elasticsearch Exporter process to use curl.
curl http://localhost:9114/metrics# HELP elasticsearch_node_stats_up Was the last scrape of the ElasticSearch nodes endpoint successful.
# TYPE elasticsearch_node_stats_up gauge
elasticsearch_node_stats_up 1
# HELP elasticsearch_nodes_roles Node roles
# TYPE elasticsearch_nodes_roles gauge
elasticsearch_nodes_roles{cluster="es-docker-cluster",host="172.29.0.2",name="es01",role="client"} 1
elasticsearch_nodes_roles{cluster="es-docker-cluster",host="172.29.0.2",name="es01",role="data"} 1
elasticsearch_nodes_roles{cluster="es-docker-cluster",host="172.29.0.2",name="es01",role="ingest"} 1
elasticsearch_nodes_roles{cluster="es-docker-cluster",host="172.29.0.2",name="es01",role="master"} 1
# HELP elasticsearch_os_cpu_percent Percent CPU used by OS
# TYPE elasticsearch_os_cpu_percent gauge
elasticsearch_os_cpu_percent{cluster="es-docker-cluster",es_client_node="true",es_data_node="true",es_ingest_node="true",es_master_node="true",host="172.29.0.2",name="es01"} 0
# HELP elasticsearch_os_load1 Shortterm load average
# TYPE elasticsearch_os_load1 gauge
elasticsearch_os_load1{cluster="es-docker-cluster",es_client_node="true",es_data_node="true",es_ingest_node="true",es_master_node="true",host="172.29.0.2",name="es01"} 0
# HELP elasticsearch_os_load15 Longterm load average
# TYPE elasticsearch_os_load15 gauge
elasticsearch_os_load15{cluster="es-docker-cluster",es_client_node="true",es_data_node="true",es_ingest_node="true",es_master_node="true",host="172.29.0.2",name="es01"} 0.05
# HELP elasticsearch_os_load5 Midterm load average
# TYPE elasticsearch_os_load5 gauge
elasticsearch_os_load5{cluster="es-docker-cluster",es_client_node="true",es_data_node="true",es_ingest_node="true",es_master_node="true",host="172.29.0.2",name="es01"} 0
# HELP elasticsearch_os_mem_actual_free_bytes Amount of free physical memory in bytes
# TYPE elasticsearch_os_mem_actual_free_bytes gauge
elasticsearch_os_mem_actual_free_bytes{cluster="es-docker-cluster",es_client_node="true",es_data_node="true",es_ingest_node="true",es_master_node="true",host="172.29.0.2",name="es01"} 0If you see the above output, you’re ready to begin scraping Elasticsearch metrics using Prometheus.
To avoid running and managing Elasticsearch Exporter from the command line, you can create a systemd service. To learn how to do this, please see Creating a systemd service to manage the agent. Replace the path to the agent binary with the path to Elasticsearch Exporter.
The Elasticsearch exporter provide features such as shard-level stats, cluster snapshot stats, etc. To learn more about these features, please see the Elasticsearch Exporter GitHub repository.
Step 2: Scraping Elasticsearch Exporter using Prometheus
Now that the Elasticsearch Exporter is up and running on your machine, you can configure a Prometheus scrape job to collect and store Elasticsearch Exporter metrics.
Add the following scrape job config to the scrape_configs section of your prometheus.yml configuration file:
- job_name: elasticsearch
  static_configs:
- targets: ['elasticsearch_exporter_machine_IP_address:9114']Replace elasticsearch_exporter_machine_IP_address with the IP address of the machine running Elasticsearch Exporter. If you’re running Prometheus on the same machine, this will be localhost. To learn more about configuring Prometheus, please see Configuration from the Prometheus docs.
If you don’t have a prometheus.yml configuration file, create a simple one using your favorite text editor. Open your preferred text editor and paste in the following Prometheus configuration:
global:
  scrape_interval: 15s

scrape_configs:
- job_name: elasticsearch
  static_configs:
- targets: ['elasticsearch_exporter_machine_IP_address:9114']This configuration tells Prometheus to scrape all jobs every 15 seconds. The only configured scrape job is called elasticsearch and defines a elasticsearch_exporter_machine_IP_address:9114 target. By default, Prometheus will scrape the /metrics endpoint using HTTP.
Save and close the file. You can then run Prometheus with the file using the following command:
./prometheus --config.file=./prometheus.ymlShipping metrics to Grafana Cloud
To ship MySQL Exporter metrics to Grafana Cloud from Prometheus, configure the remote_write parameter in your prometheus.yml configuration file. To learn more, please see Metrics — Prometheus from the Grafana Cloud docs. To learn more about the remote_write parameter, please see remote_write from the Prometheus docs.
Step 3: Configure recording rules
Using recording rules, you can precompute and cache frequently queried metrics. For example, if a dashboard panel uses a computationally intensive query like a rate(), you can create a recording rule that runs at a regular reduced interval and saves the result of the intensive query in a new time series. This avoids fetching and computing data every time the dashboard gets refreshed. To learn more about Prometheus recording rules, please see Recording Rules from the Prometheus docs.
You should load the following recording rules before loading the dashboards in this guide. The dashboard queries and alerting rules use recording rules to reduce load on the Prometheus or Grafana Cloud Metrics servers, depending on where you’re evaluating the rules.
You can fetch the recording rule YAML file here.
This recording rule YAML file was generated using the Elasticsearch Exporter mixin.
Load recording rules into Prometheus
To load recording rules into Prometheus, add the following to your prometheus.yml configuration file:
rule_files:
- "elasticsearch_exporter_recording_rules.yml"Be sure to replace elasticsearch_exporter_recording_rules.yml with the path to your Elasticsearch Exporter recording rules YAML file.
Load recording rules into Grafana Cloud
To learn how to load recording rules into Grafana Cloud, please see Prometheus and Loki rules with cortextool.
Step 4: Configuring dashboards
This quickstart includes one dashboard:
- Elasticsearch Overview
To learn how to import these dashboards into Grafana, please see Importing a dashboard from the Grafana docs.
These dashboard queries may depend on the recording rules defined in the previous step. Be sure to import these before importing the dashboards.
You can fetch the dashboards here.
Step 5: Configuring alerts
With Prometheus alerting rules, you can define alerts that fire when PromQL expressions breach some threshold or satisfy specified conditions over a period of time. For example, you can define a HighRequestLatency alert that fires when a request latency metric is greater than some threshold over a period of time. As soon as the alerting condition is triggered, the alert moves into Pending state. After satisfying the condition for the period of time defined by the for parameter, the alert moves into Firing state. You can configure routing and notifications for firing alerts using a tool like Alertmanager. Alertmanager is also built-in to Grafana Cloud.
You can fetch the alerting rule YAML file here.
Load alerting rules into Prometheus
To load alerting rules into Prometheus, add the following to your prometheus.yml configuration file:
rule_files:
- "elasticsearch_exporter_alerting_rules.yml"Be sure to replace elasticsearch_exporter_alerting_rules.yml with the path to your Elasticsearch alerting rules YAML file.
Load alerting rules into Grafana Cloud
To learn how to load alerting rules into Grafana Cloud, please see Prometheus and Loki rules with cortextool.
Conclusion
In this quickstart you installed and ran Elasticsearch Exporter on your Linux machine. You then configured Prometheus to scrape the database and Elasticsearch metrics exposed by Elasticsearch Exporter. You loaded recording rules and alerting rules into Prometheus, and finally imported Grafana dashboards to visualize your Elasticsearch metrics.
If you’re using Grafana Cloud, you can skip all of the steps in this guide by installing the Elasticsearch integration with the Grafana Cloud Agent. This integration embeds a preconfigured Elasticsearch Exporter into the agent and automatically provisions Grafana dashboards and Prometheus alerting and recording rules, so you don’t have to import them manually. To learn how to set up the Elasticsearch integration, please see Grafana Cloud Integrations.
The dashboards, recording rules, and alerting rules were generated using the Elasticsearch Exporter Mixin. Mixins are reusable templates for dasboards, recording rules, and alerts curated and designed by subject matter experts. To learn more, please see the Elasticsearch Mixin repository.
On this page:
You should load the following recording rules before loading the dashboards in this guide. The dashboard queries use recording rules to reduce load on the Prometheus or Grafana Cloud Metrics servers, depending on where you’re evaluating the rules.
This quickstart includes the following recording rules:
elasticsearch_process_cpu_highelasticsearch_os_cpu_highelasticsearch_yellow_cluster_statuselasticsearch_red_cluster_statuselasticsearch_filesystem_data_used_percentelasticsearch_filesystem_data_free_percentelasticsearch_node_disk_watermark_reachedelasticsearch_heap_utilization_percentage
groups:
- name: elasticsearch_rules
  rules:
  - record: elasticsearch_filesystem_data_free_percent
    expr: 100 - elasticsearch_filesystem_data_used_percent

  - record: elasticsearch_red_cluster_status
    expr: sum by (cluster) (elasticsearch_cluster_health_status == 2)

  - record: elasticsearch_yellow_cluster_status
    expr: sum by (cluster) (elasticsearch_cluster_health_status == 1)

  - record: elasticsearch_process_cpu_high
    expr: sum by (cluster, instance, name) (elasticsearch_process_cpu_percent)

  - record: elasticsearch_os_cpu_high
    expr: sum by (cluster, instance, name) (elasticsearch_os_cpu_percent)

  - record: elasticsearch_filesystem_data_used_percent
    expr: sum by (cluster, instance, name) (
      100 * (elasticsearch_filesystem_data_size_bytes - elasticsearch_filesystem_data_free_bytes)
      / elasticsearch_filesystem_data_size_bytes)

  - record: elasticsearch_node_disk_watermark_reached
    expr: sum by (cluster, instance, name) (round(
          (1 - (elasticsearch_filesystem_data_available_bytes / elasticsearch_filesystem_data_size_bytes)
        ) * 100, 0.001))

  - record: elasticsearch_heap_utilization_percentage
    expr: sum by (cluster, instance, name) (
100 * (elasticsearch_jvm_memory_used_bytes{area="heap"} / elasticsearch_jvm_memory_max_bytes{area="heap"}))This recording rule YAML file was generated using the Elasticsearch Exporter mixin.
On this page:
Note: These dashboards may depend on the recording rules in the previous tab. Be sure to import these before importing the dashboards.
Elasticsearch Overview Dashboard
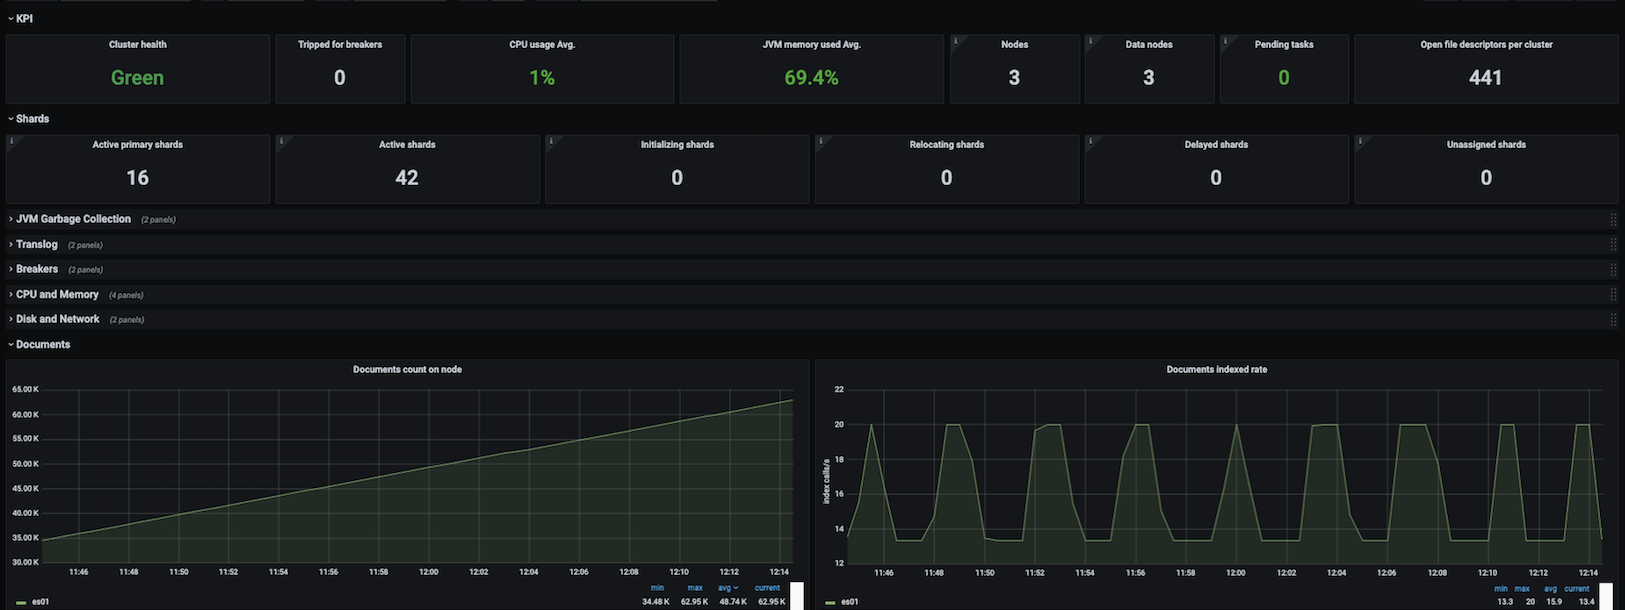
This dashboard includes panels for the following metrics:
- Cluster Health
- CPU and Memory
- Disk Usage
- Network Usage
- Load Average
- JVM Memory Usage
- JVM Garbage Collection
- Tripped for Breakers
- Nodes
- Pending Tasks
- Open file descriptors per Cluster
- Active Primary Shards
- Active, Initializing, Relocating and Delayed Shards
- Translog
- Breakers
- Documents total count and size
- Documents count on node
- Documents indexed, deleted and merged rate
- Documents merged bytes
- Query, Indexing and Merging time
- Throttle time for index store
- Total Operations rate, time and stats
- Thread Pool
- Caches
- Segments
You can import the dashboard directly using the following dashboard ID: 14191
You can fetch the dashboard JSON here.
This dashboard was generated using the Elasticsearch Exporter mixin.
On this page:
This quickstart includes the following alerting rules:
ElasticsearchTooFewNodesRunning
Less than expected Elasticsearch nodes are running
ElasticsearchHeapTooHigh
The heap utilization is too high
ElasticsearchClusterNotHealthy
Yellow or Red Elasticsearch cluster status
ElasticsearchNodeDiskWatermarkReached
Disk is running out of available storage
ElasticsearchProcessCPUHigh
The Elasticsearch process is using too much CPU
SystemCPUHigh
The Elasticsearch node is using too much CPU
Download the following alerting rules YAML filegroups:
- name: elasticsearch-alerts
rules:
- alert: ElasticsearchTooFewNodesRunning
expr: elasticsearch_cluster_health_number_of_nodes < 3
for: 5m
annotations:
description: "There are only {{ $value }} < 3 ElasticSearch nodes running"
summary: ElasticSearch running on less than 3 nodes
labels:
severity: critical
- alert: ElasticsearchHeapTooHigh
expr: elasticsearch_heap_utilization_percentage > 90
for: 15m
annotations:
description: The heap usage is over 90% for 15m
summary: "ElasticSearch node {{ $labels.name }} heap usage is high"
labels:
severity: critical
- alert: ElasticsearchClusterNotHealthy
expr: elasticsearch_red_cluster_status
for: 2m
annotations:
message: "Cluster {{ $labels.cluster }} health status has been RED for at least 2m. Cluster does not accept writes, shards may be missing or master node hasn't been elected yet."
summary: Cluster health status is RED
labels:
severity: critical
- alert: ElasticsearchClusterNotHealthy
expr: elasticsearch_yellow_cluster_status
for: 20m
annotations":
message": "Cluster {{ $labels.cluster }} health status has been YELLOW for at least 20m. Some shard replicas are not allocated."
summary": Cluster health status is YELLOW
labels:
severity: warning
- alert: ElasticsearchNodeDiskWatermarkReached
expr: elasticsearch_node_disk_watermark_reached > 85
for: 5m
annotations:
message: "Disk Low Watermark Reached at {{ $labels.node }} node in {{ $labels.cluster }} cluster. Shards can not be allocated to this node anymore. You should consider adding more disk to the node."
summary: "Disk Low Watermark Reached - disk saturation is {{ $value }}%"
labels:
severity: warning
- alert: ElasticsearchNodeDiskWatermarkReached
expr: elasticsearch_node_disk_watermark_reached > 90
for: 5m
annotations:
message: "Disk High Watermark Reached at {{ $labels.node }} node in {{ $labels.cluster }} cluster. Some shards will be re-allocated to different nodes if possible. Make sure more disk space is added to the node or drop old indices allocated to this node."
summary: "Disk High Watermark Reached - disk saturation is {{ $value }}%"
labels:
severity: critical
- alert: ElasticsearchJVMHeapUseHigh
expr: elasticsearch_heap_utilization_percentage > 75
for: 10m
annotations:
message: "JVM Heap usage on the node {{ $labels.node }} in {{ $labels.cluster }} cluster is {{ $value }}%."
summary: JVM Heap usage on the node is high
labels:
severity: critical
- alert: SystemCPUHigh
expr: elasticsearch_os_cpu_high > 90
for: 1m
annotations":
message: "System CPU usage on the node {{ $labels.node }} in {{ $labels.cluster }} cluster is {{ $value }}%"
summary: System CPU usage is high
labels:
severity: critical
- alert: ElasticsearchProcessCPUHigh
expr: elasticsearch_process_cpu_high > 90
for: 1m
annotations:
message: "ES process CPU usage on the node {{ $labels.node }} in {{ $labels.cluster }} cluster is {{ $value }}%"
summary: ES process CPU usage is high
labels:
severity: criticalThis alerting rule YAML file was generated using the Elasticsearch Exporter mixin.
On this page:
Grafana Cloud comes with an ever-expanding set of integrations to quickly get an observability stack up and running in minutes. The Elasticsearch Integration, built-in to the Grafana Cloud Agent, exposes and scrapes essential Elasticsearch metrics and pushes them to Grafana Cloud. The agent will scrape metrics using an embedded Elasticsearch Exporter, and Grafana Cloud will automatically provision tailored Grafana dashboards and alerts for visualizing and acting on this data.
To learn more, check out the Grafana Cloud docs.
How it works
Configuring, installing, connecting, and maintaining Prometheus monitoring components typically involves significant domain knowledge. It can take quite a while to go from setup to dashboard and alerts. As the creators of Grafana - and core contributors to Prometheus and Cortex - we build simple integrations to abstract some of this work away in order to quickly get started. How it works:
- Sign up (or log in) for a free Grafana Cloud account.
- Select the target you’d like to observe (an ever-expanding catalogue).
- Run a one-line command to install the Grafana Agent. The agent embeds abnd preconfigures Exporters to expose default metrics, and pushes them to the Grafana Cloud metrics backend.
- Voila! You’ll see tailored Grafana dashboards and will benefit from sane alerting defaults.
Looking for a different Exporter or integration? Check out our growing library of integrations for popular components like MySQL, Postgres, Redis, Memcached and more.