Log monitoring for faster troubleshooting at scale

Grafana Cloud Logs is the fully managed log aggregation system powered by Grafana Loki that allows you to store and query logs from all your applications and infrastructure – without worrying about log volumes, costs, or storage limits.
A free plan that’s actually useful
 50GB logs
14-day retention
3 monthly active users
50GB logs
14-day retention
3 monthly active usersAggregate any log data instantly
Go from collecting to querying logs in minutes without worrying about log format, schema, storage tiering, sharding, or indexing.
Log everything with efficient indexing
No need to pick and choose which logs to monitor. Keep all the logs you need while maintaining a small object storage footprint thanks to our novel approach to indexing.
Identify root causes faster
Correlate logs to metrics and traces for rapid troubleshooting when incidents arise — or even before they happen.
Why use Grafana Cloud for log monitoring?
Consistent performance at any scale
- Run faster queries at scale with massive parallelization and query splitting techniques.
- Native support for out-of-order ingestion and bursts of logs, so no more lost logs.
Correlate logs and metrics for rapid troubleshooting
Grafana Cloud Logs mirrors how Prometheus works. The result? Logs consistently have the same metadata as metrics, making it easier for teams to onboard and get started querying and correlating data.
- Logs generated by an application can be correlated natively with Prometheus metrics to gain deeper insights and accelerate root cause detection.
- LogQL, the powerful query language used in Loki, allows complex queries involving field extraction, regular expressions, and pattern matching.
- Create metrics from logs to detect and alert on anomalies. Comes in handy when you can’t instrument your application with metrics or when you’re dealing with high cardinality.
Watch a demo of how to correlate metrics to logs to traces ->
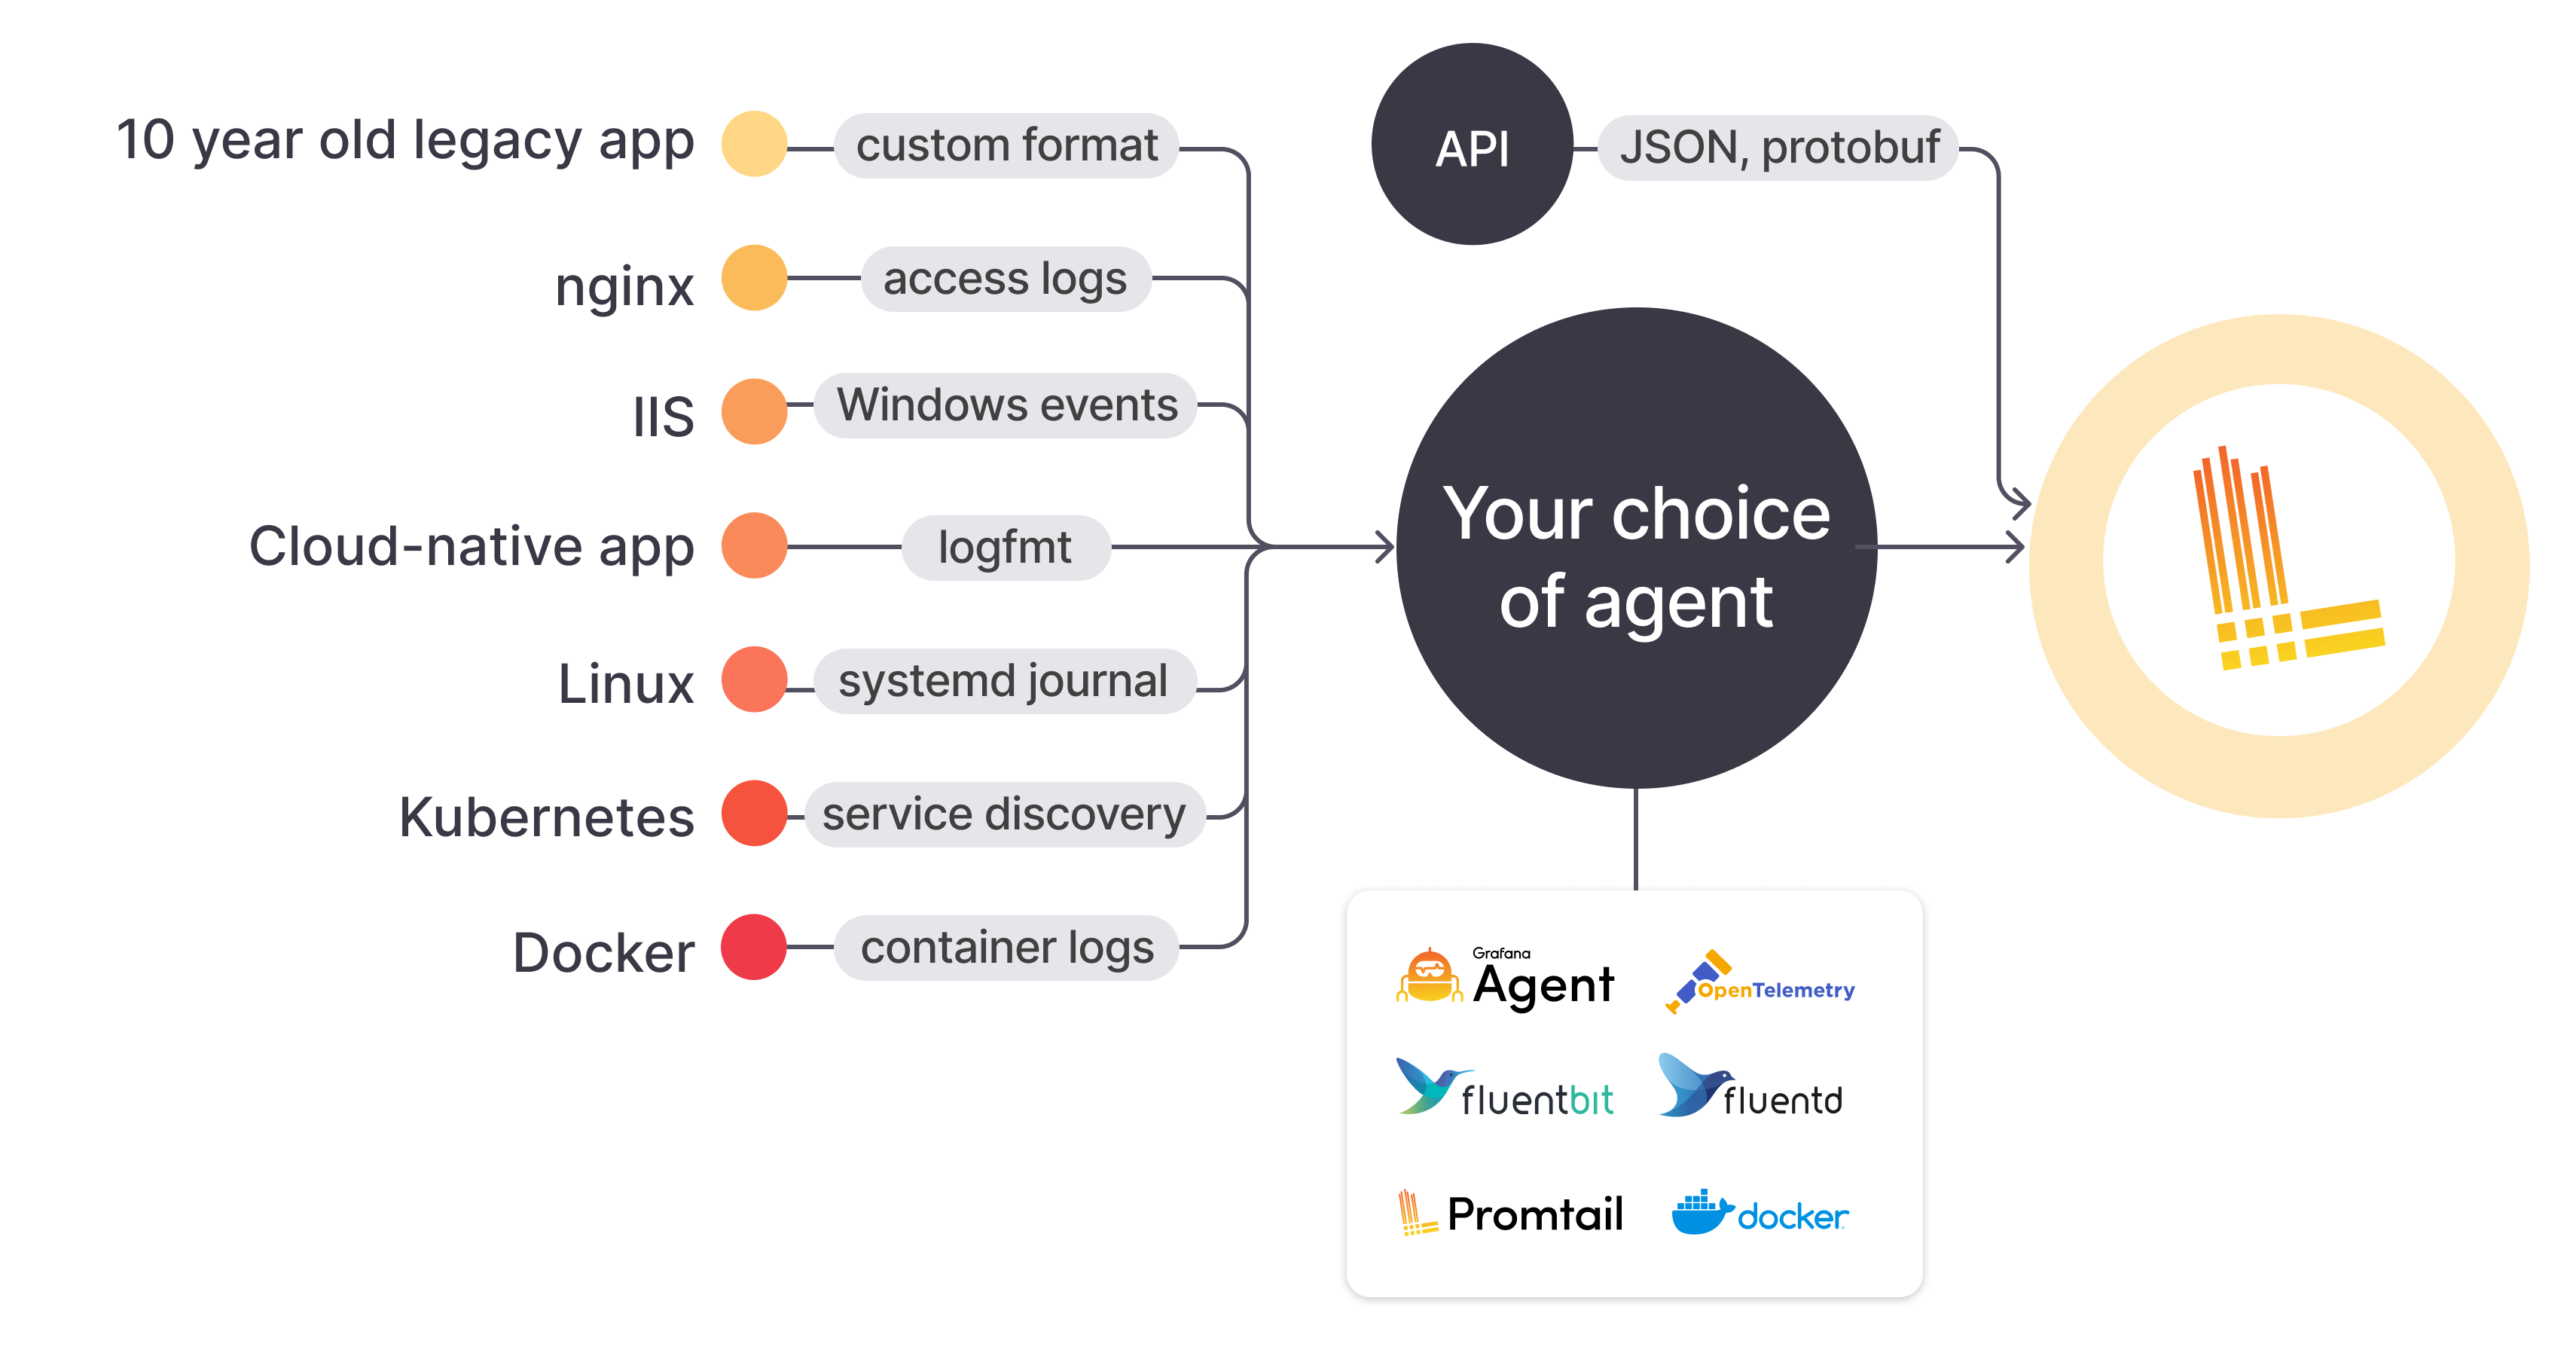
Easy setup for log management
- Leverage Promtail, Fluentbit, Fluentd, Vector, Logstash, the OpenTelemetry Collector, and the Grafana Agent, as well as a host of unofficial clients for shipping logs.
- Pull in log data from many sources — including local log files, the systemd journal, GCP, AWS CloudWatch, Amazon EC2 and EKS, Windows events logs, the Docker logging driver, Kubernetes, and Kafka.
- All log formats are welcome, including JSON, XML, CSV, logfmt, and unstructured text.
Scale log volumes but not your observability costs
Trying to figure out what log data to keep and what to drop in order to manage rising logging costs? Don’t bother. You can store all your log data and still not get overwhelmed or surprised by your bills with Grafana Cloud.
- Analyze, monitor, and optimize your logging spend with the centralized cost management hub.
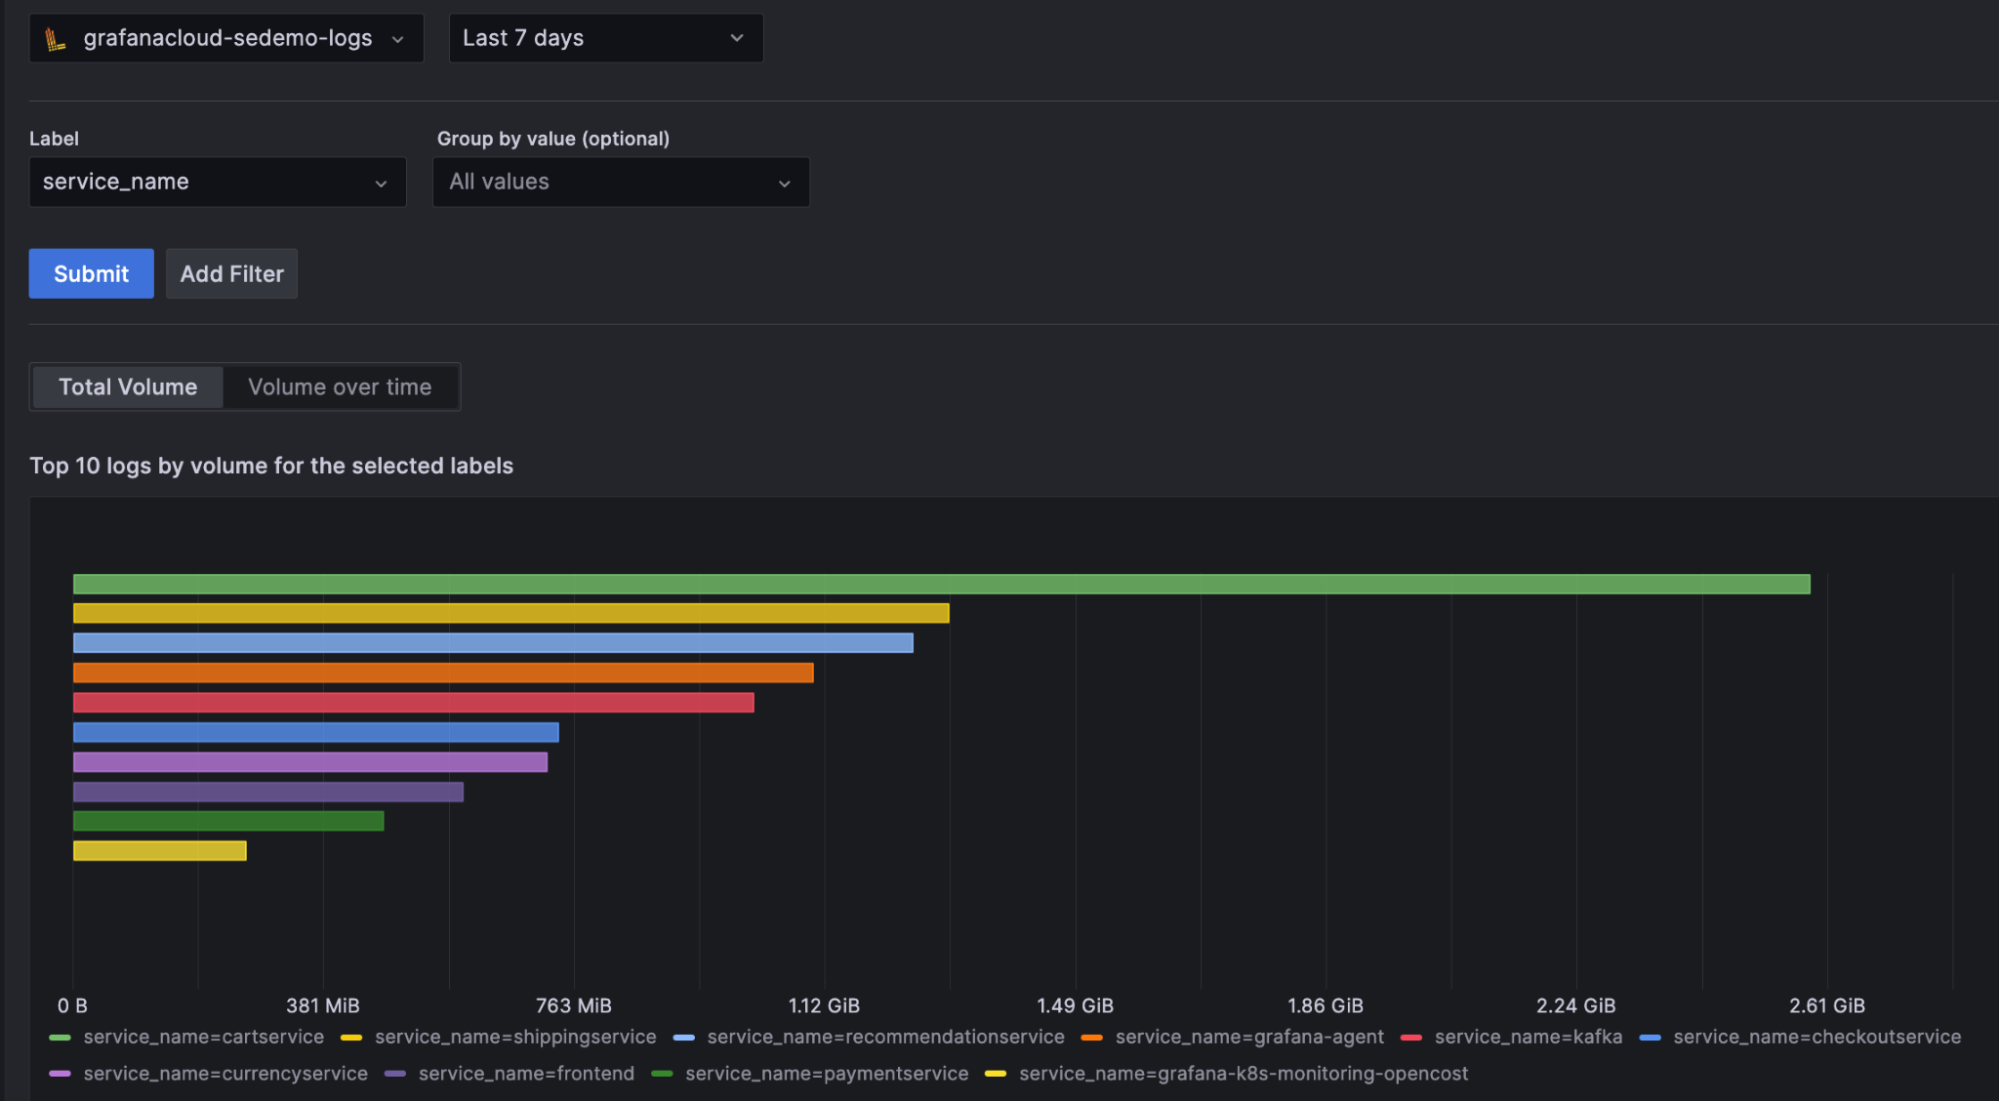
- Investigate and identify the source of high log volumes using the Log Volume Explorer.
- Grafana Cloud Logs Export allows you to store log data in an external object storage of your choice — at no additional cost — for long-term archiving to meet compliance or auditing requirements.
Learn more about cost management tools for logs, metrics, and more ->
Not ready for a fully hosted cloud-based observability solution?
Grafana Loki
Open source horizontally scalable, highly available, multi-tenant log aggregation system inspired by Prometheus.
Grafana Enterprise Logs
Self-hosted logging solution supported by Grafana Labs with a unique approach to log indexing, storage, and administration control.