Visualization and monitoring integrations
Visualization and monitoring integrations
/
Monitor Monitor Supabase with Grafana Cloud in one click
Monitor Supabase with Grafana Cloud in one click
Monitor your Supabase project in minutes with Grafana Cloud’s out-of-the-box observability. Supabase is the easy-to-use, open source, managed Postgres platform with integrated backend services. By integrating Supabase with Grafana Cloud, users gain full visibility into Supabase performance and operations.
Enable Grafana Cloud directly from the Supabase console with a one-click integration.
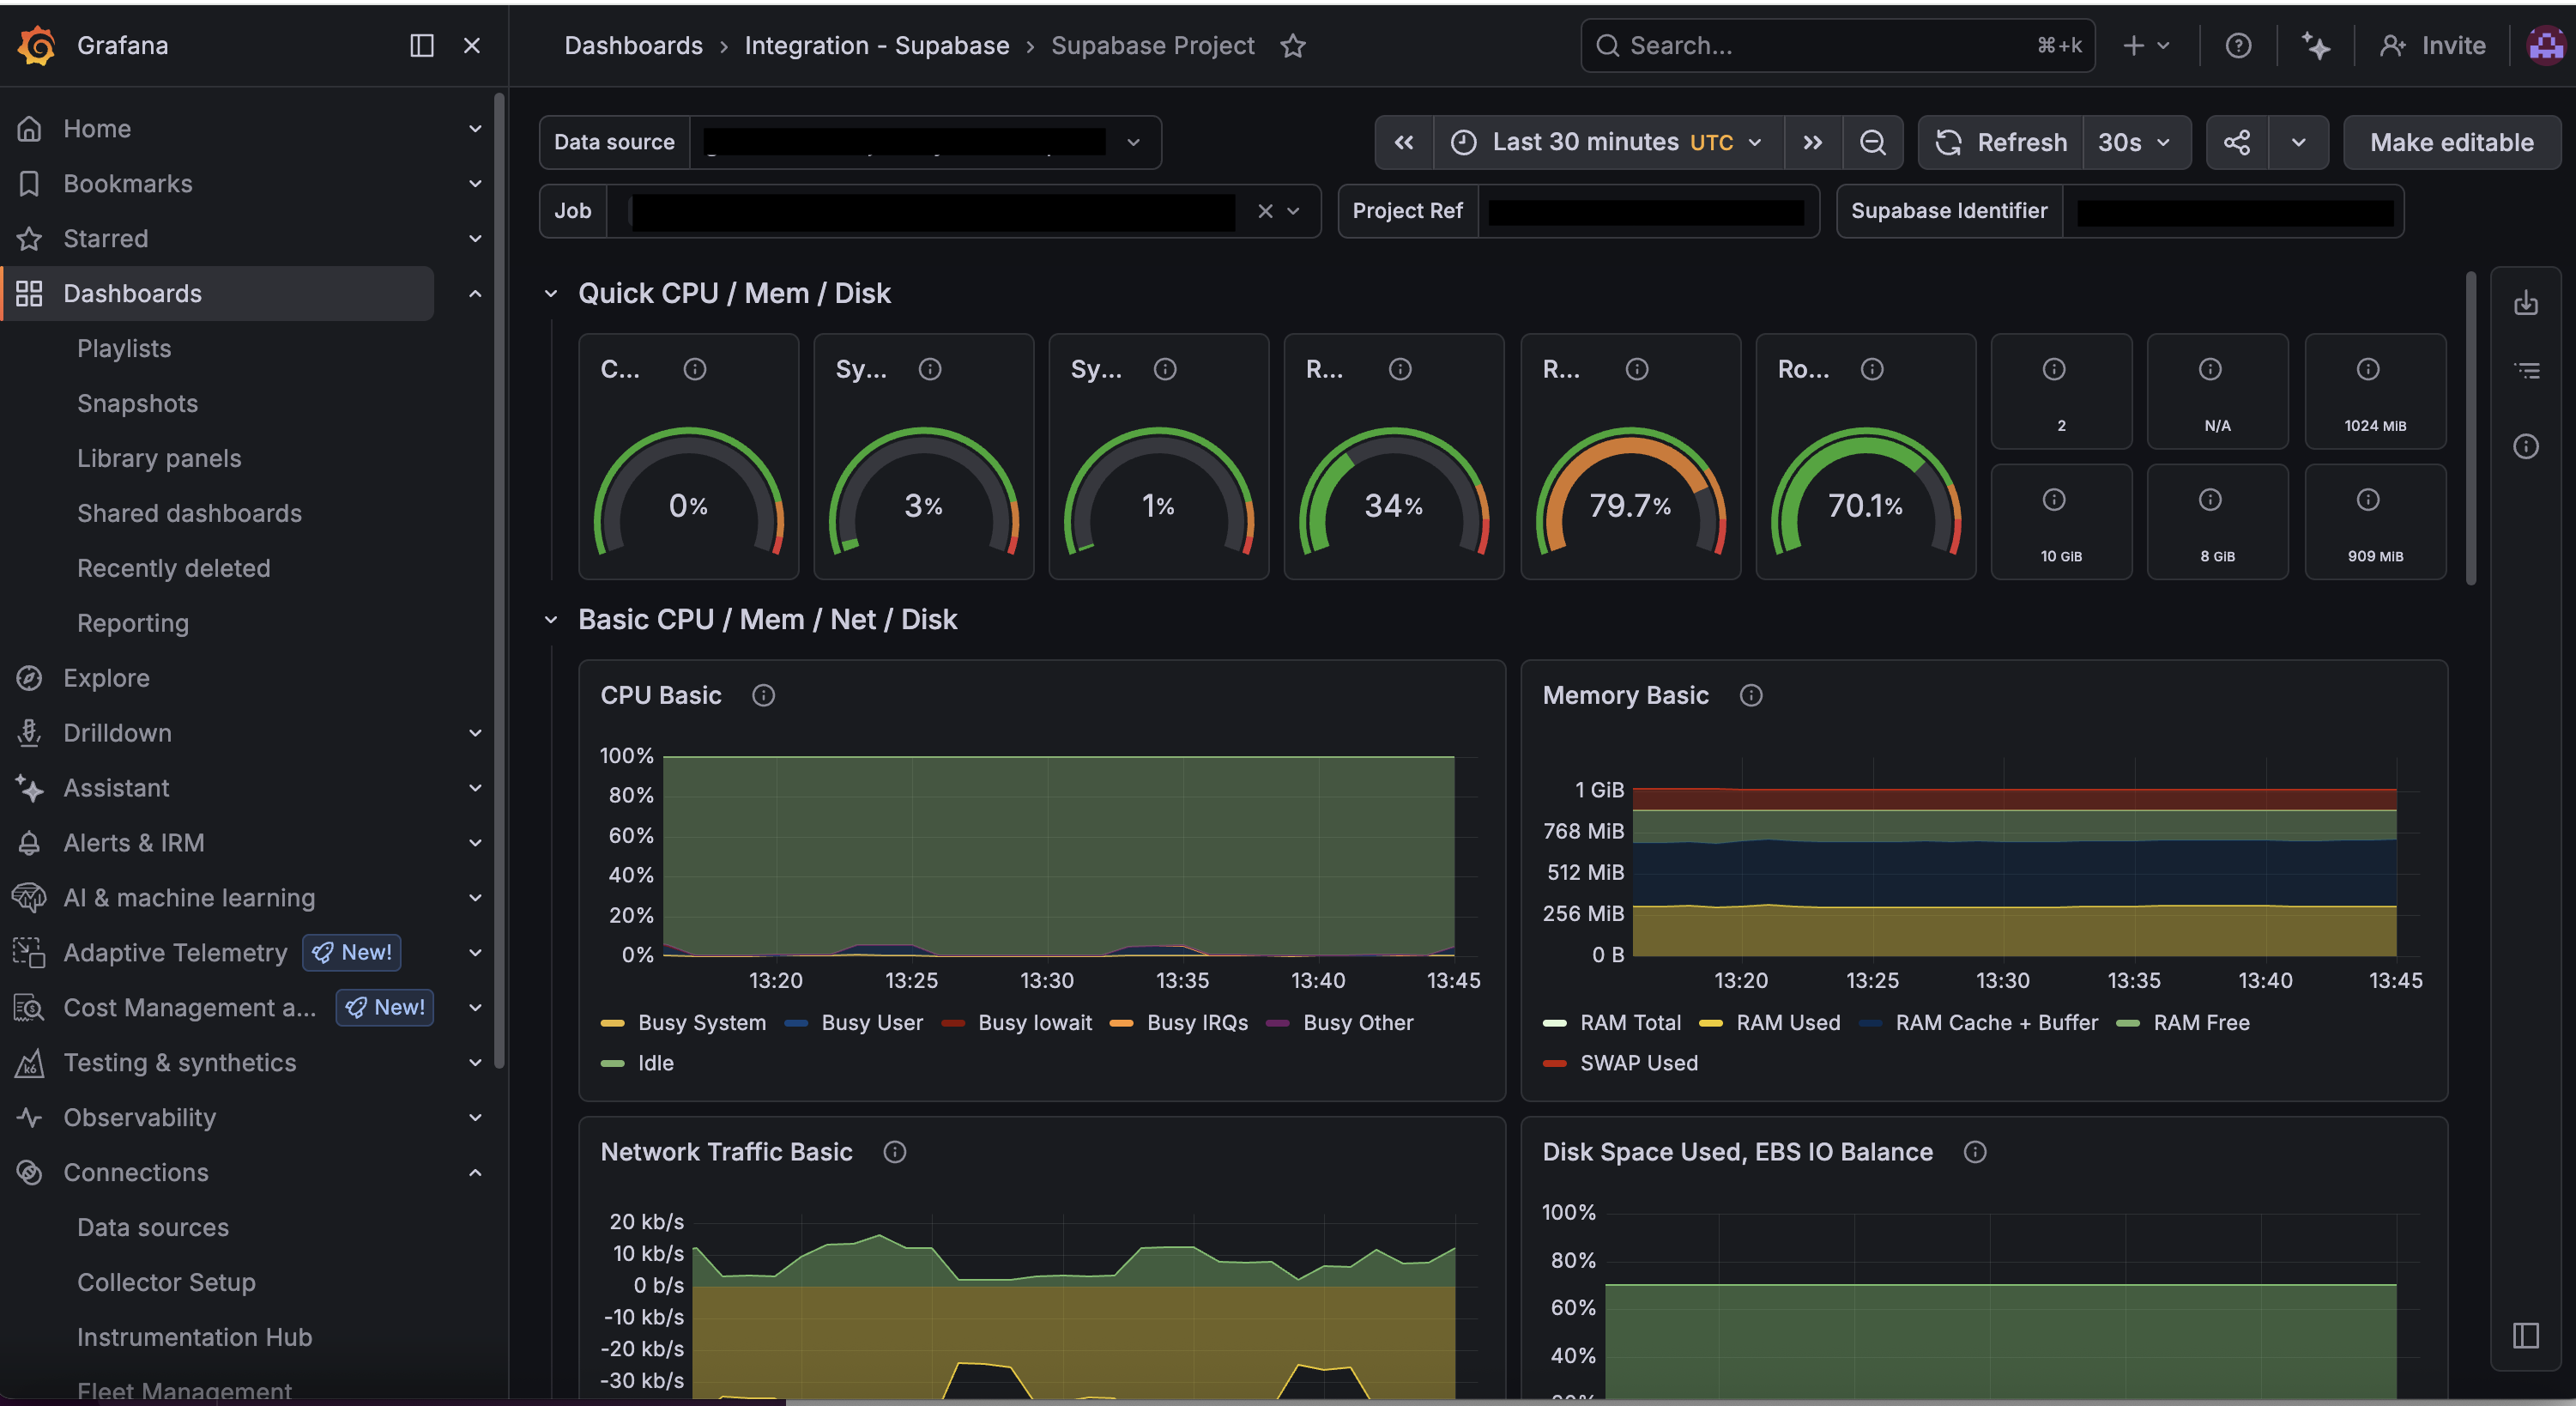
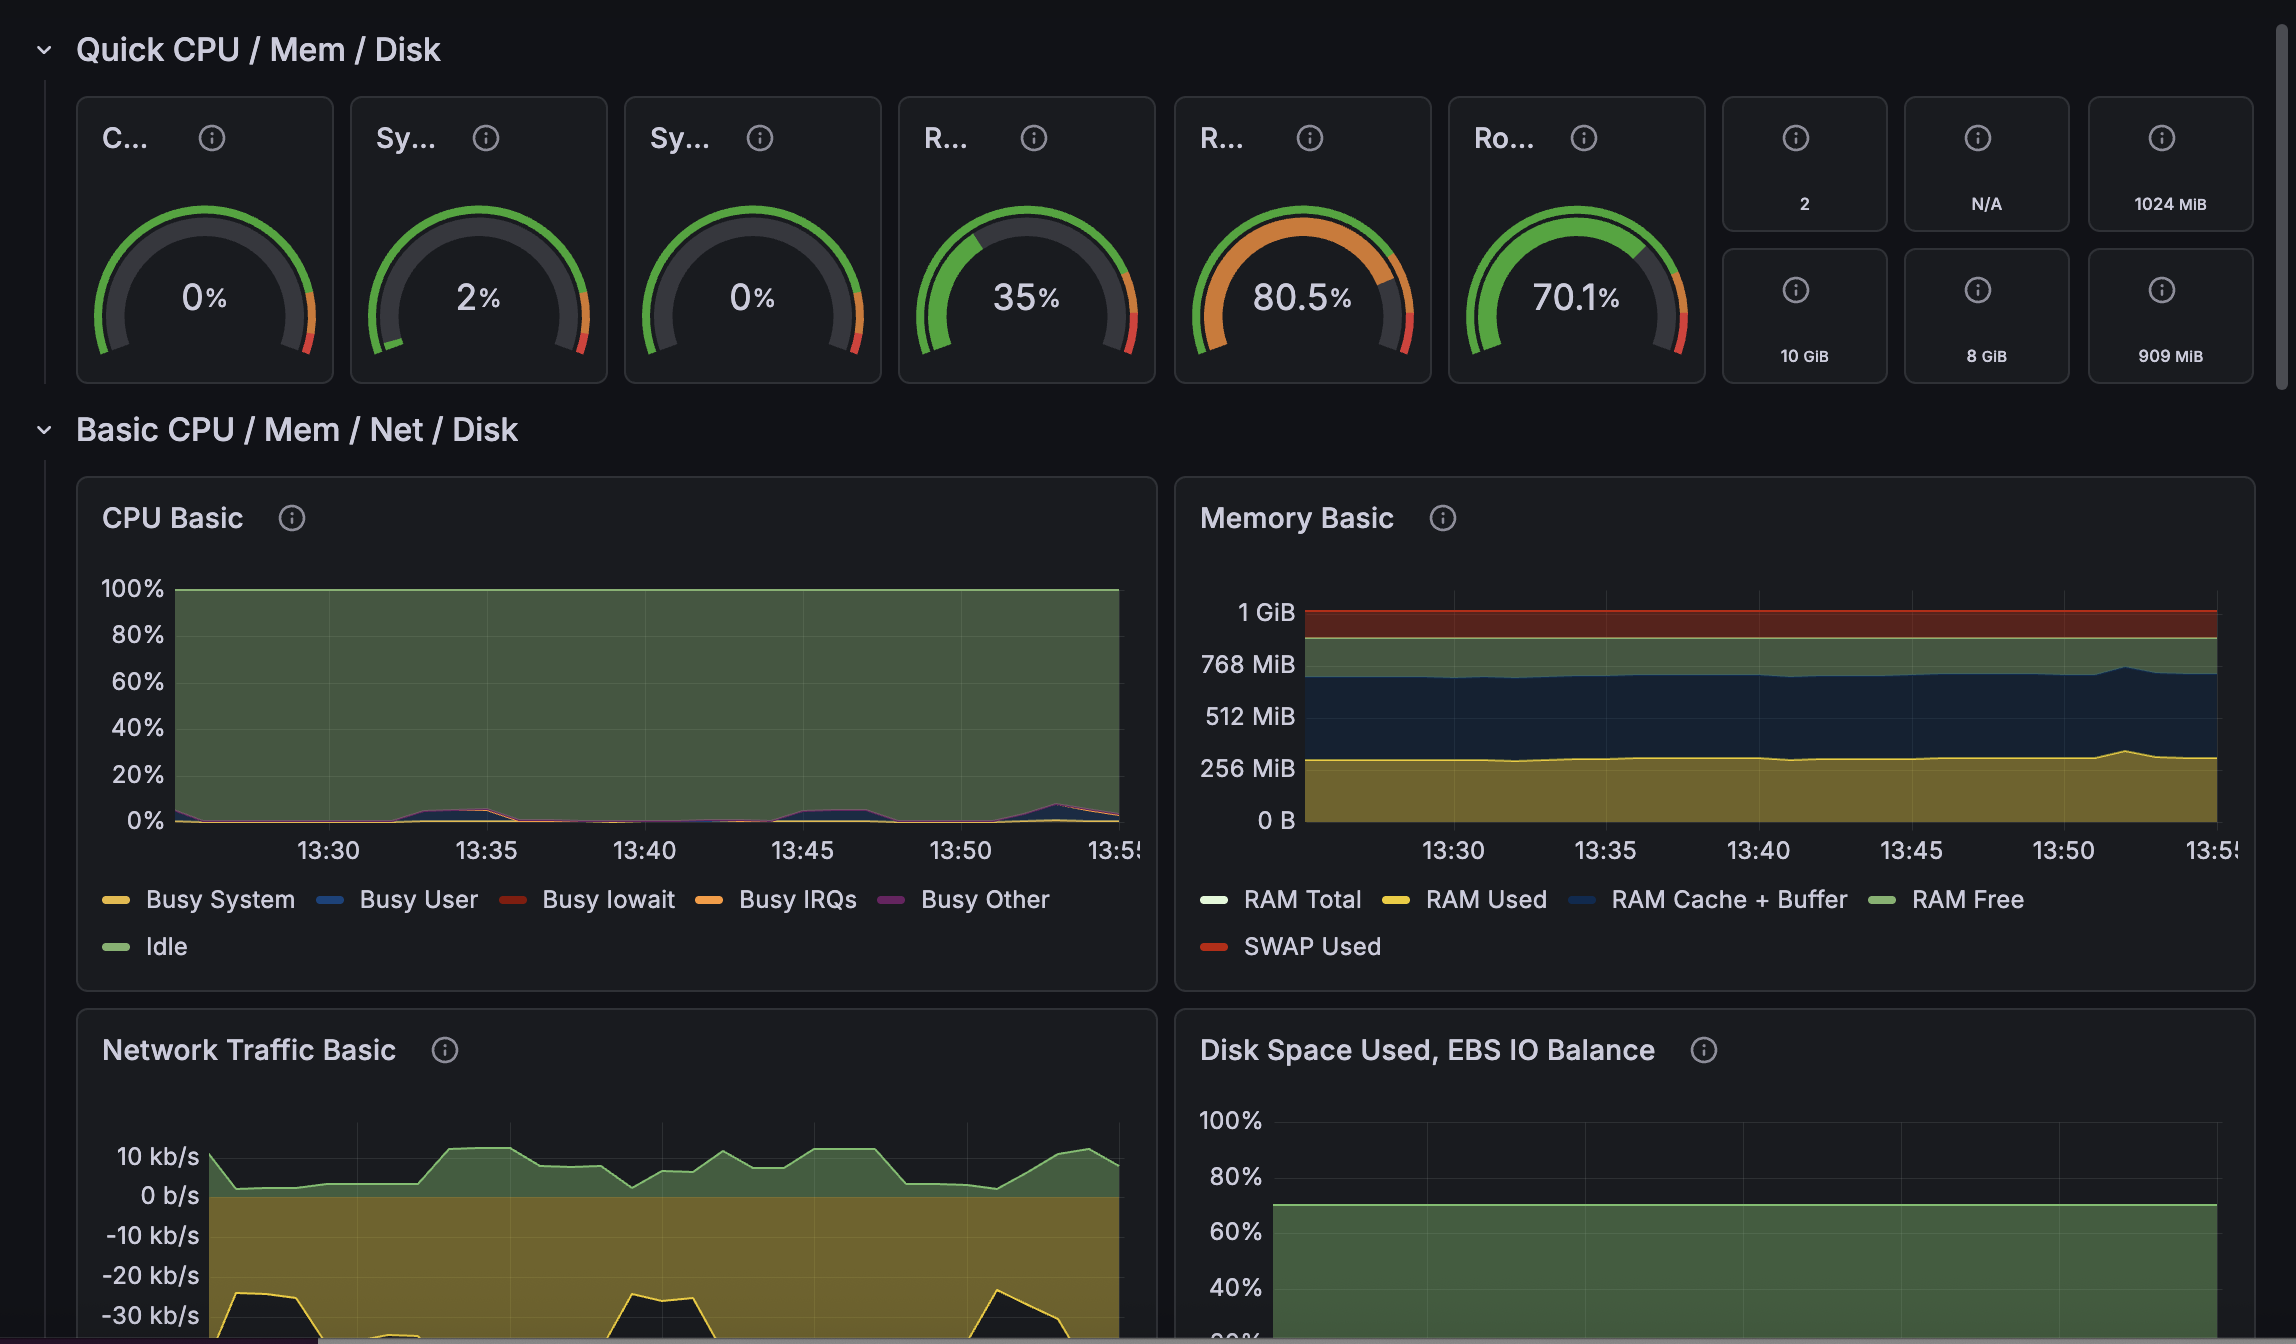
- Instantly access a pre-built dashboard with key Supabase and Postgres metrics so you can track performance, identify issues, and understand system health in real time.
- Skip the setup and maintenance overhead. There are no agents to install or configurations to manage, so your dashboard and metrics are ready from day one.
As your usage grows, Supabase and Grafana Cloud scale with you, giving you the same reliable observability from first deploy to production.
Grafana Cloud’s forever-free tier includes 3 users and up to 10k metrics series so you can get started with monitoring at no cost.