Visualization and monitoring integrations
Visualization and monitoring integrations
/
Monitor AerospikeMonitor Aerospike easily with Grafana
Easily monitor your deployment of Aerospike, a multi-modal NoSQL and graph database, with Grafana Cloud’s out-of-the-box monitoring solution. The Grafana Cloud forever-free tier includes 3 users and up to 10k metrics series to support your monitoring needs.
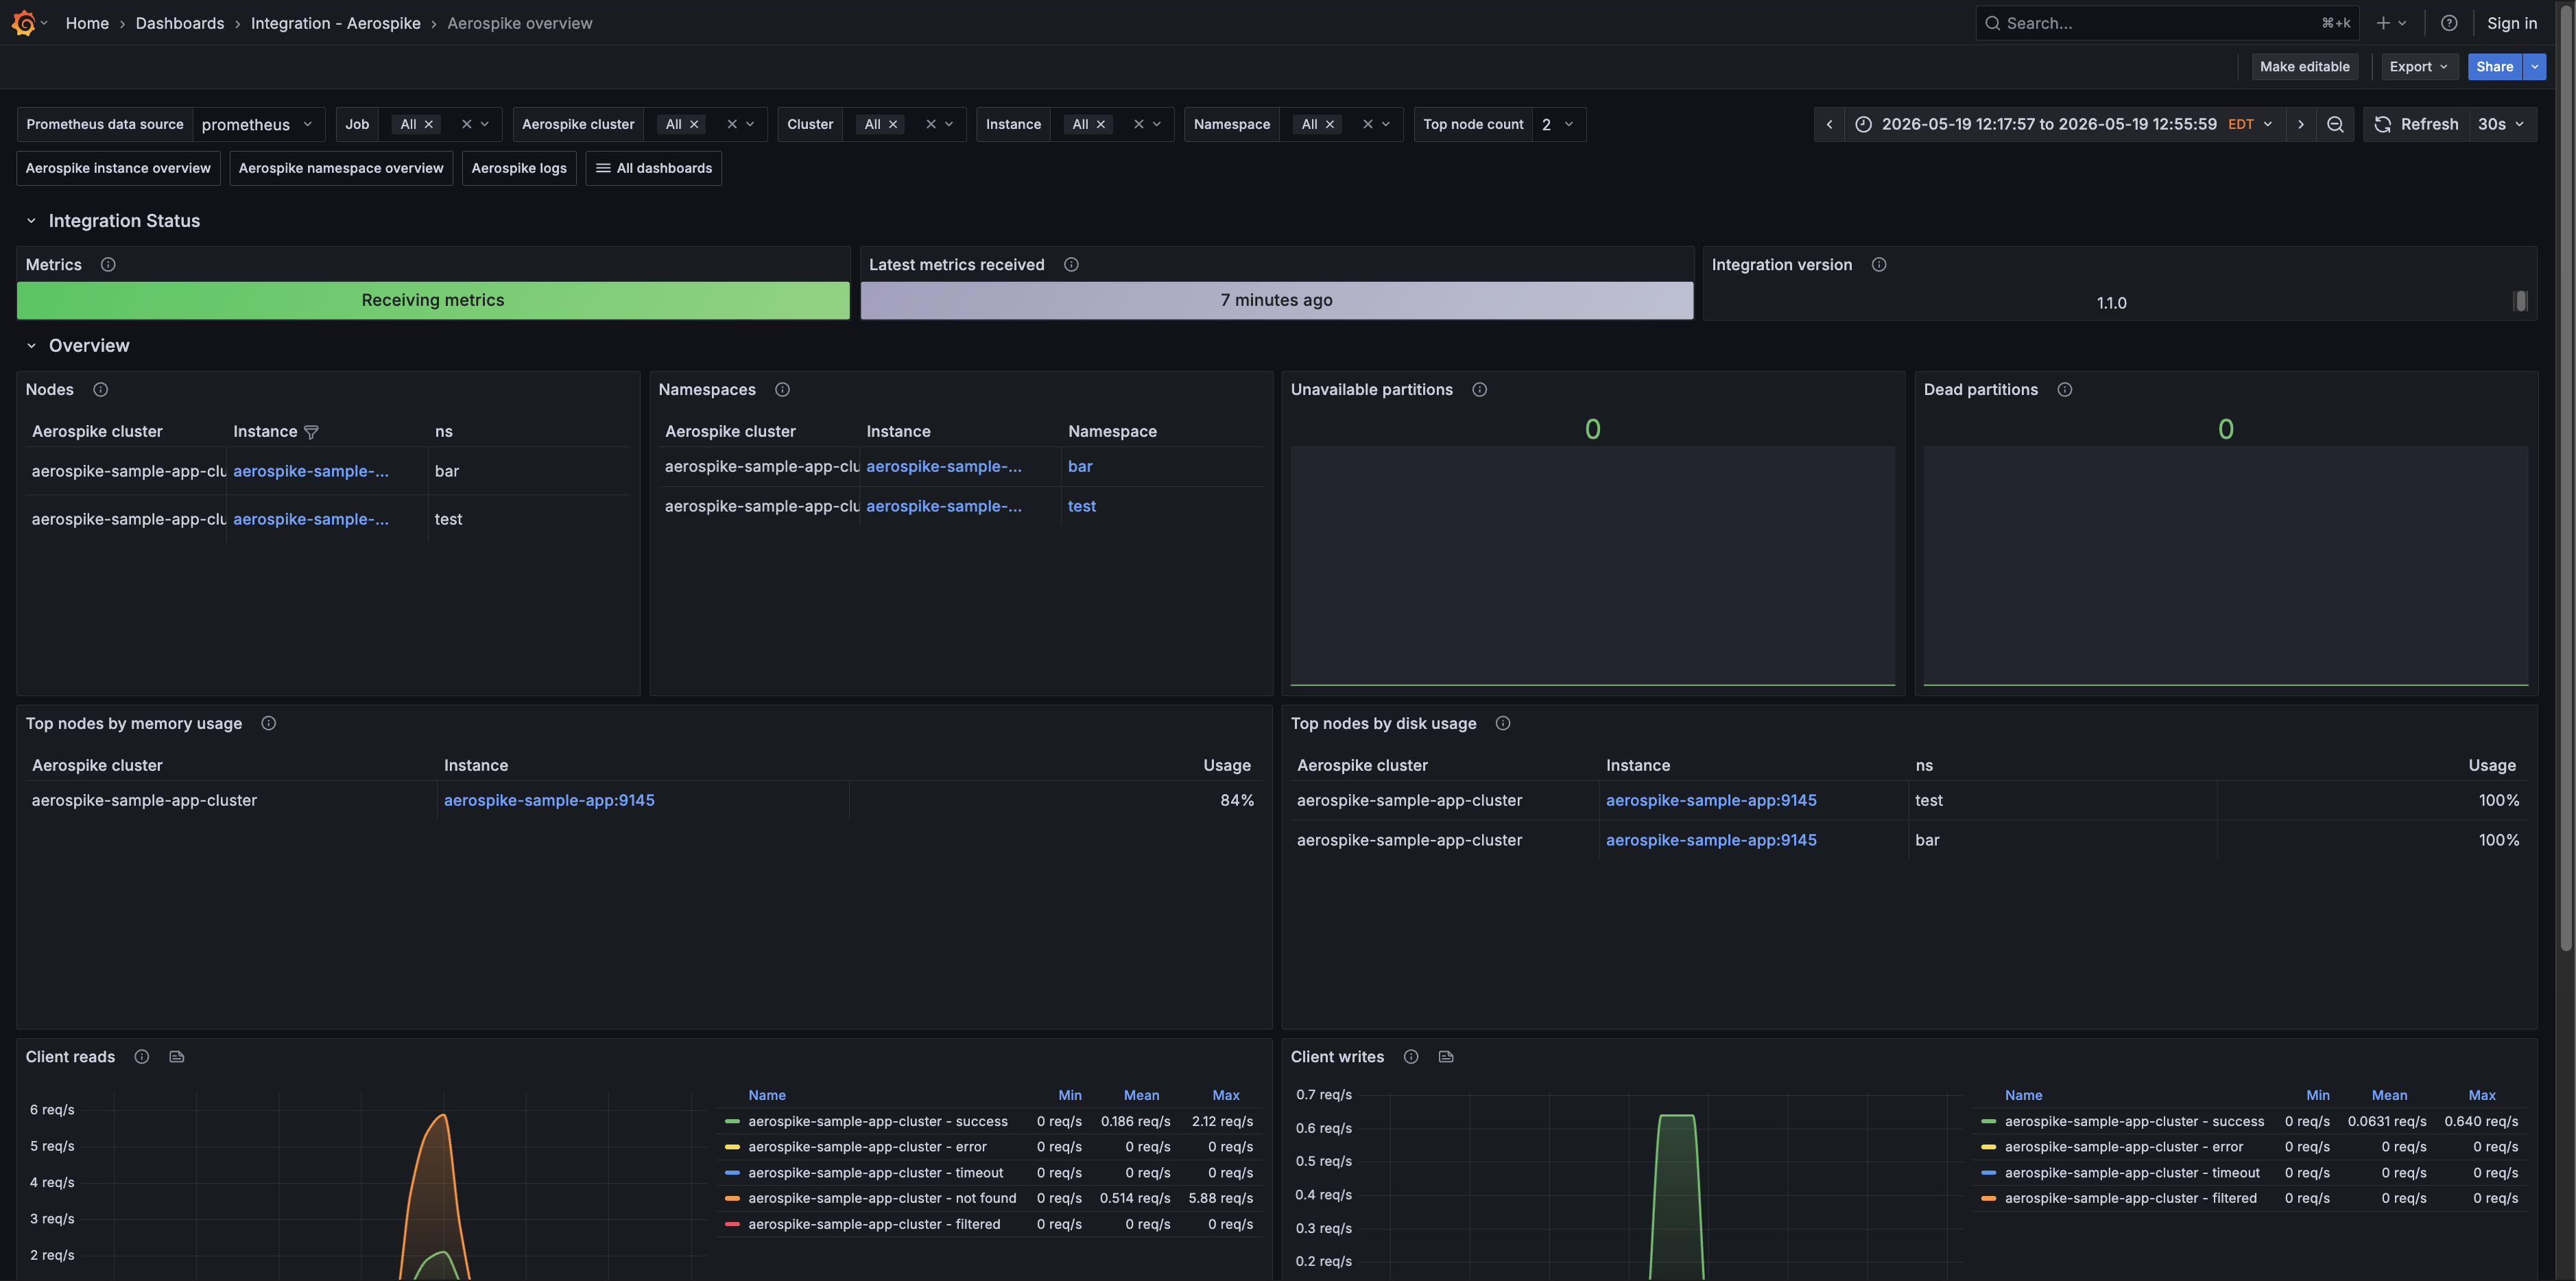
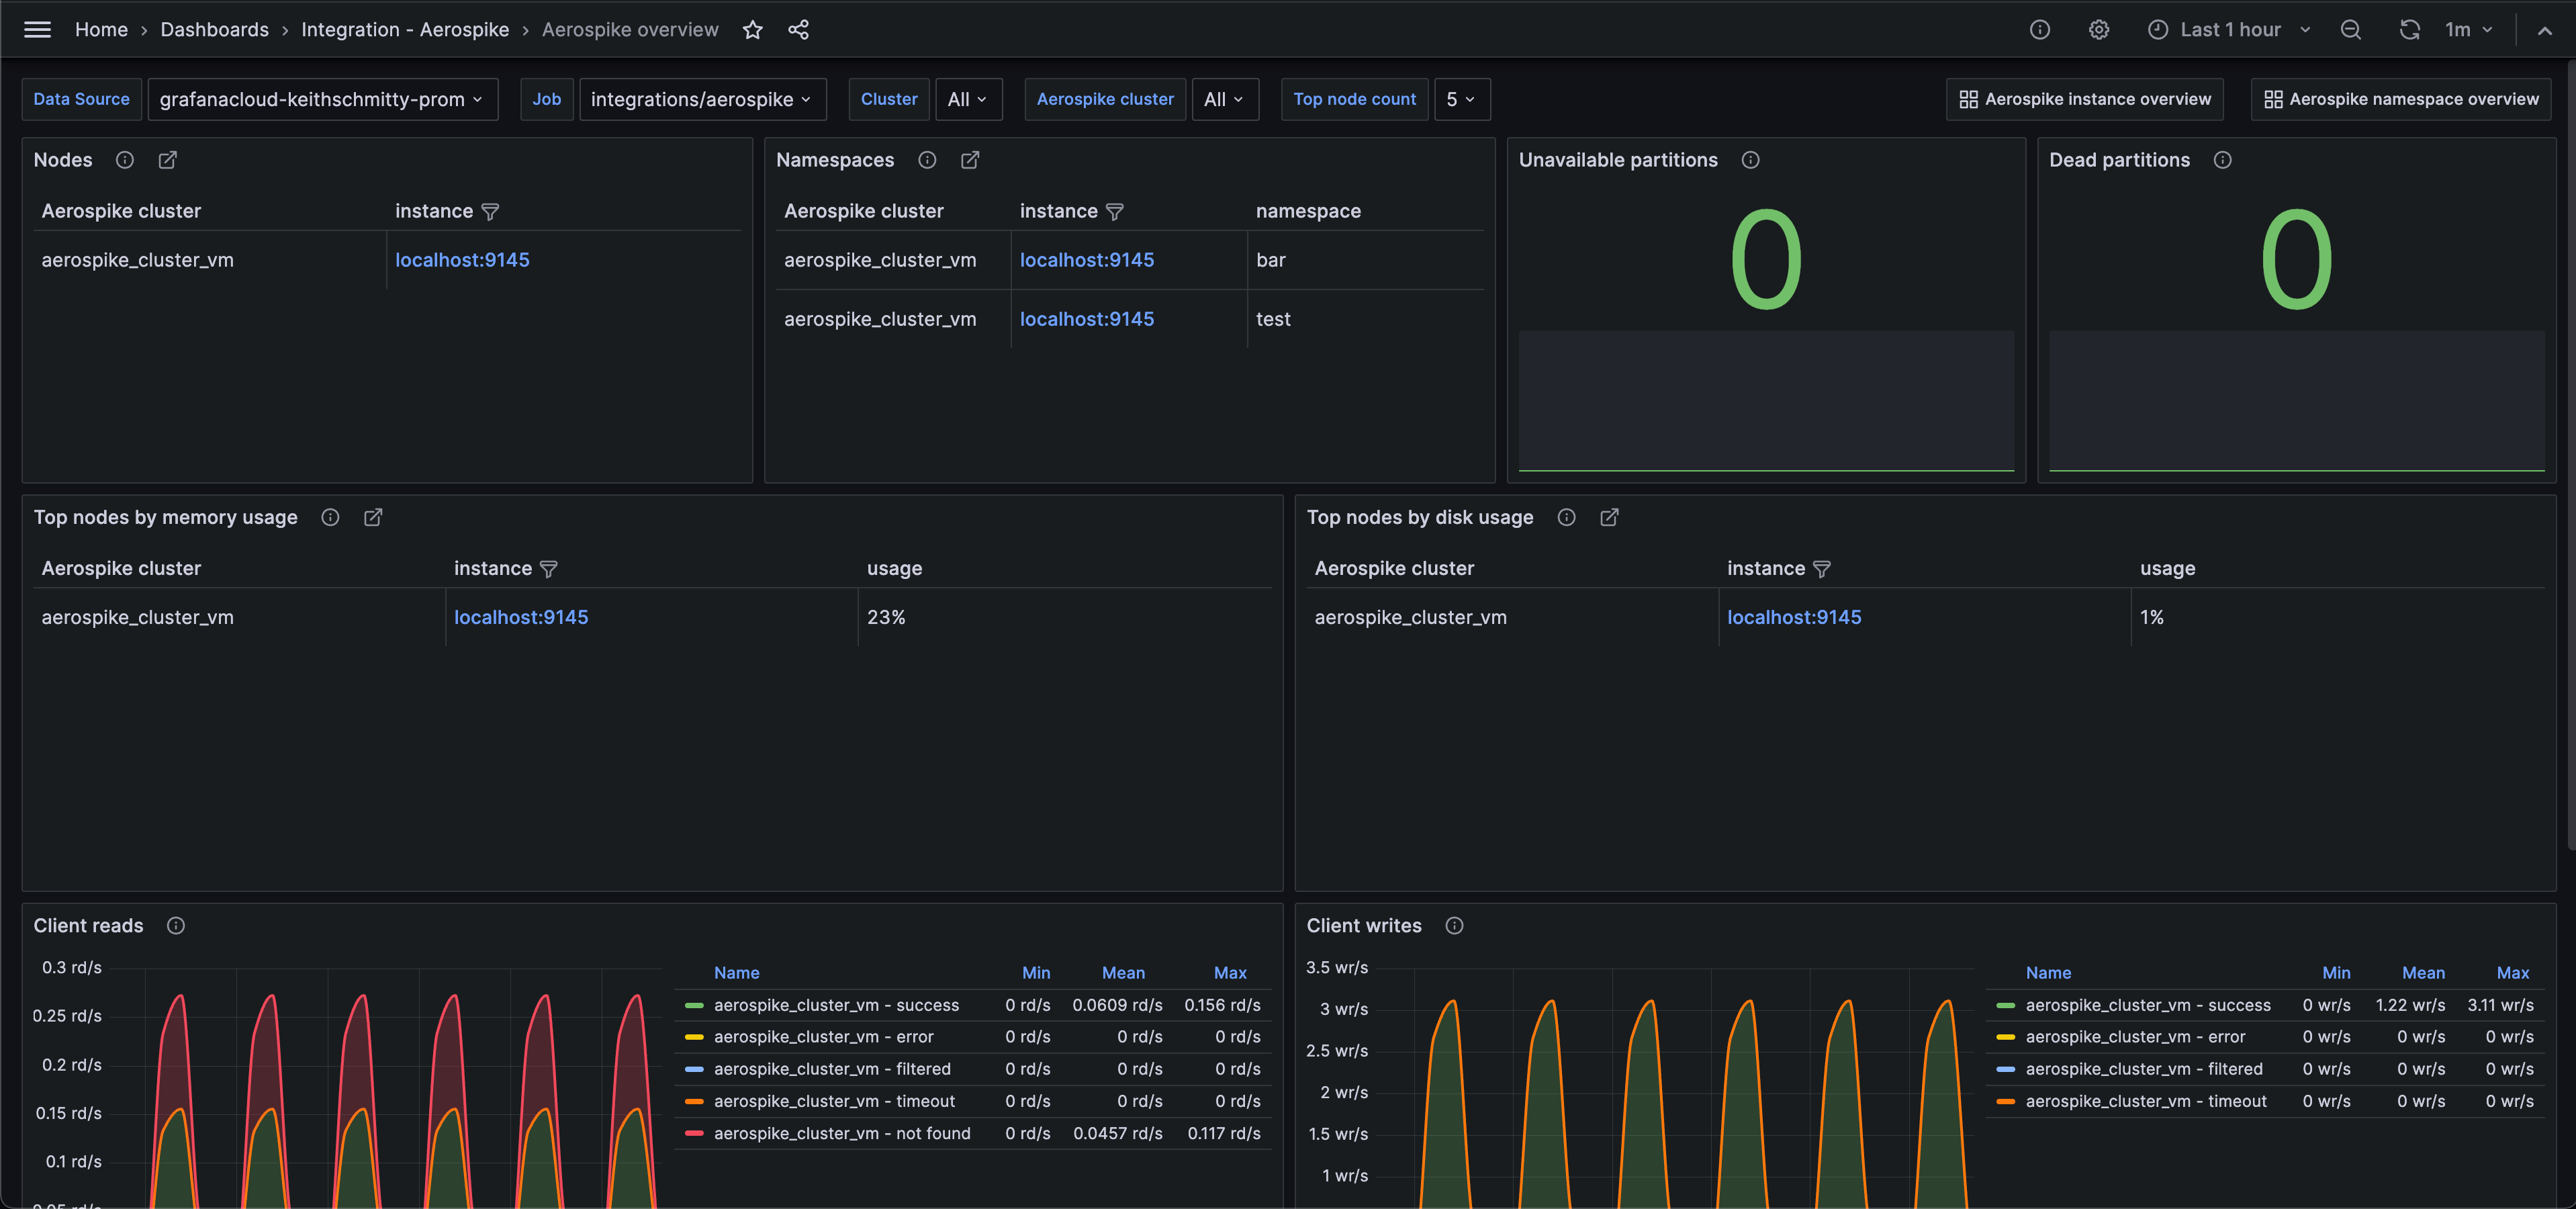
Aerospike overview (cluster overview)
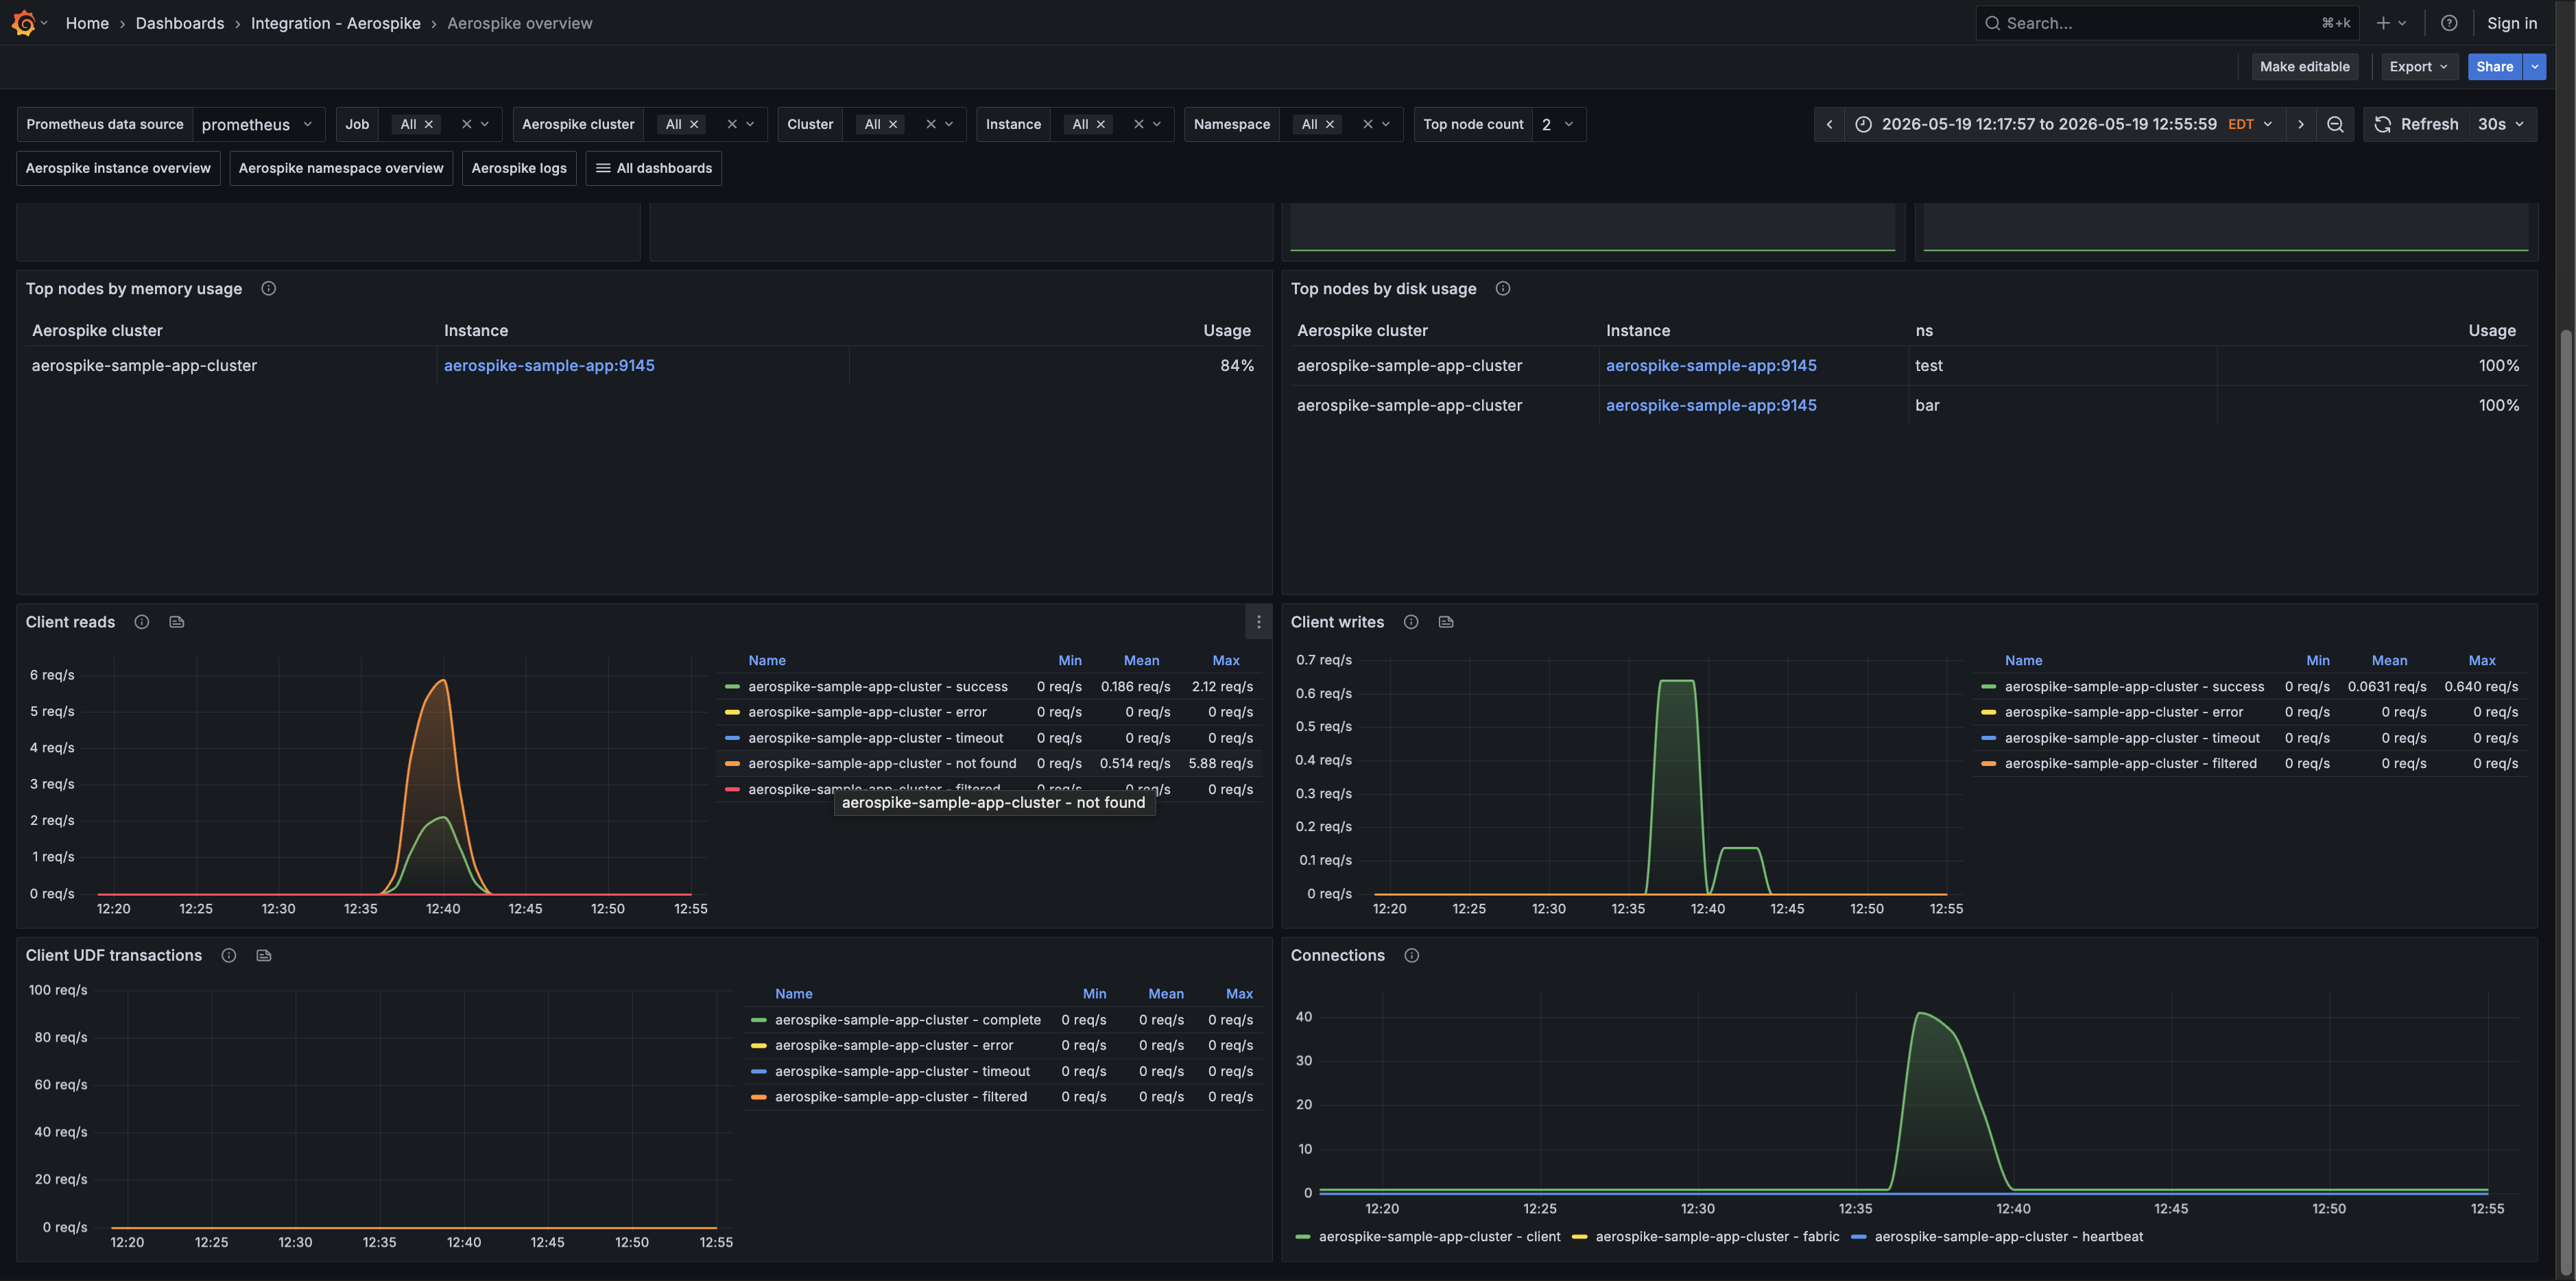
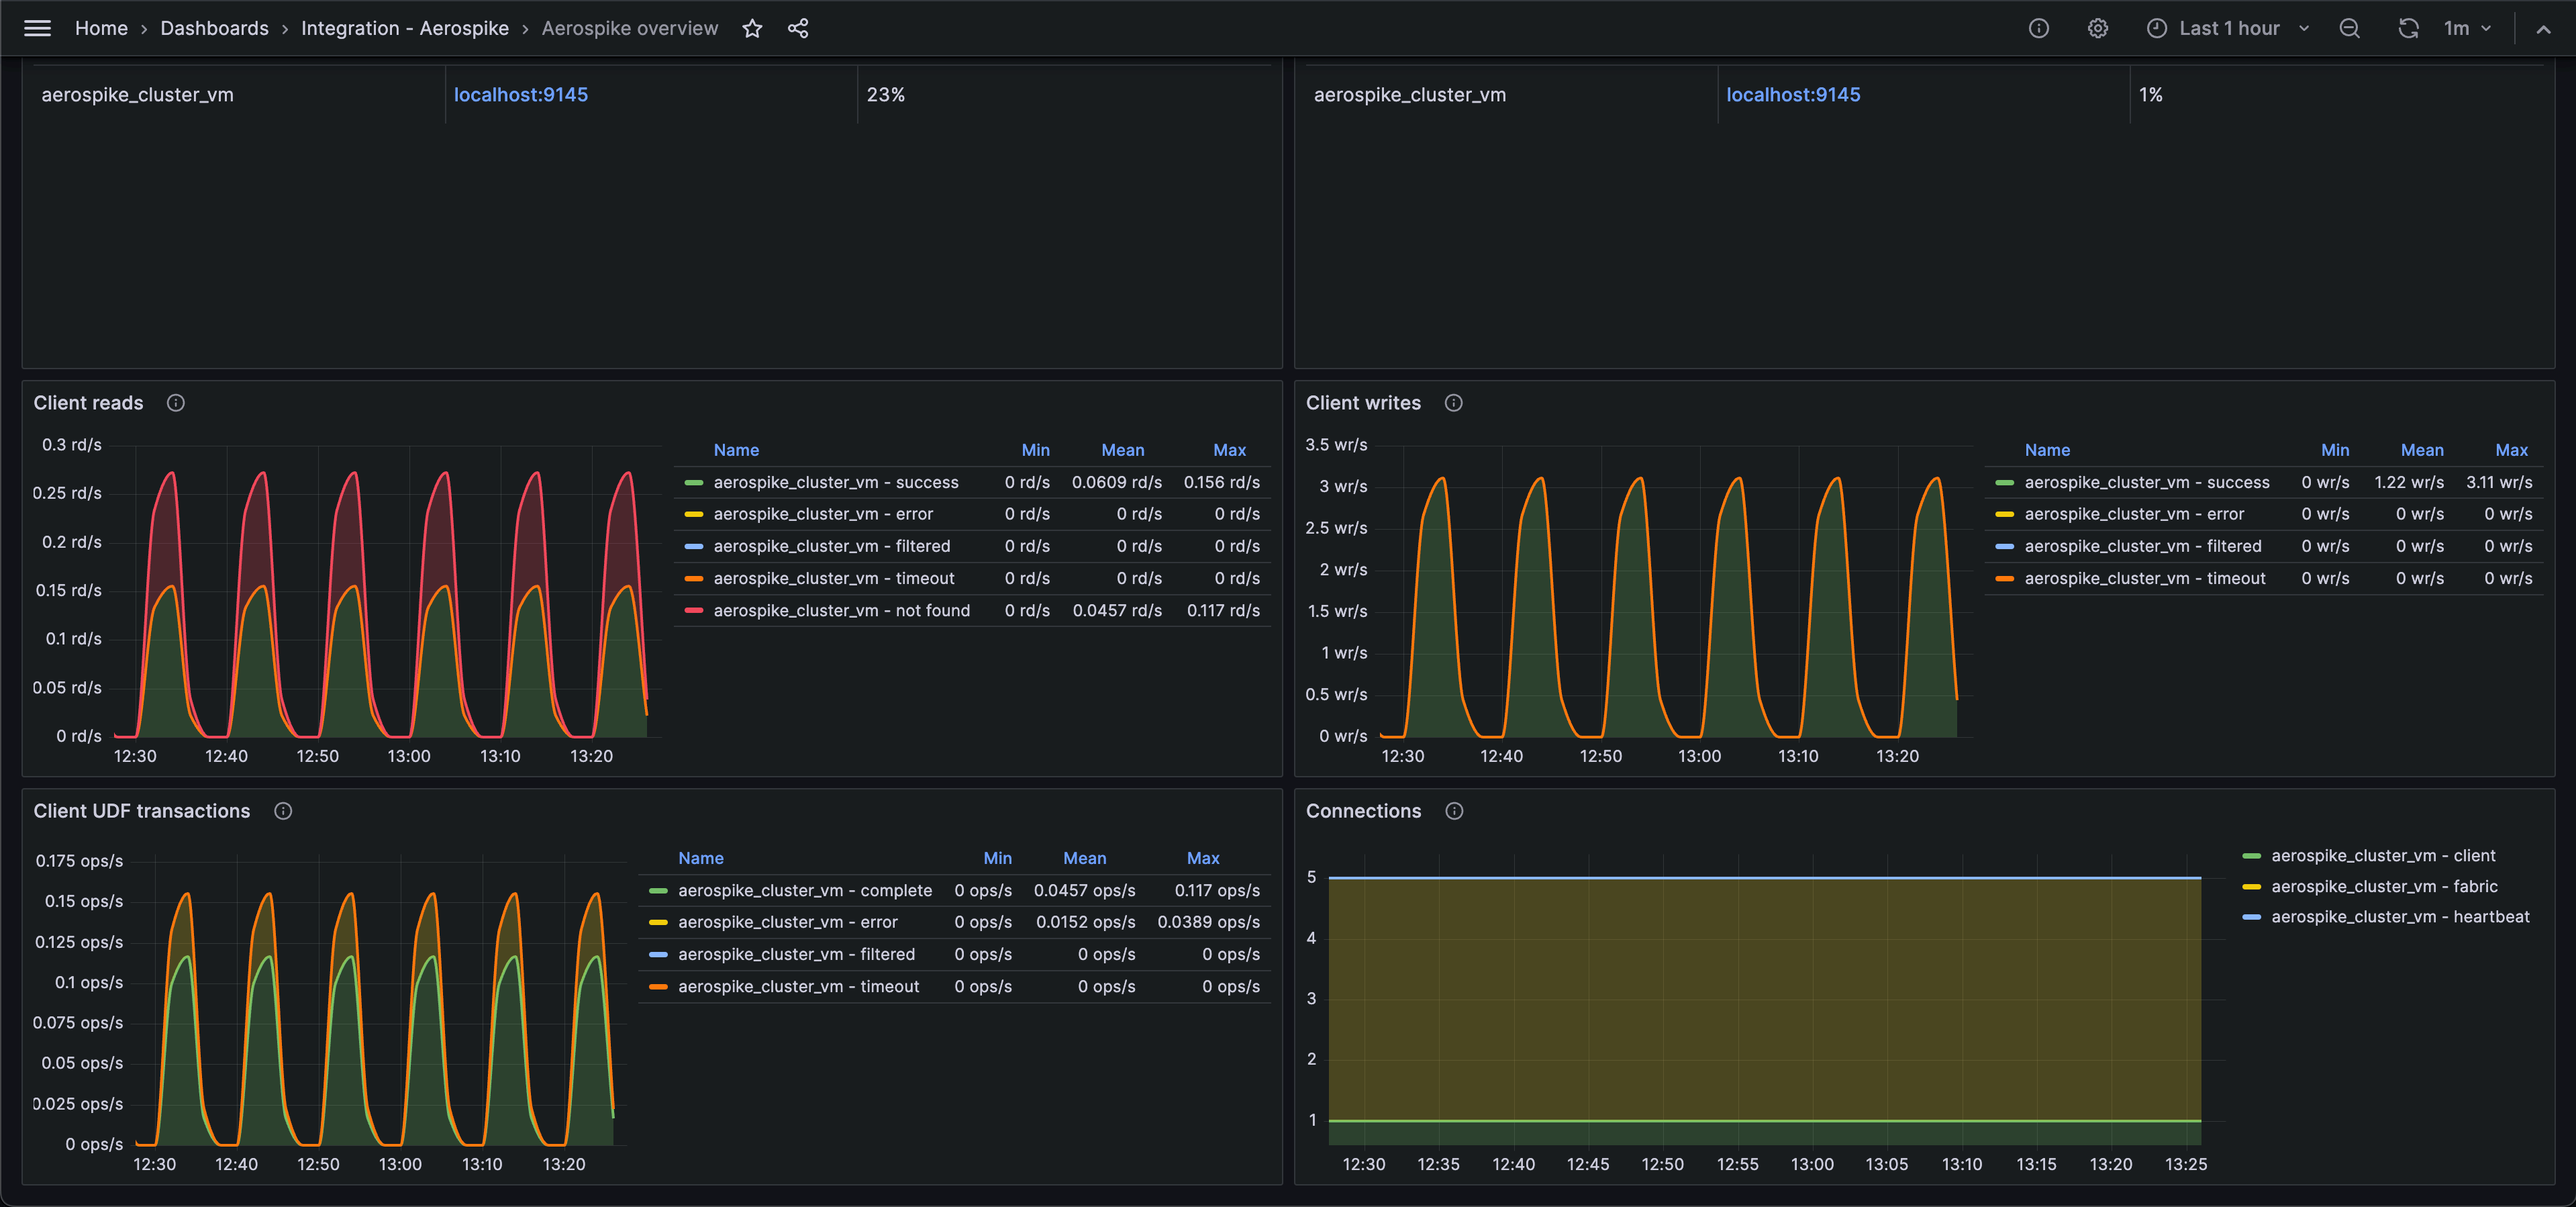
Aerospike overview (client requests)
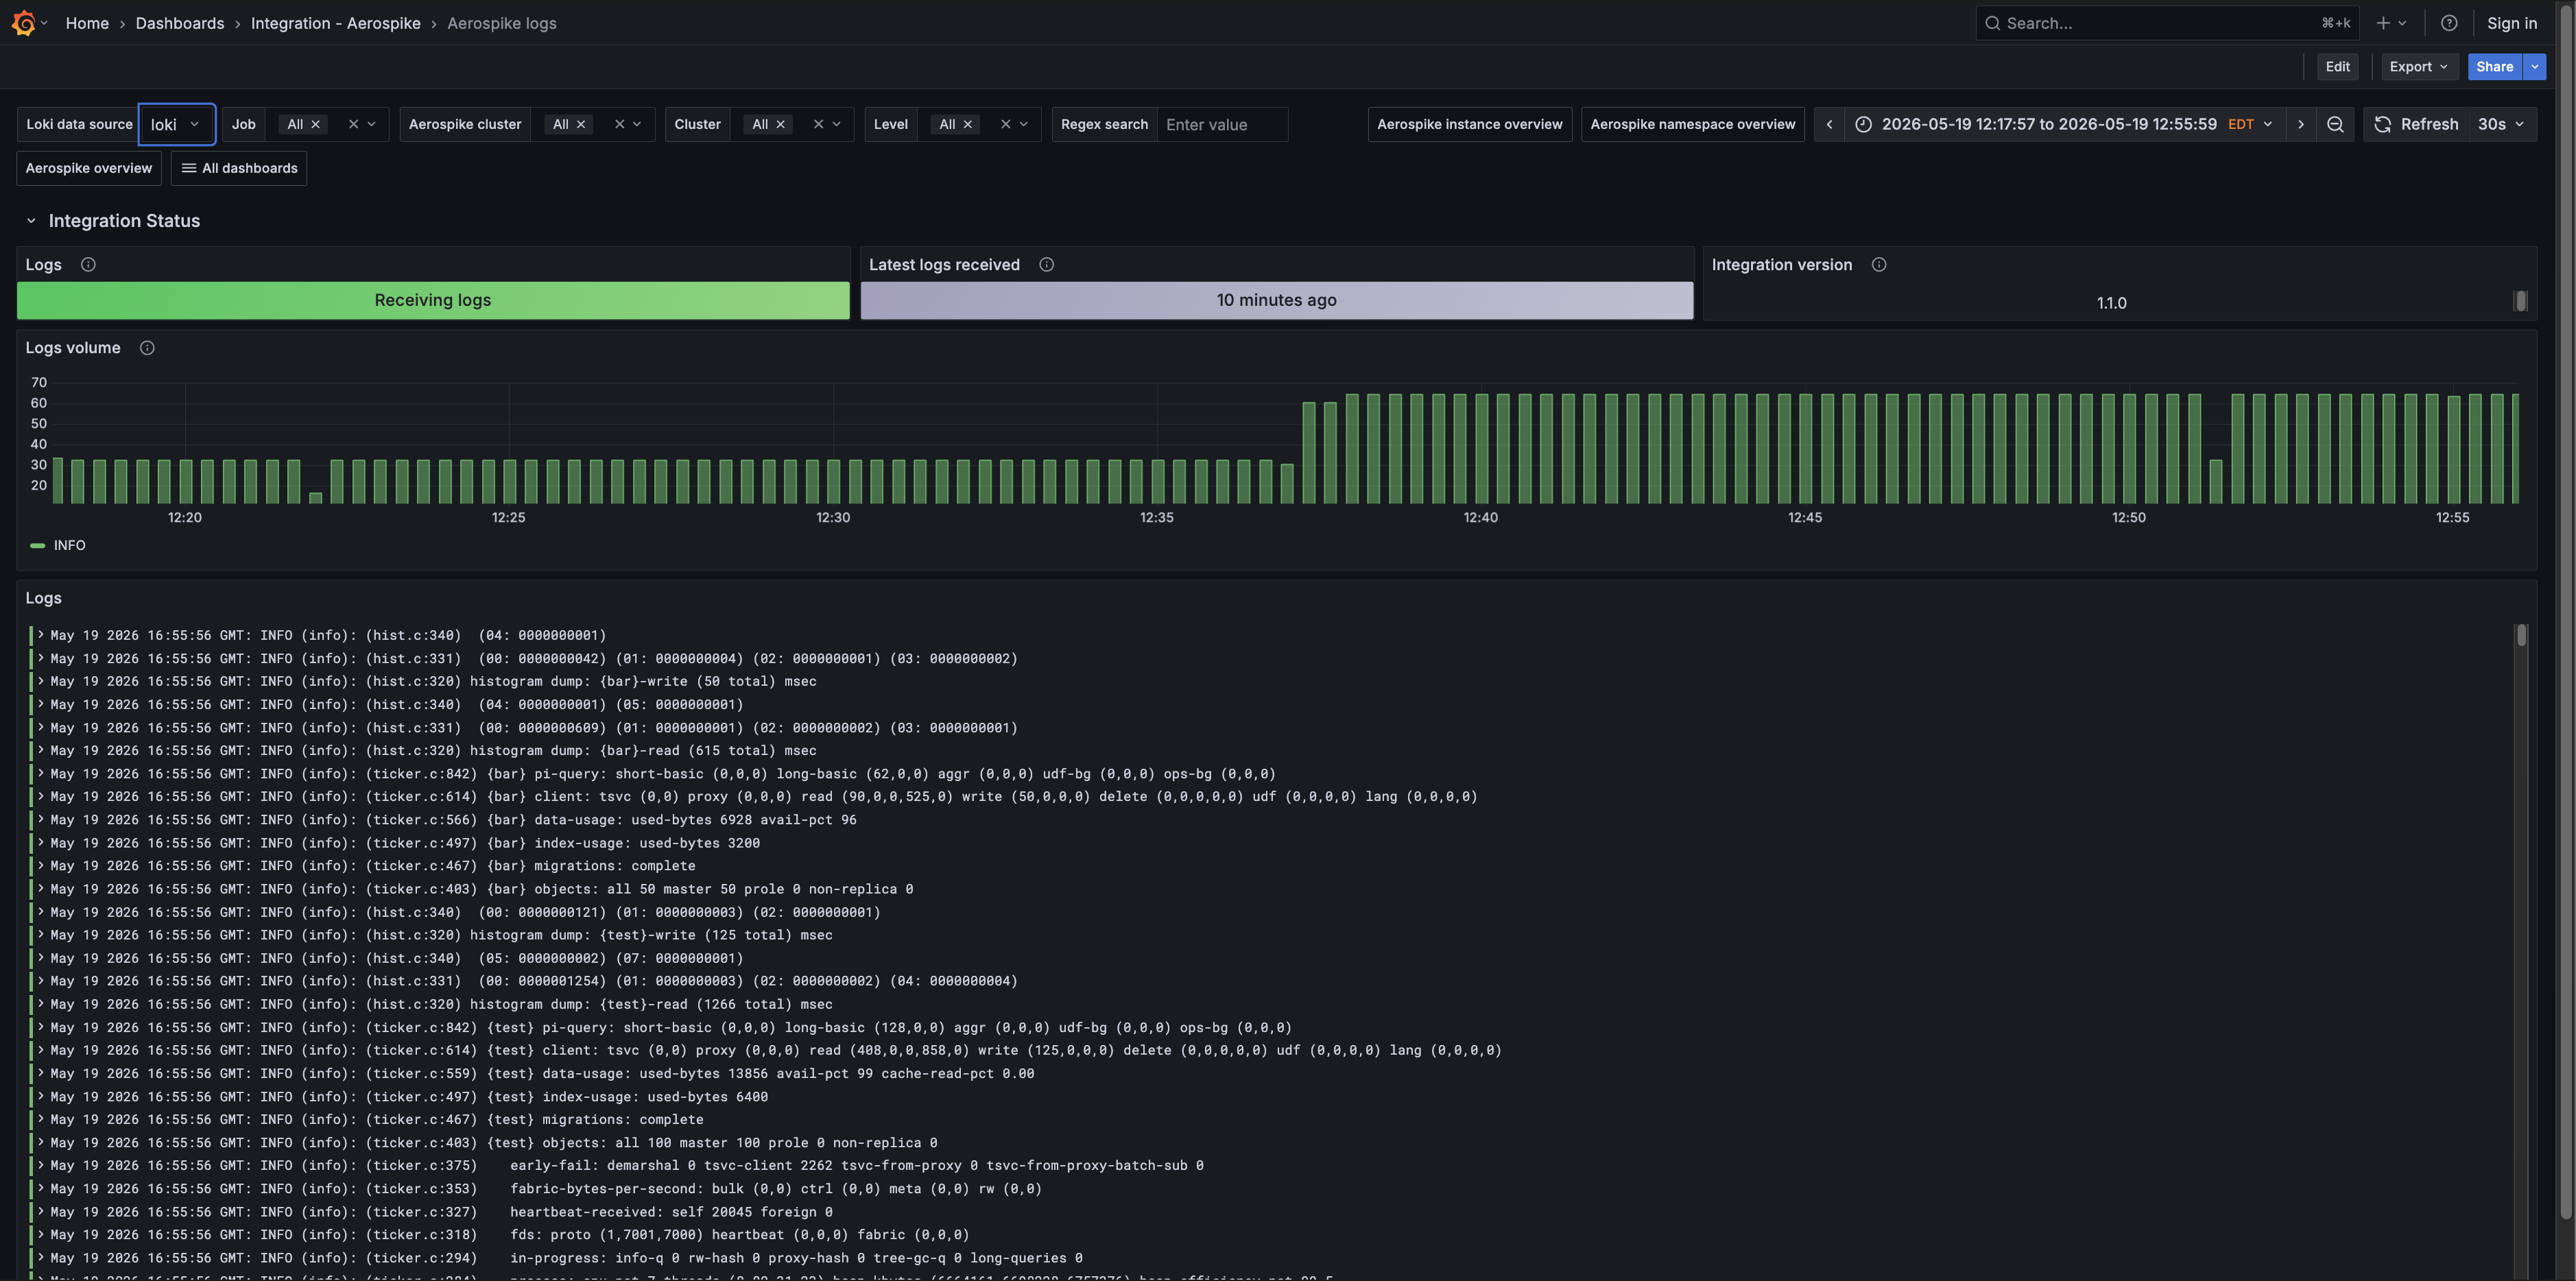
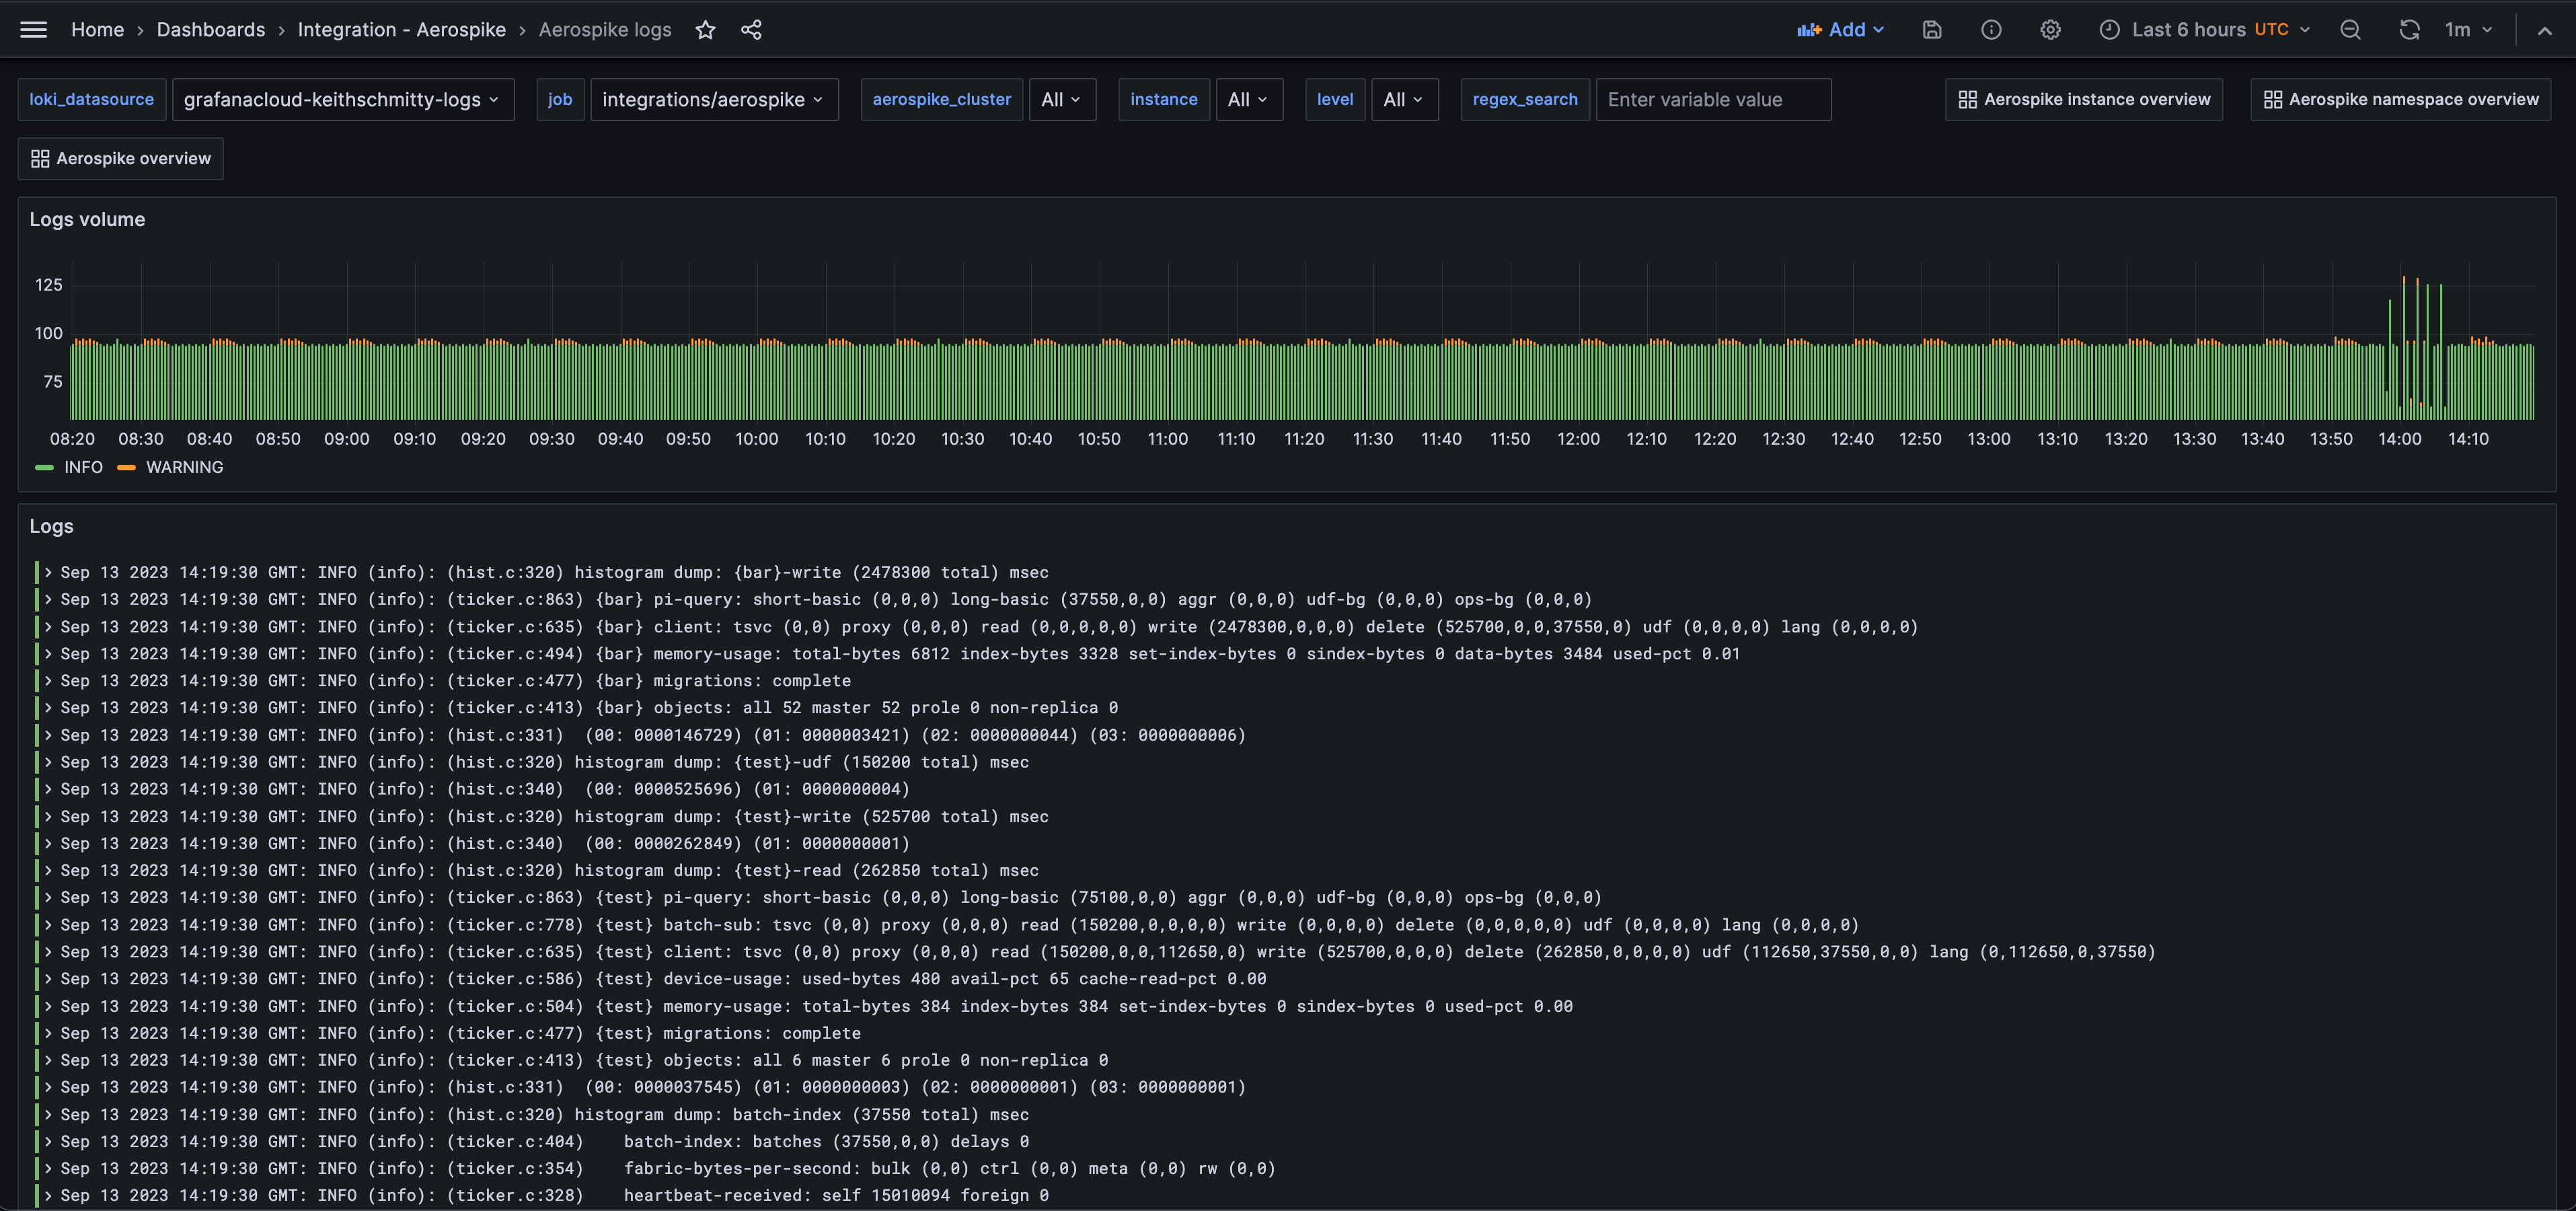
Aerospike logs (logs)
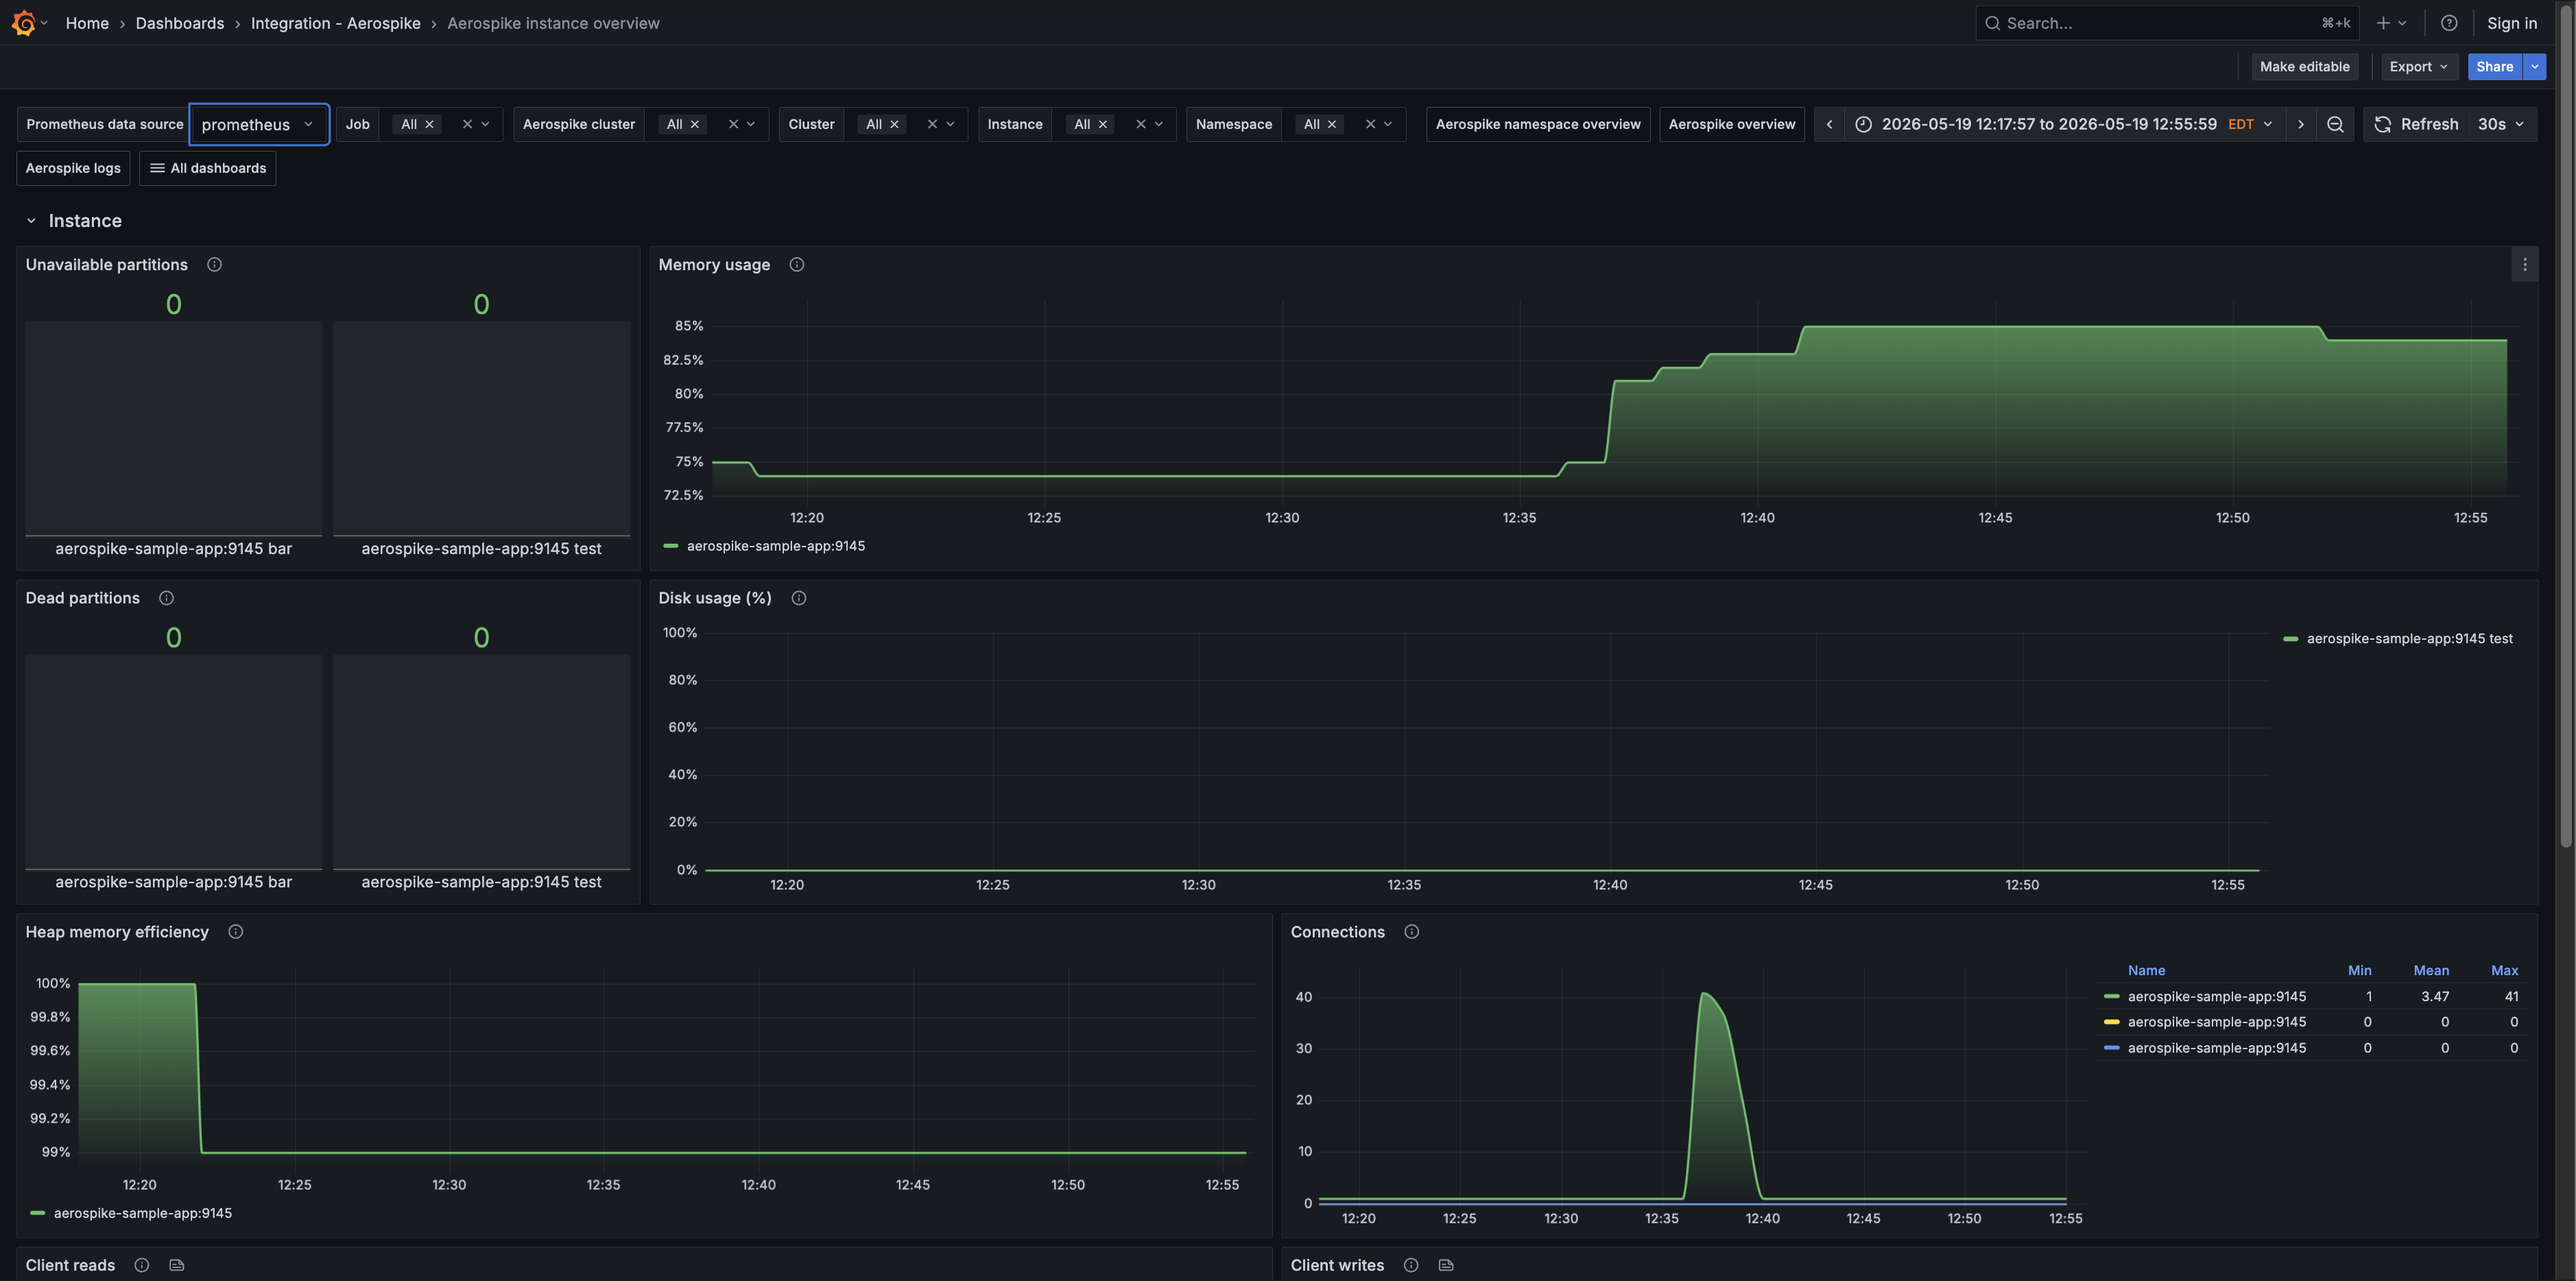
Aerospike instance overview (resource usage)
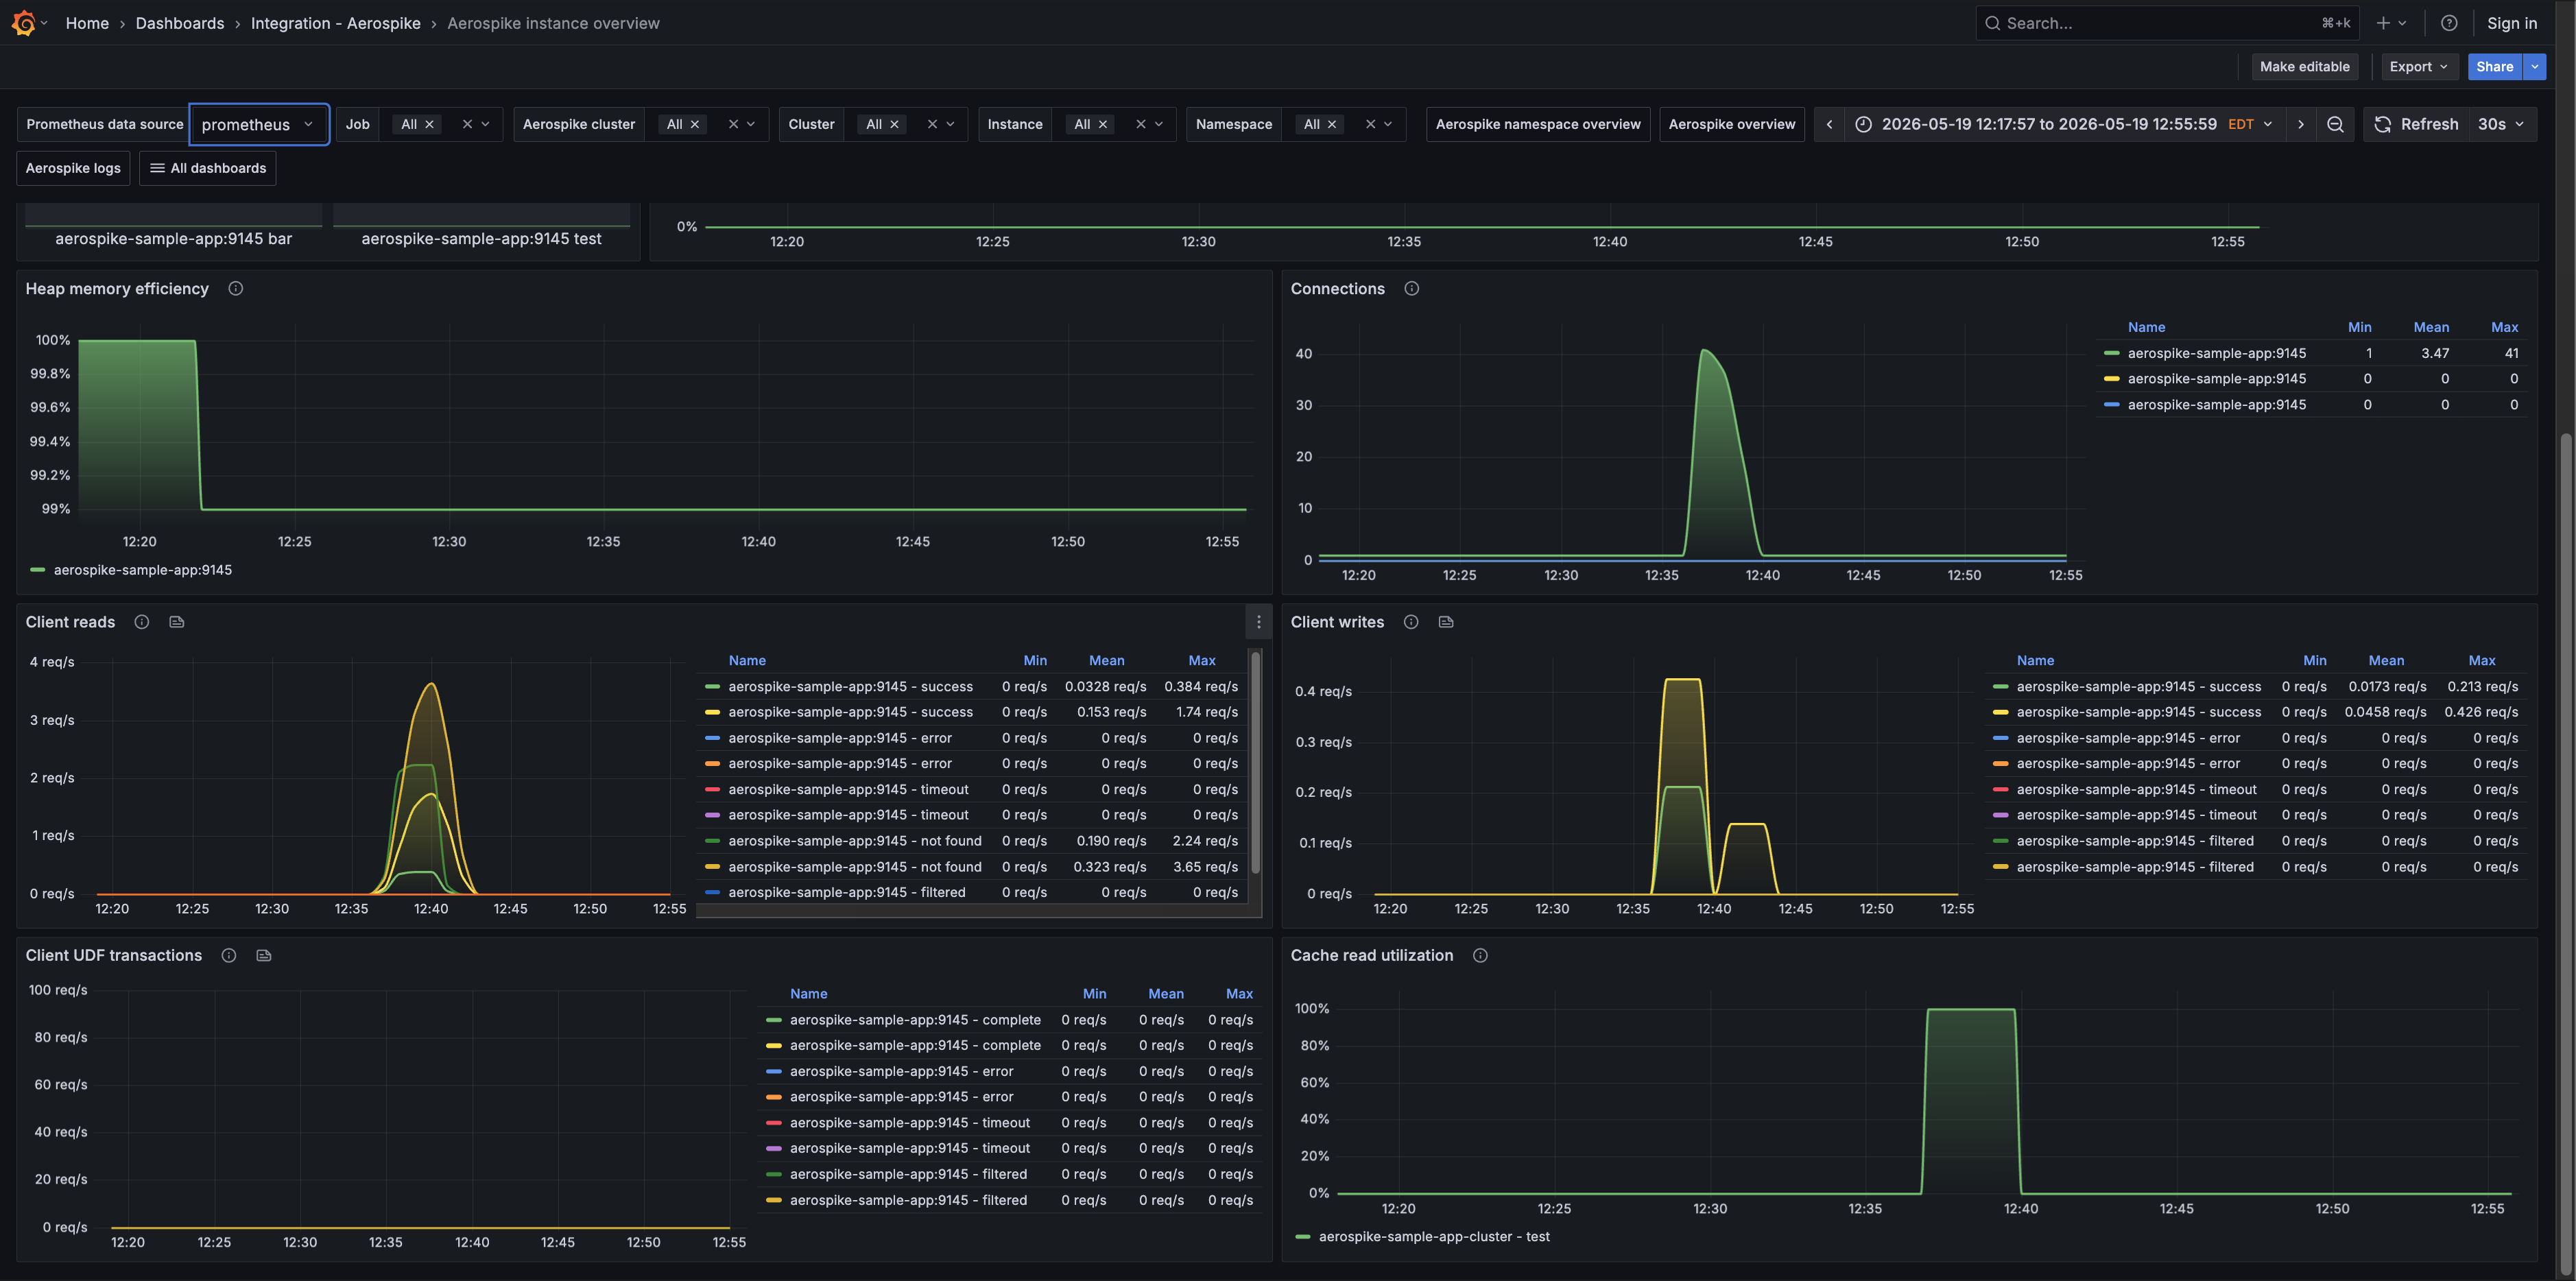
Aerospike instance overview (client requests)
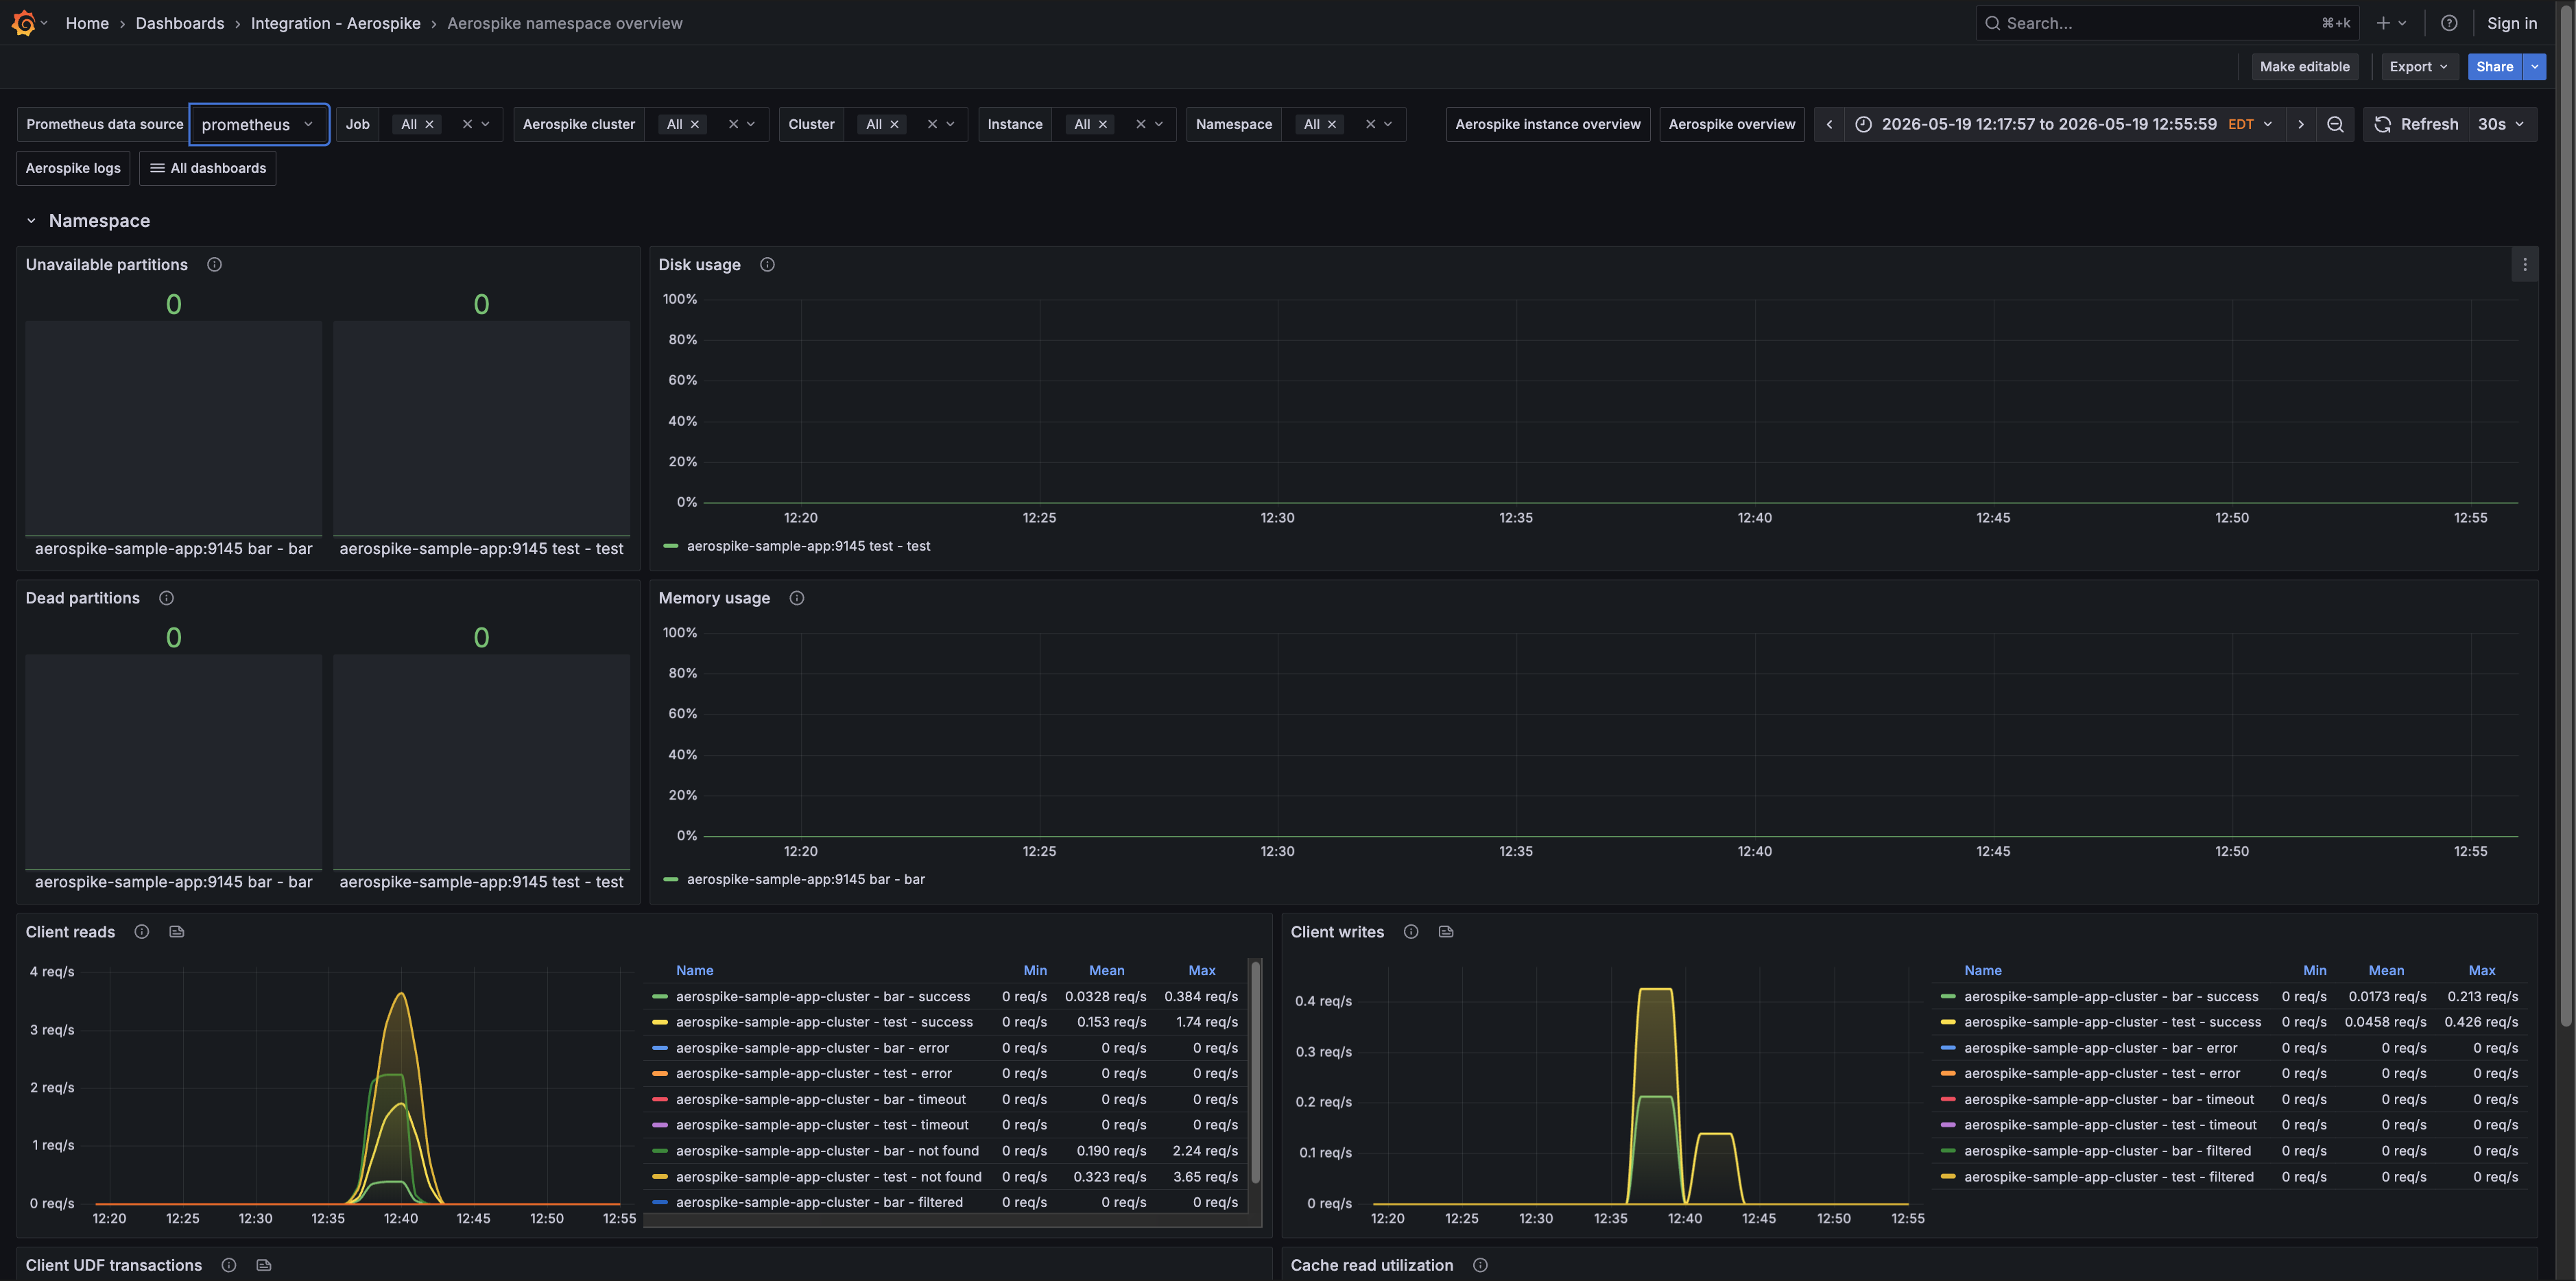
Aerospike namespace overview (resource usage)
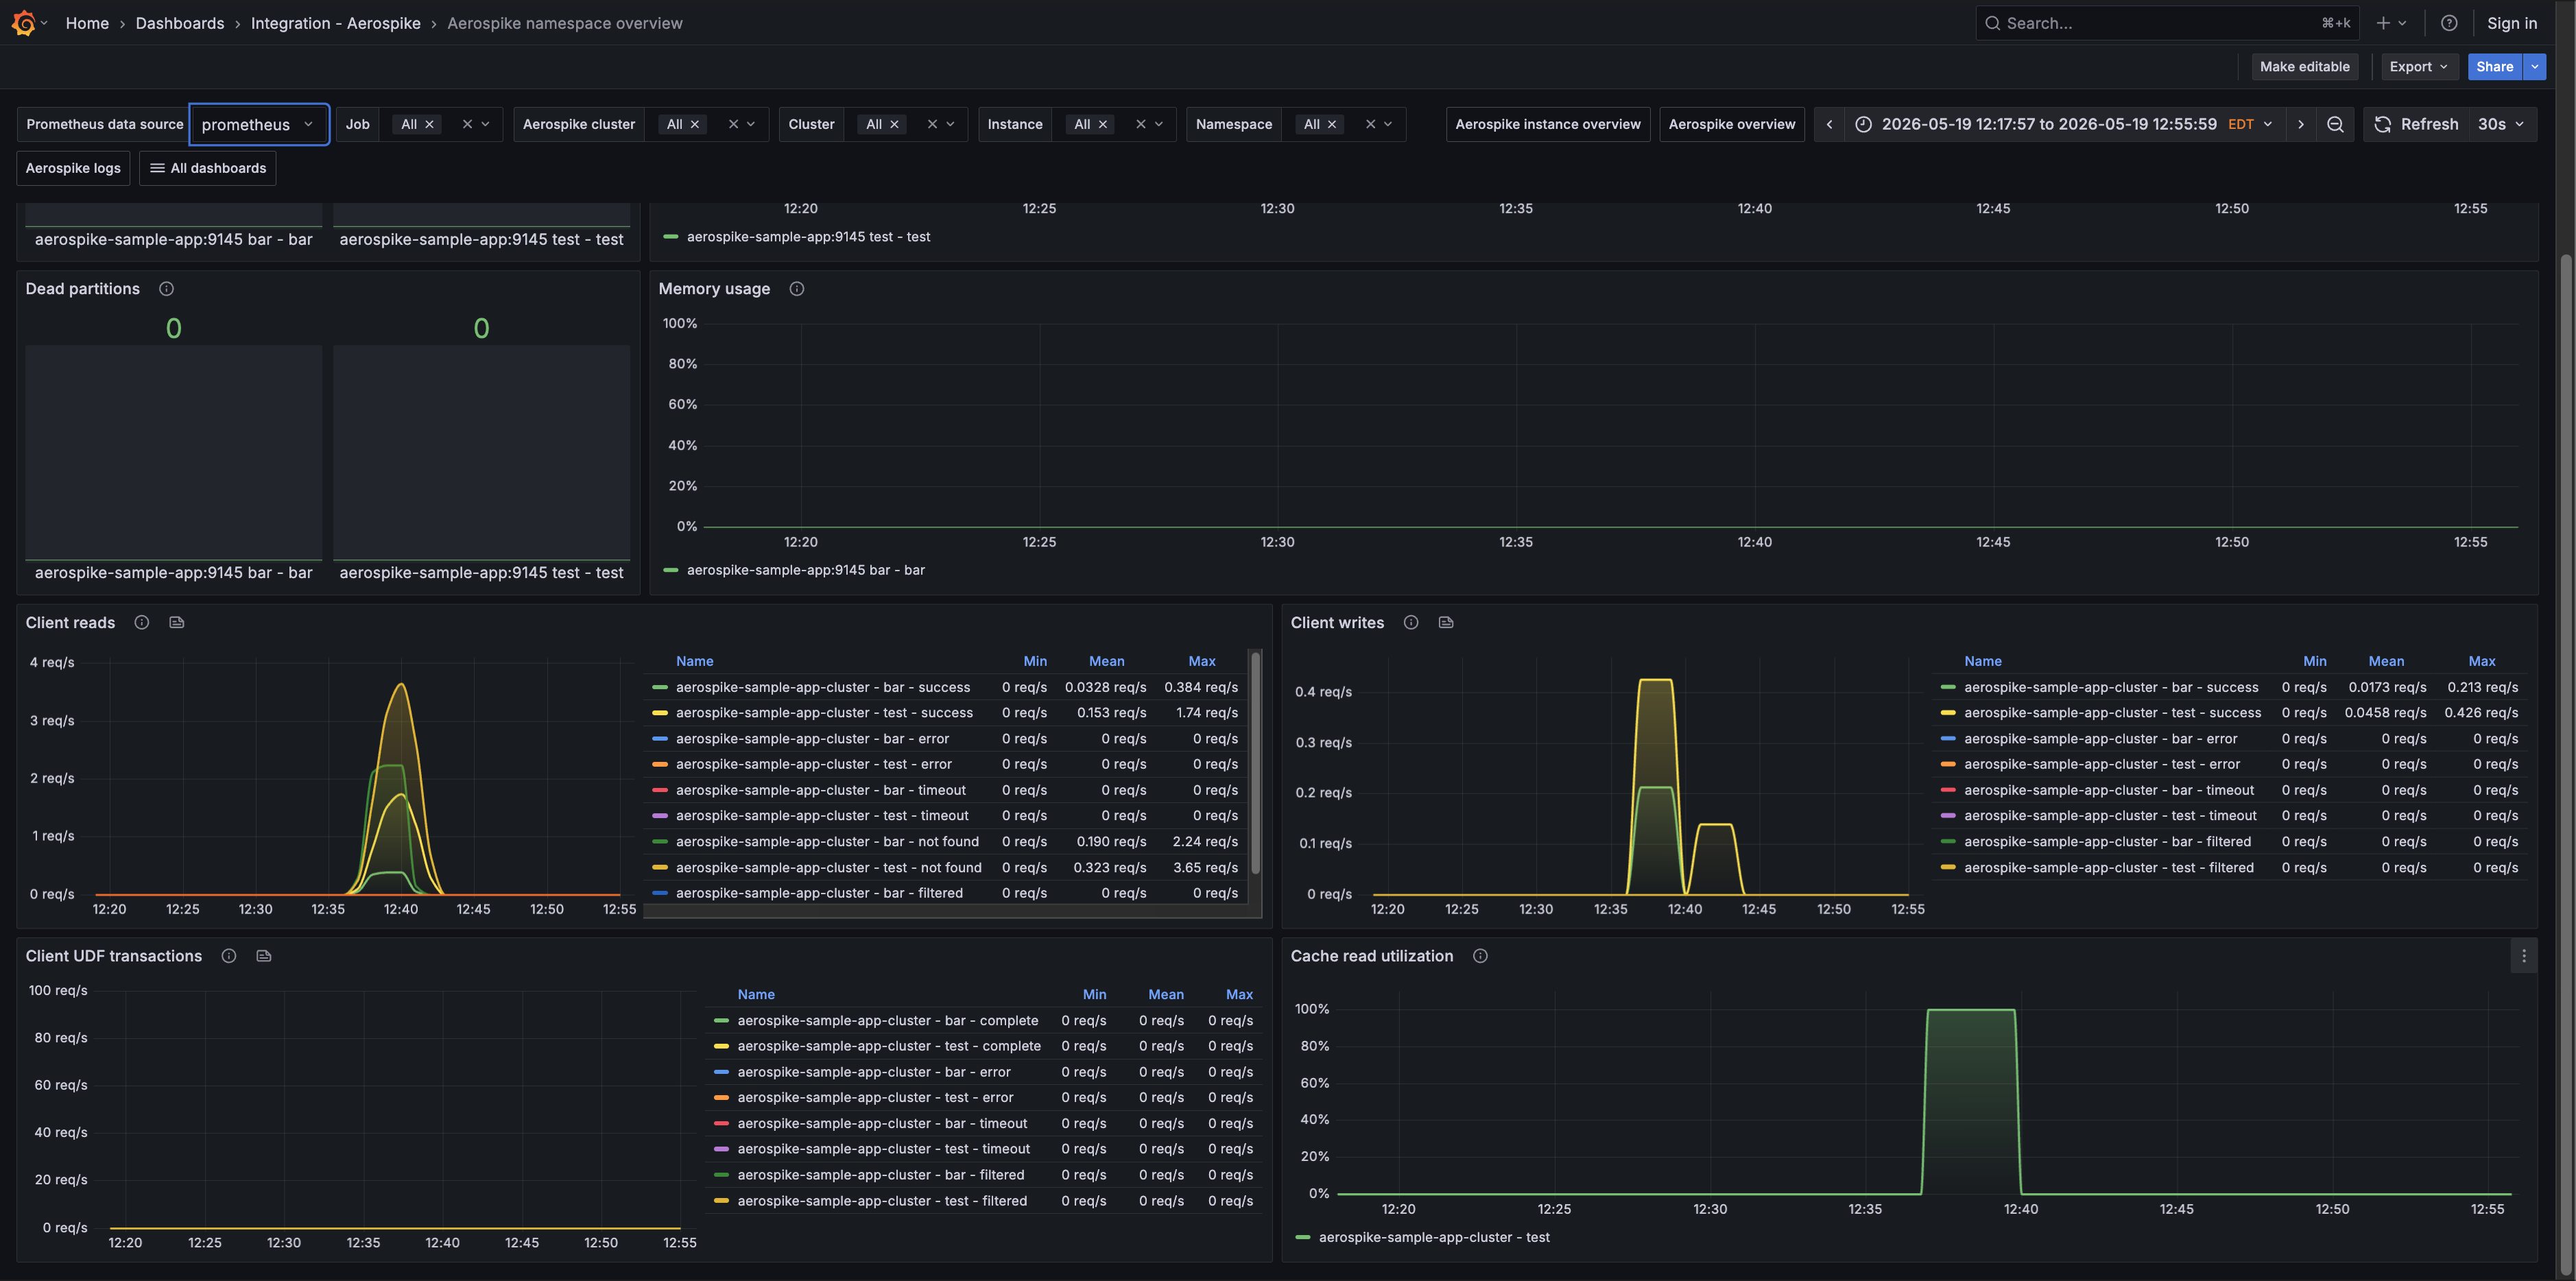
Aerospike namespace overview (client requests)
Key metrics
aerospike_namespace_cache_read_pct
aerospike_namespace_client_read_error
aerospike_namespace_client_read_filtered_out
aerospike_namespace_client_read_not_found
aerospike_namespace_client_read_success
aerospike_namespace_client_read_timeout
aerospike_namespace_client_udf_complete
aerospike_namespace_client_udf_error
aerospike_namespace_client_udf_filtered_out
aerospike_namespace_client_udf_timeout
aerospike_namespace_client_write_error
aerospike_namespace_client_write_filtered_out
aerospike_namespace_client_write_success
aerospike_namespace_client_write_timeout
aerospike_namespace_clock_skew_stop_writes
aerospike_namespace_dead_partitions
aerospike_namespace_device_free_pct
aerospike_namespace_memory_free_pct
aerospike_namespace_ns_cluster_size
aerospike_namespace_stop_writes
aerospike_namespace_unavailable_partitions
aerospike_namespace_xmem_id
aerospike_node_stats_client_connections
aerospike_node_stats_fabric_connections
aerospike_node_stats_heap_efficiency_pct
aerospike_node_stats_heartbeat_connections
aerospike_node_stats_system_free_mem_pct
aerospike_node_up
Key alerting rules included
AerospikeNodeHighMemoryUsage
AerospikeNamespaceHighDiskUsage
AerospikeUnavailablePartitions
AerospikeDeadPartitions
AerospikeNamespaceRejectingWrites
AerospikeHighClientReadErrorRate
AerospikeHighClientWriteErrorRate
AerospikeHighClientUDFErrorRate