
Compact Hostmap Panel for Grafana
Grafana Panel Plugin to easily understand the host's system metric at a glance
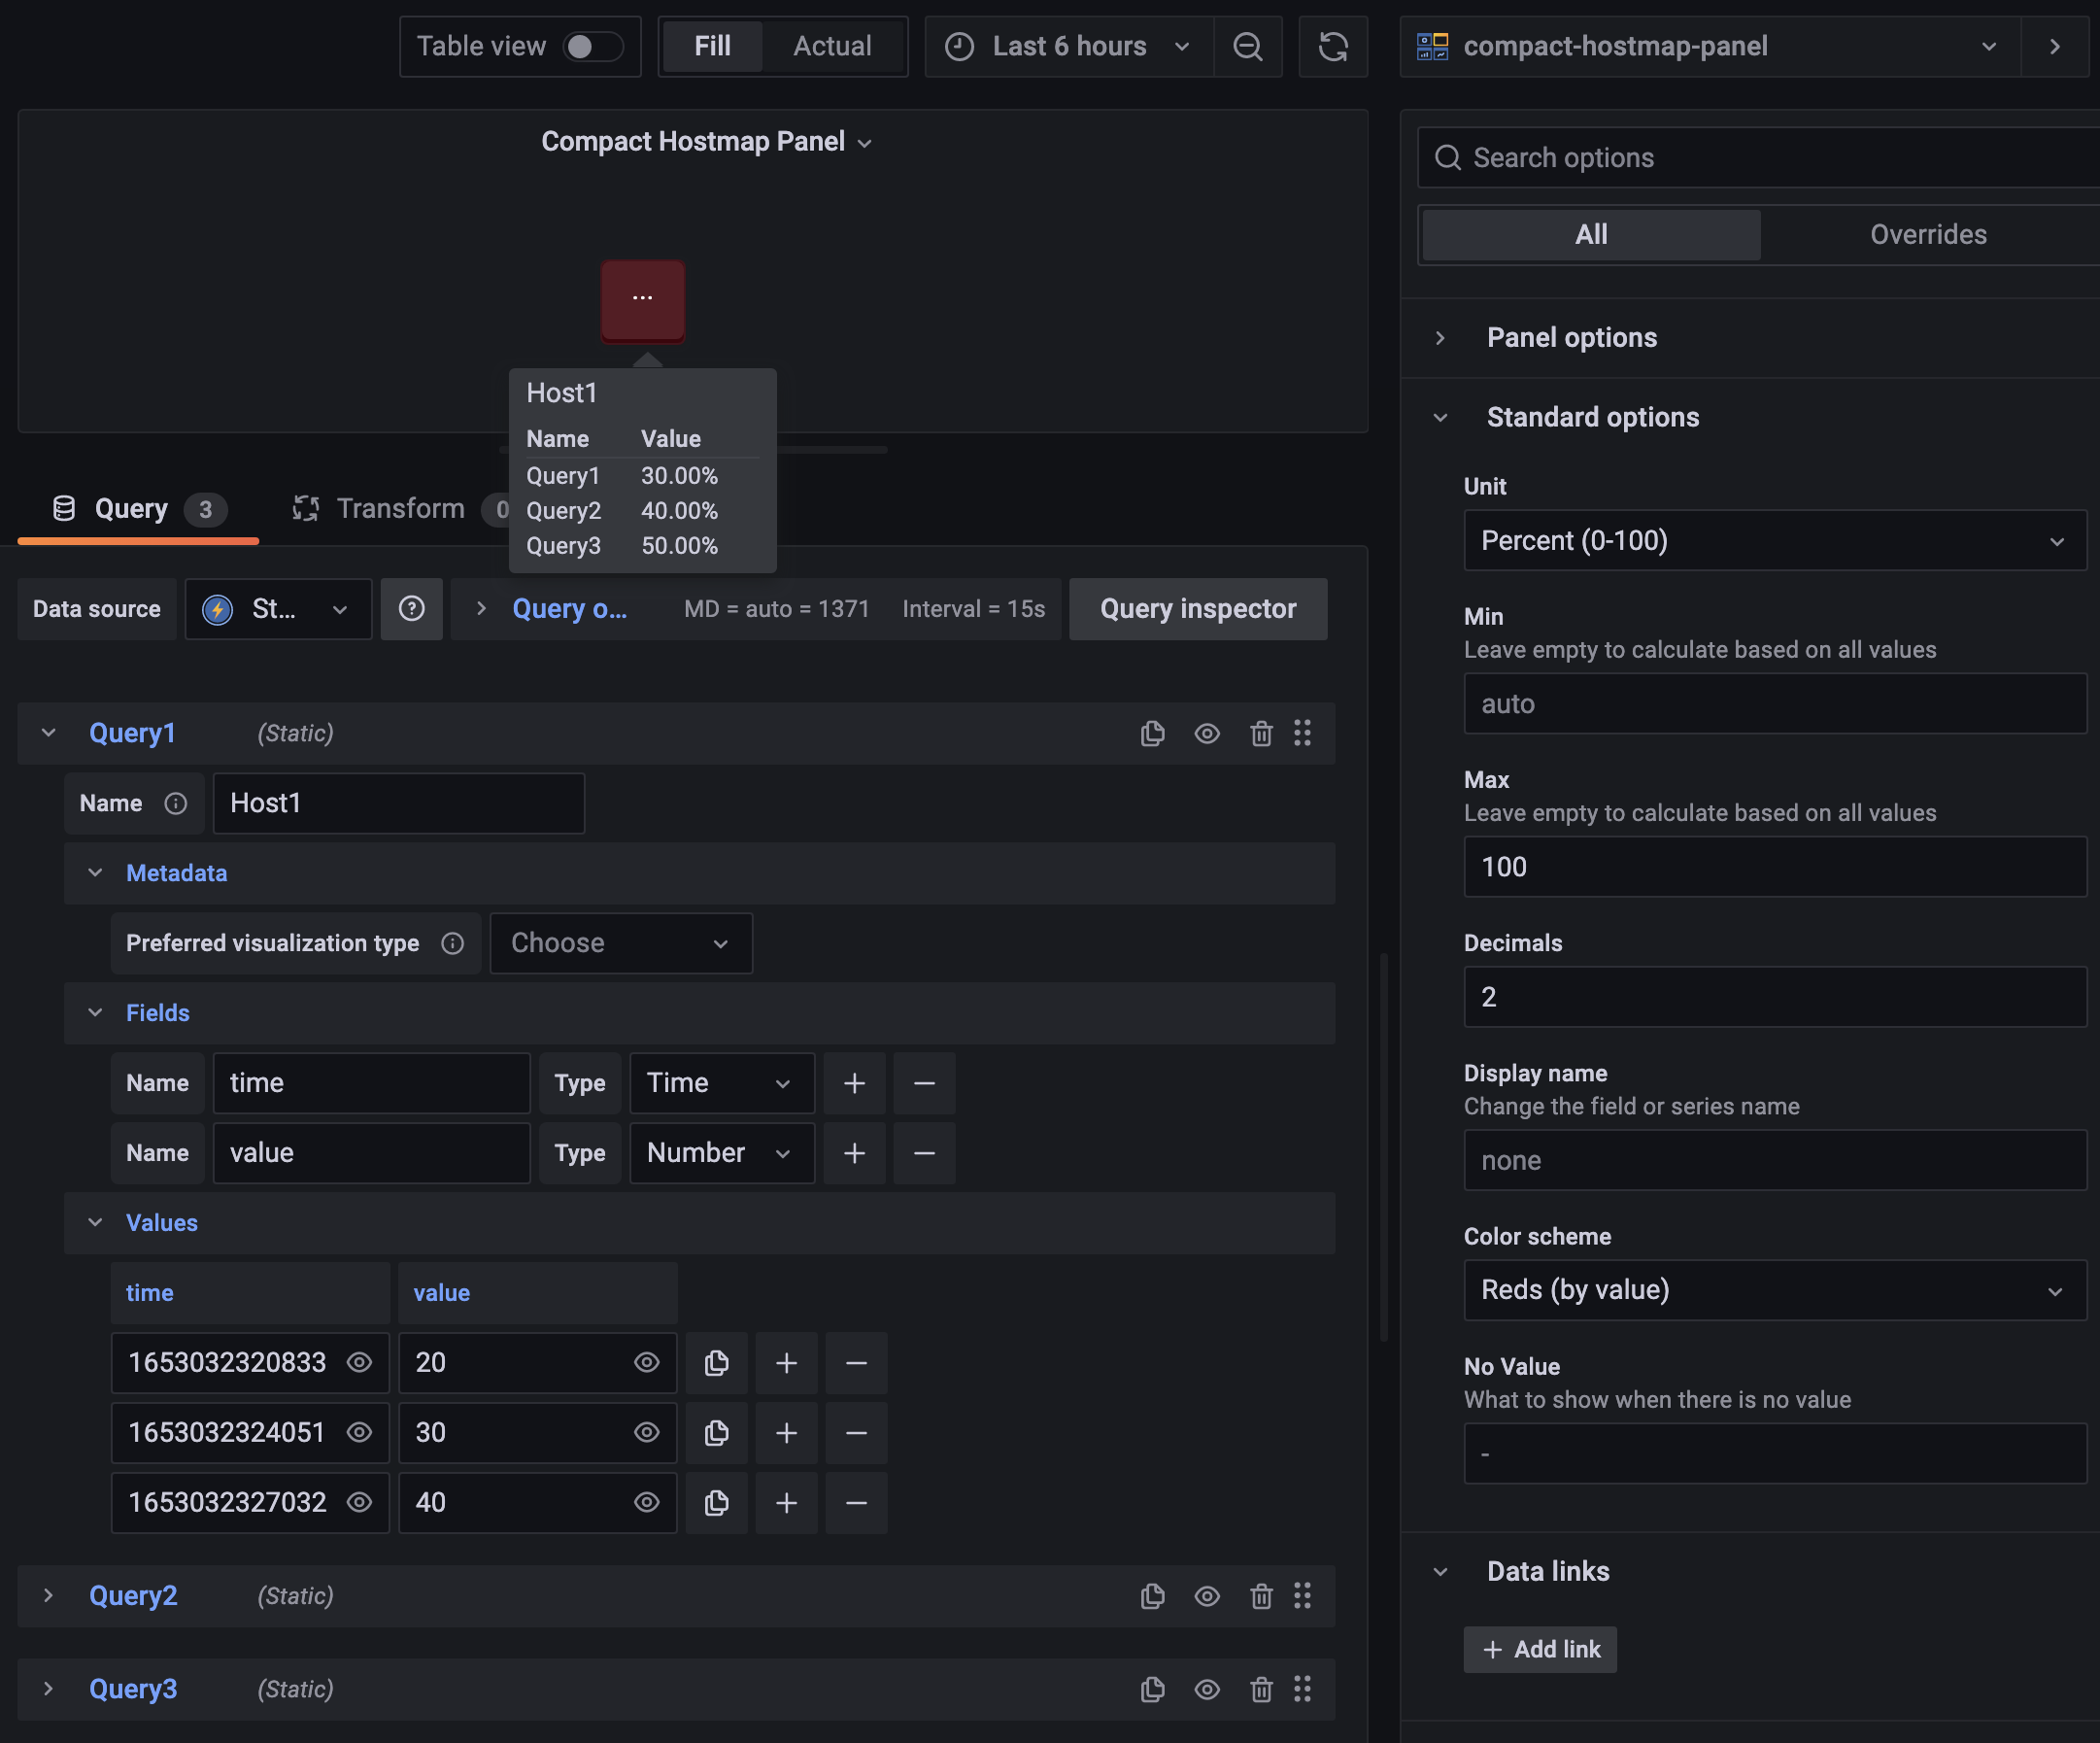
Supported Datasources
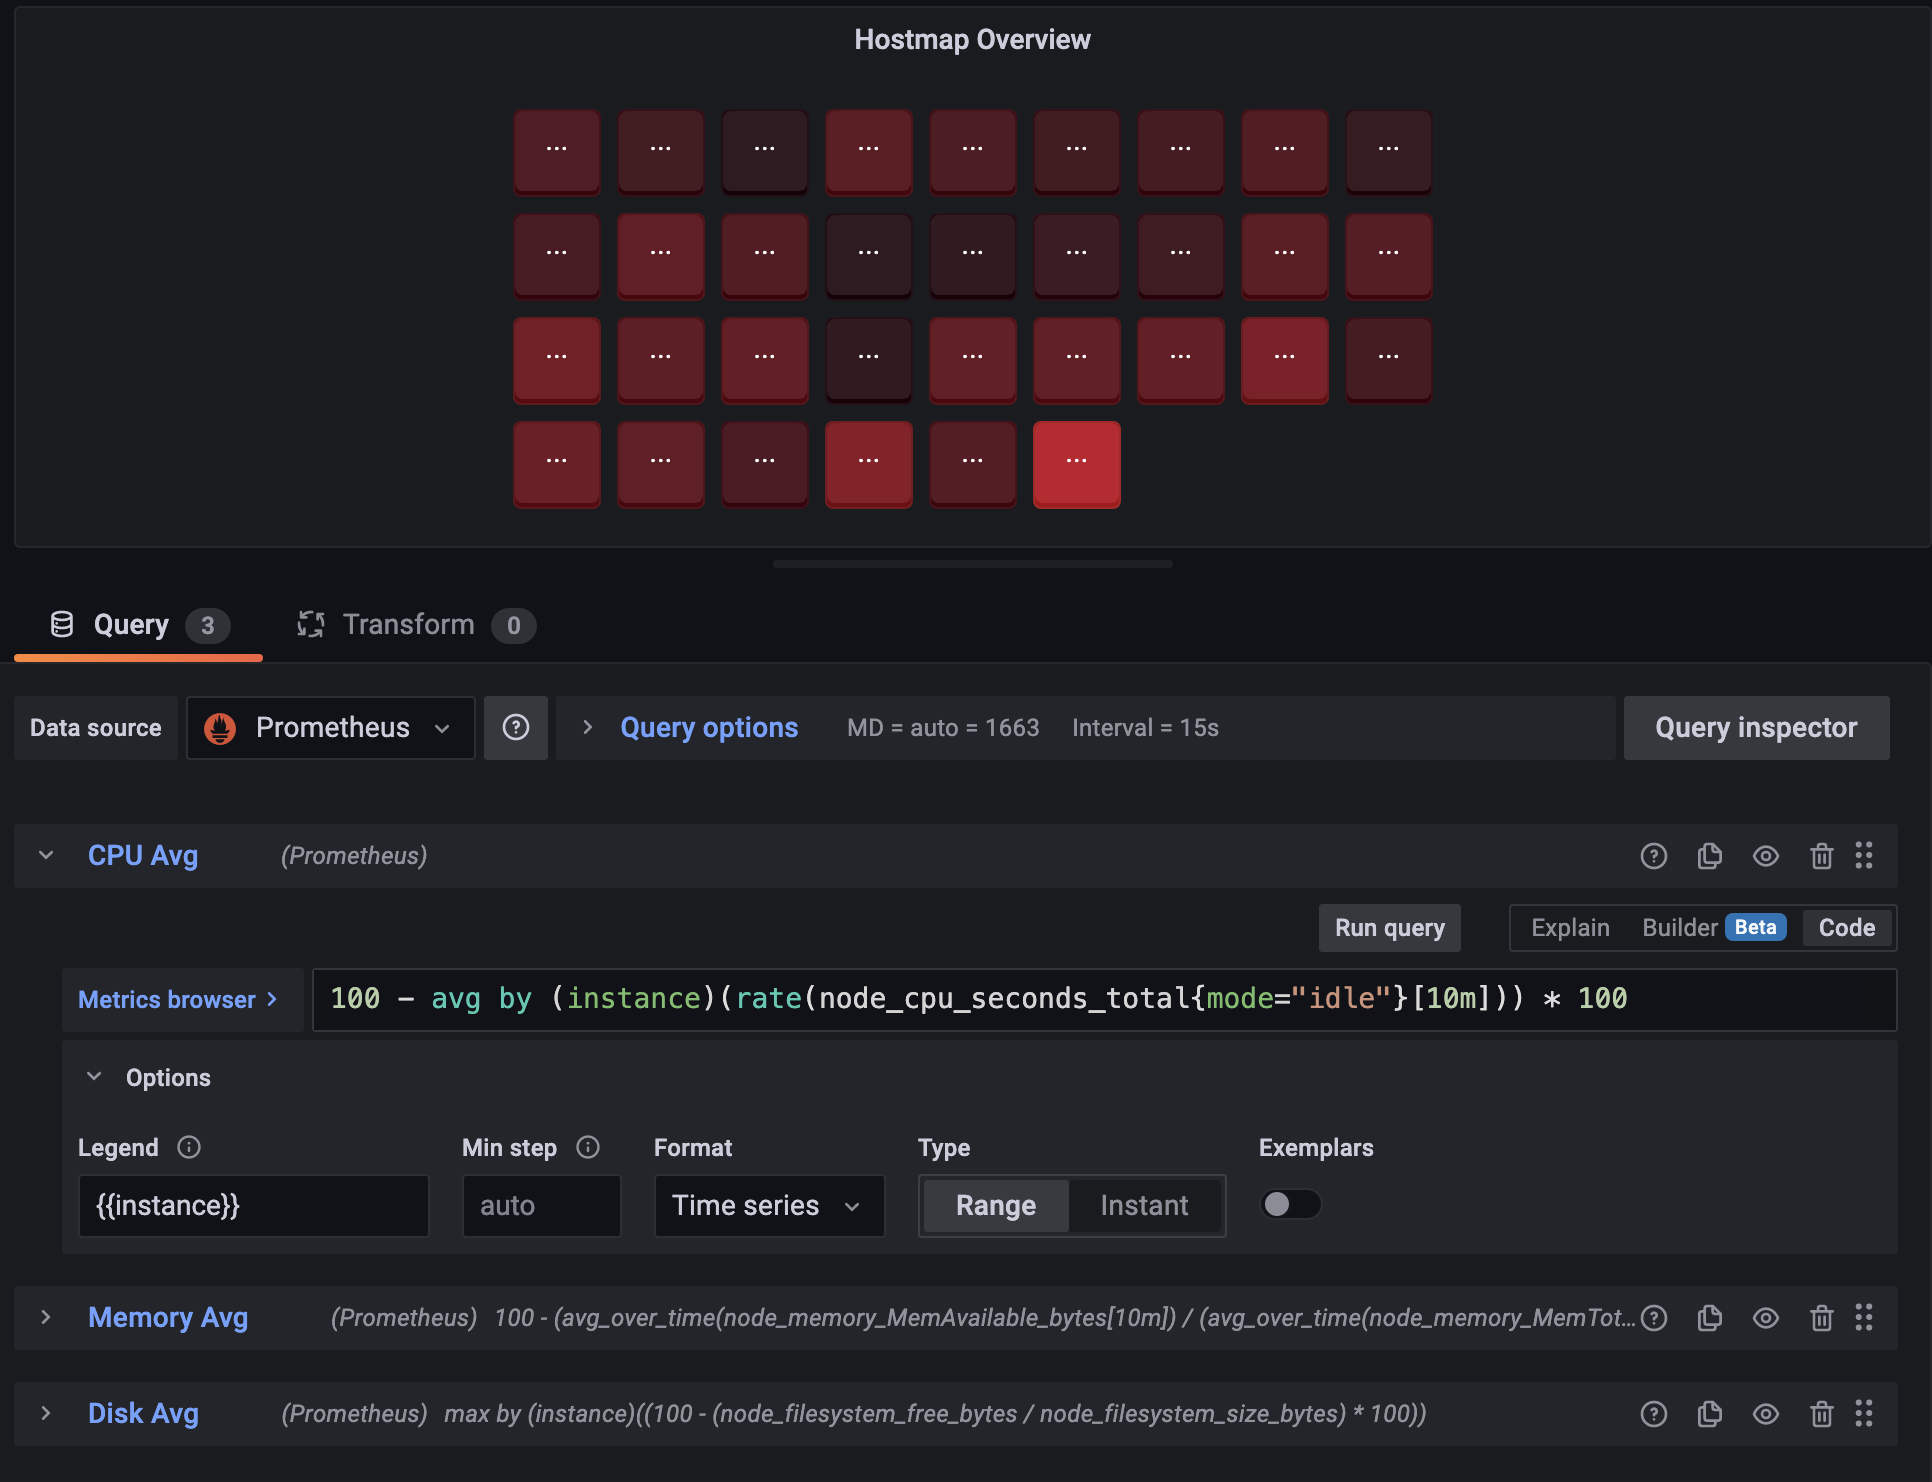
- promethues
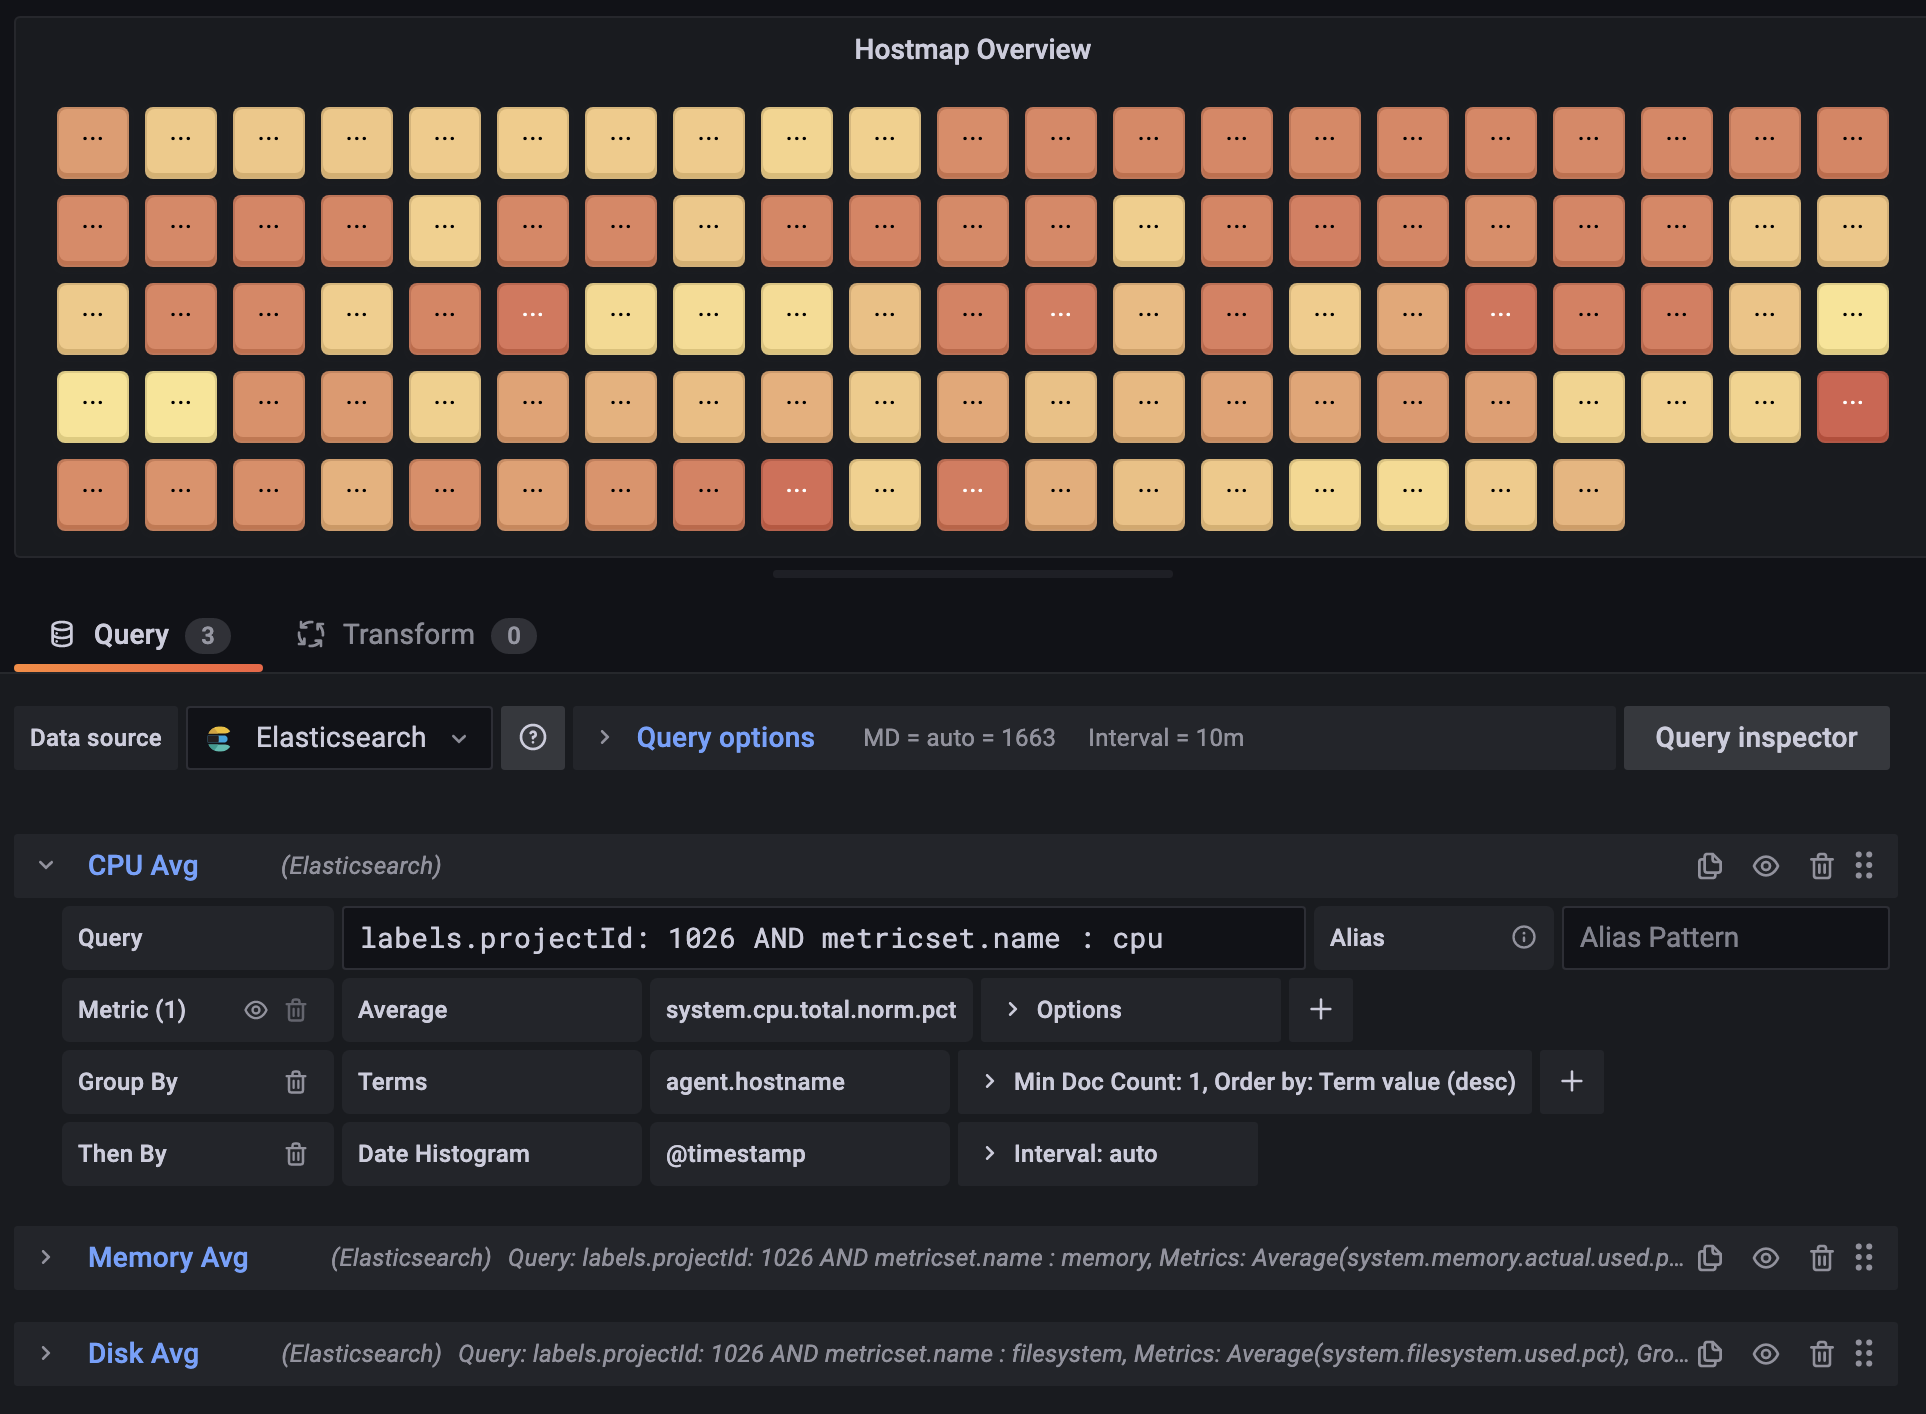
- elasticsearch
tested.
Supports Grafana plugin interface data frames, groupBy each frame based on name || field's config.displayName || config.displayNameFromDS field's key.
ETC
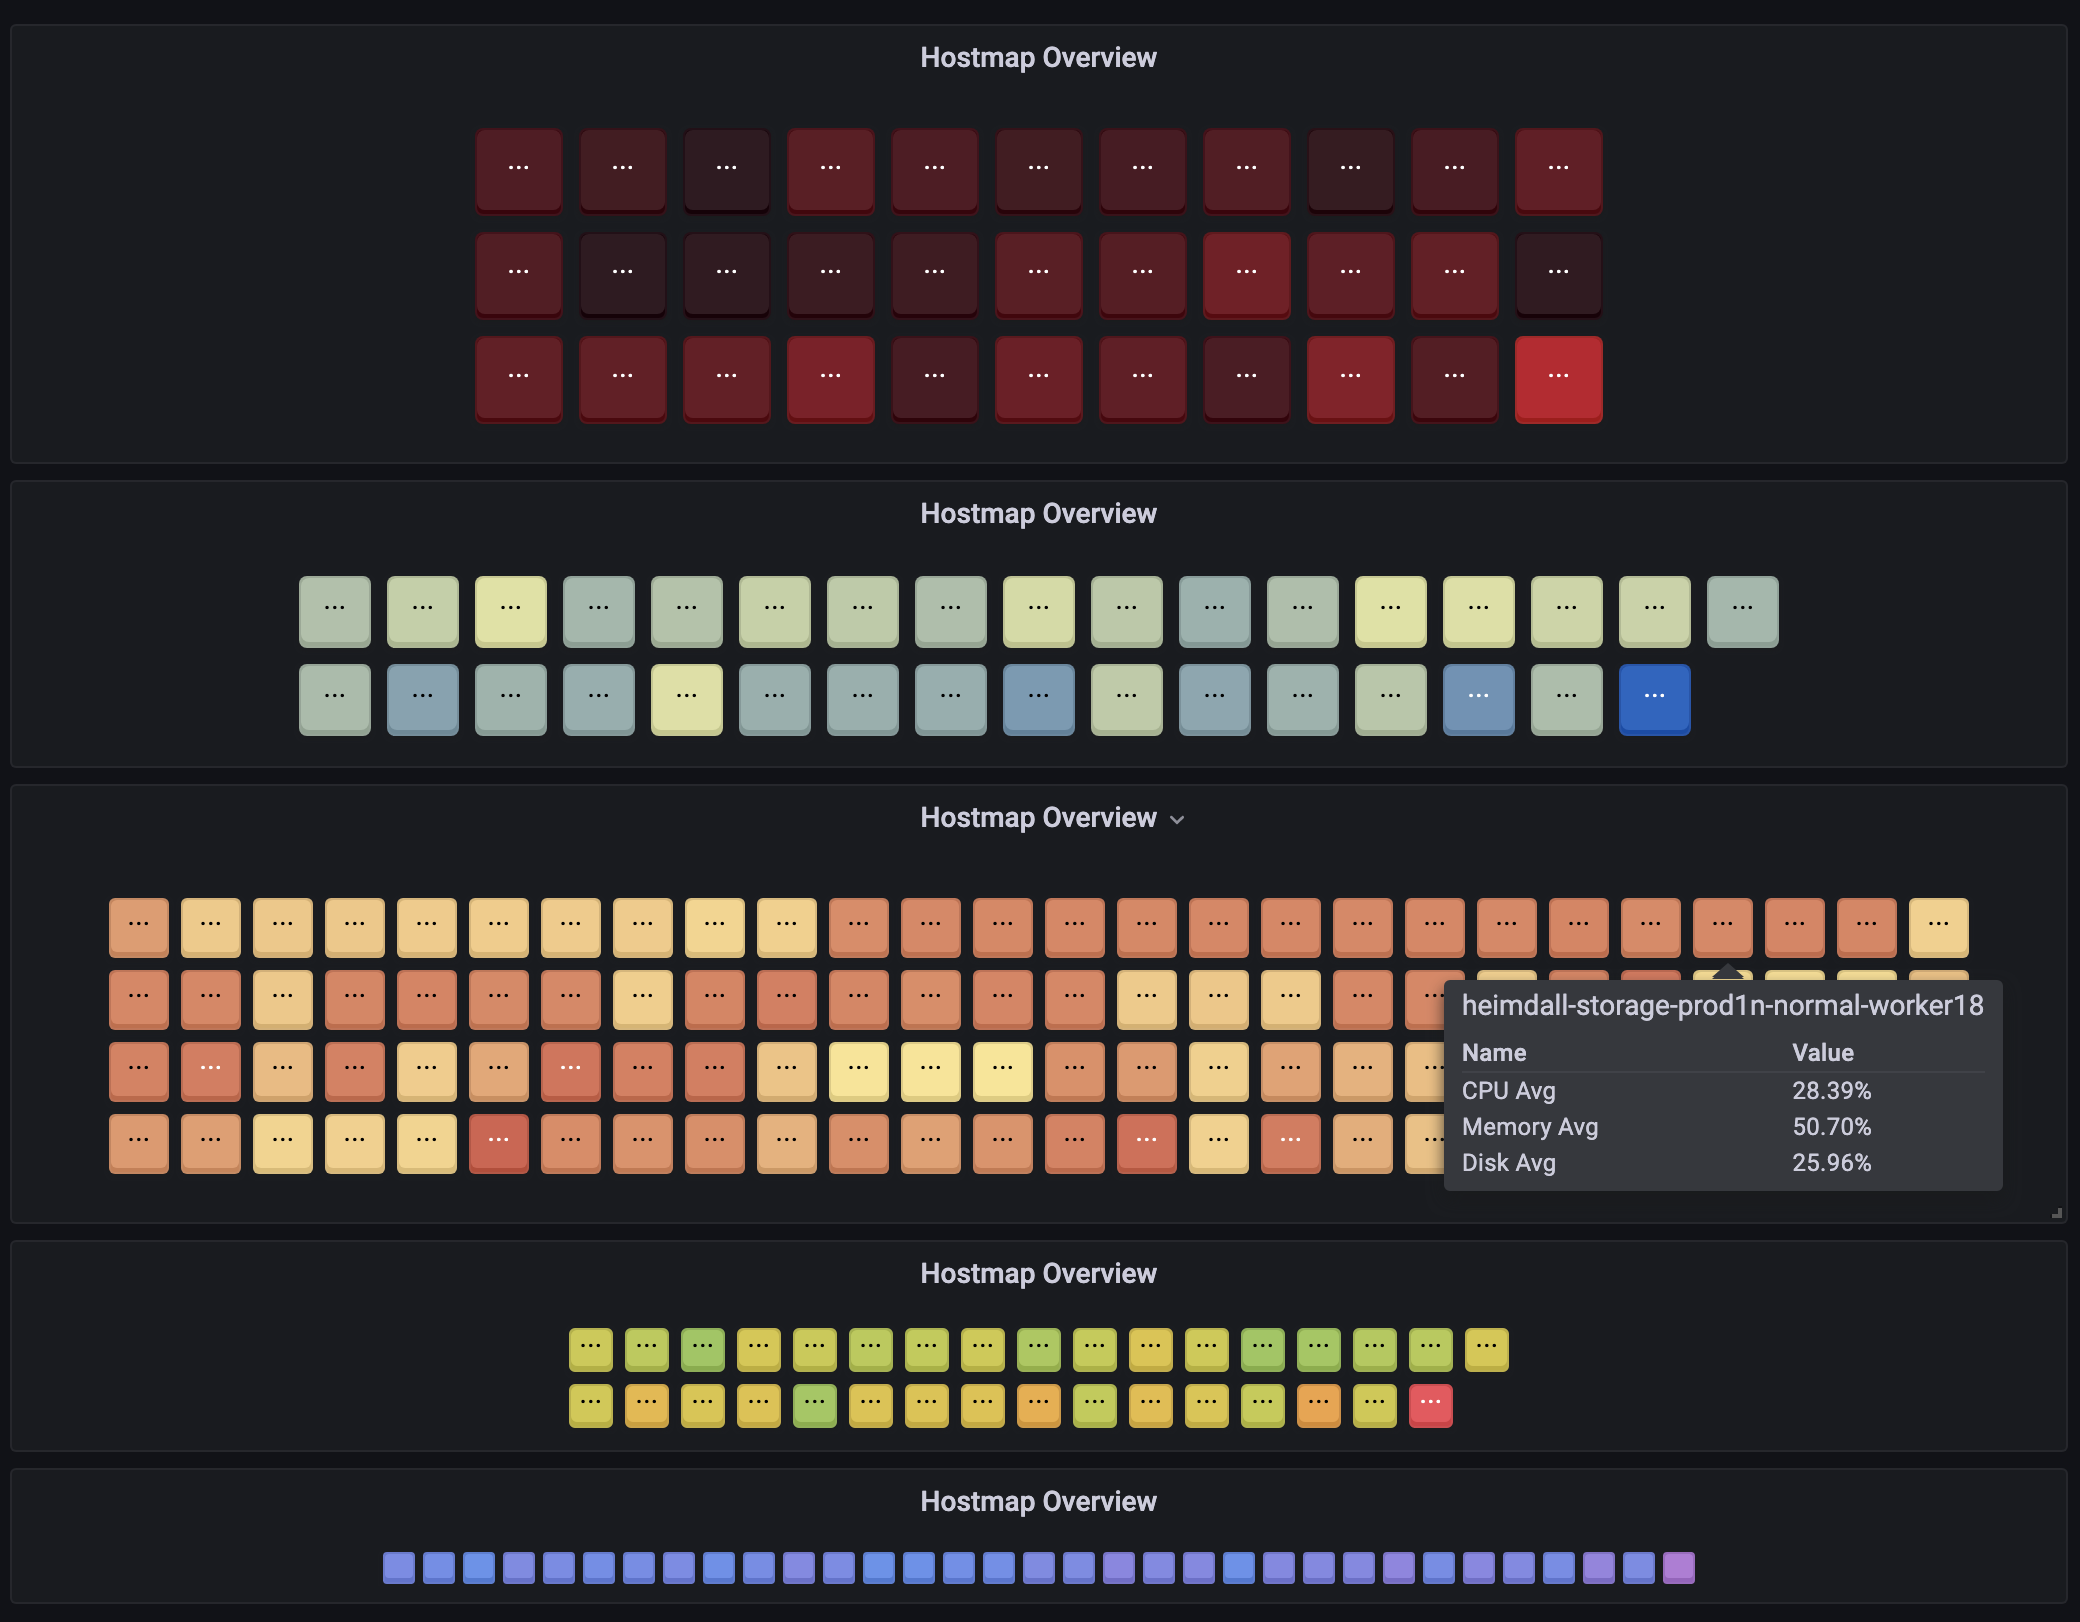
HostItem is rendered in response to panel size, and Color Threshold is mapped to the largest value.
Grafana Cloud
Connect any plugin in Grafana Cloud.
- 150+ data source integrations
- Grafana Assistant - AI that correlates your data, builds queries, and answers questions
- 10k Prometheus metrics + 50 GB logs, traces, and profiles on the free tier
- ...and more
Insights
- Adoption
Running on 5,280 active Grafana instances.
- Activity
Last updated 19 Jan 2024.
0 releases in the past year.
- Version
- 0.9.2
- Dependencies
- Grafana >=8.3.0
- Developer
- zestairlove
Grafana Cloud
Connect any plugin in Grafana Cloud.
- 150+ data source integrations
- Grafana Assistant - AI that correlates your data, builds queries, and answers questions
- 10k Prometheus metrics + 50 GB logs, traces, and profiles on the free tier
- ...and more