
Plugins 〉Chaos Mesh


Chaos Mesh


Data Source
Grafana data source plugin for Chaos Mesh.
This plugin requires Chaos Mesh >=2.1, Grafana >= 10.0.
Note: We only test the plugin on Grafana 10.0.3, it may support lower versions, but we are not sure. Upgrading to Grafana v10 is because of the Angular support deprecation. If you encounter any problems, please open an issue to let us know.
Features
- Displaying Chaos events in a table visualization
- Support Variables to filter Chaos events
- Support Annotations to annotate Chaos events on the panel
Install
With dashboard
https://grafana.com/docs/grafana/latest/administration/plugin-management/#install-a-plugin
With cli
grafana-cli plugins install chaosmeshorg-datasource
Manual installation
Download the plugin zip package with the following command or go to https://github.com/chaos-mesh/datasource/releases to download:
curl -LO https://github.com/chaos-mesh/datasource/releases/download/v3.0.0/chaosmeshorg-datasource-3.0.0.zip
After downloading, unzip:
unzip chaosmeshorg-datasource-3.0.0.zip -d YOUR_PLUGIN_DIR
Then update and save the grafana.ini file:
[plugins]
  allow_loading_unsigned_plugins = chaosmeshorg-datasource
Finally, restart Grafana to load the plugin.
Setup
Once installed, go to Administration -> Data sources and add Chaos Mesh, then go to the configuration page:
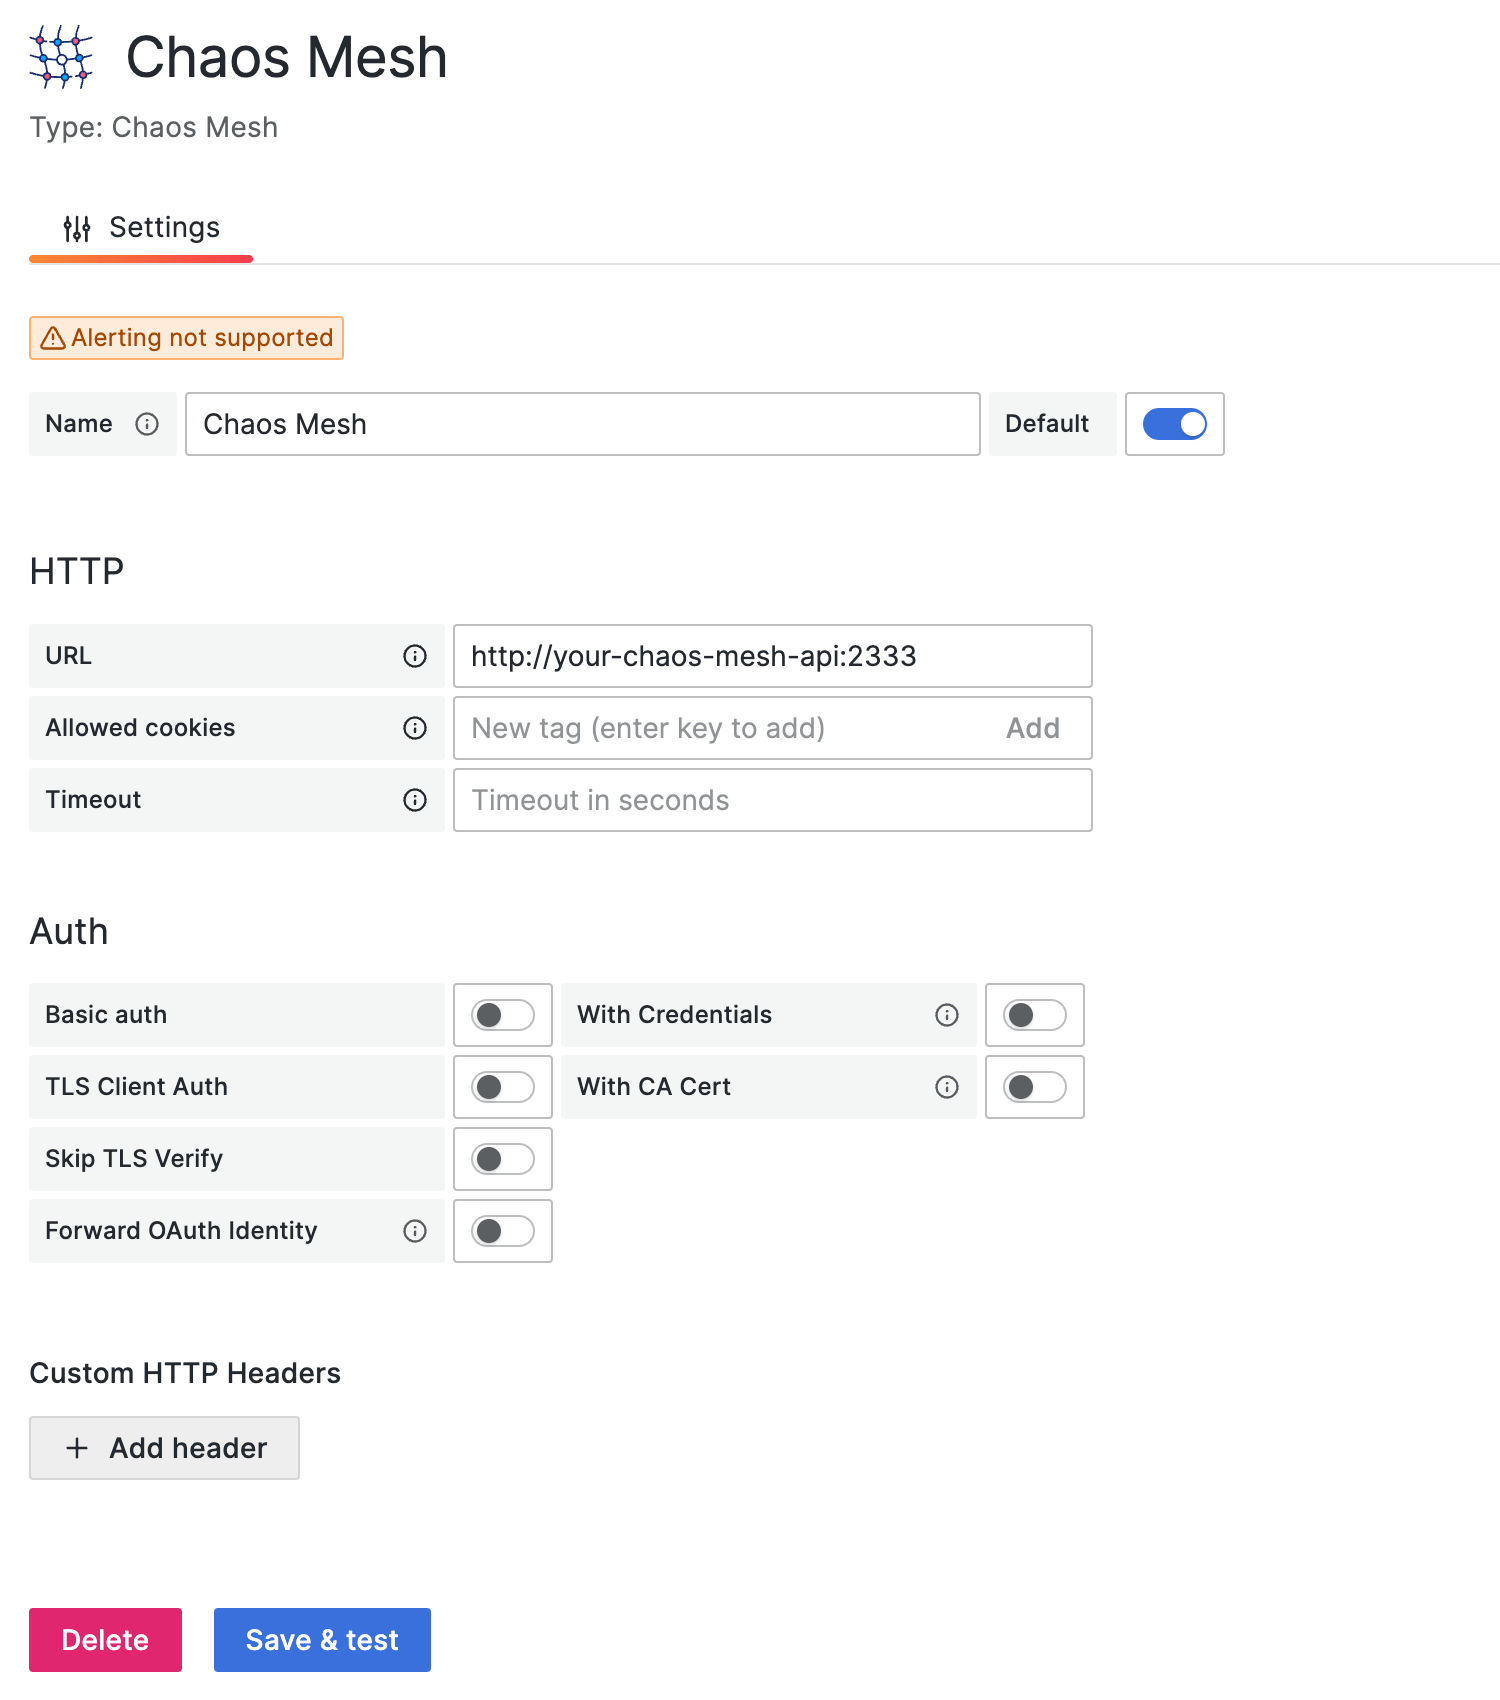
Assuming you have Chaos Mesh installed locally, the Chaos Dashboard will export the API on port 2333 by default. So, if you haven't changed anything, you can fill in http://localhost:2333.
Then use the port-forward command to activate:
kubectl port-forward -n chaos-testing svc/chaos-dashboard 2333:2333
Finally, click Save & test to test the connection. If it shows a successful notification, the setup is complete.
Query
The data source plugin looks at the Chaos Mesh through the lens of events, and the following options are responsible for filtering the different events:
Object ID
Filter by object uuid.
Namespace
Filter by different namespace.
Name
Filter by object name.
Kind
Filter by kind (PodChaos, NetworkChaos, Schedule...). You can also input an arbitrary kind if you implement a new kind in Chaos Mesh.
Limit
Limit the number of events.
All of them will be passed as parameters to the /api/events API.
Variables
The data source plugin supports adding query variables by different metrics:
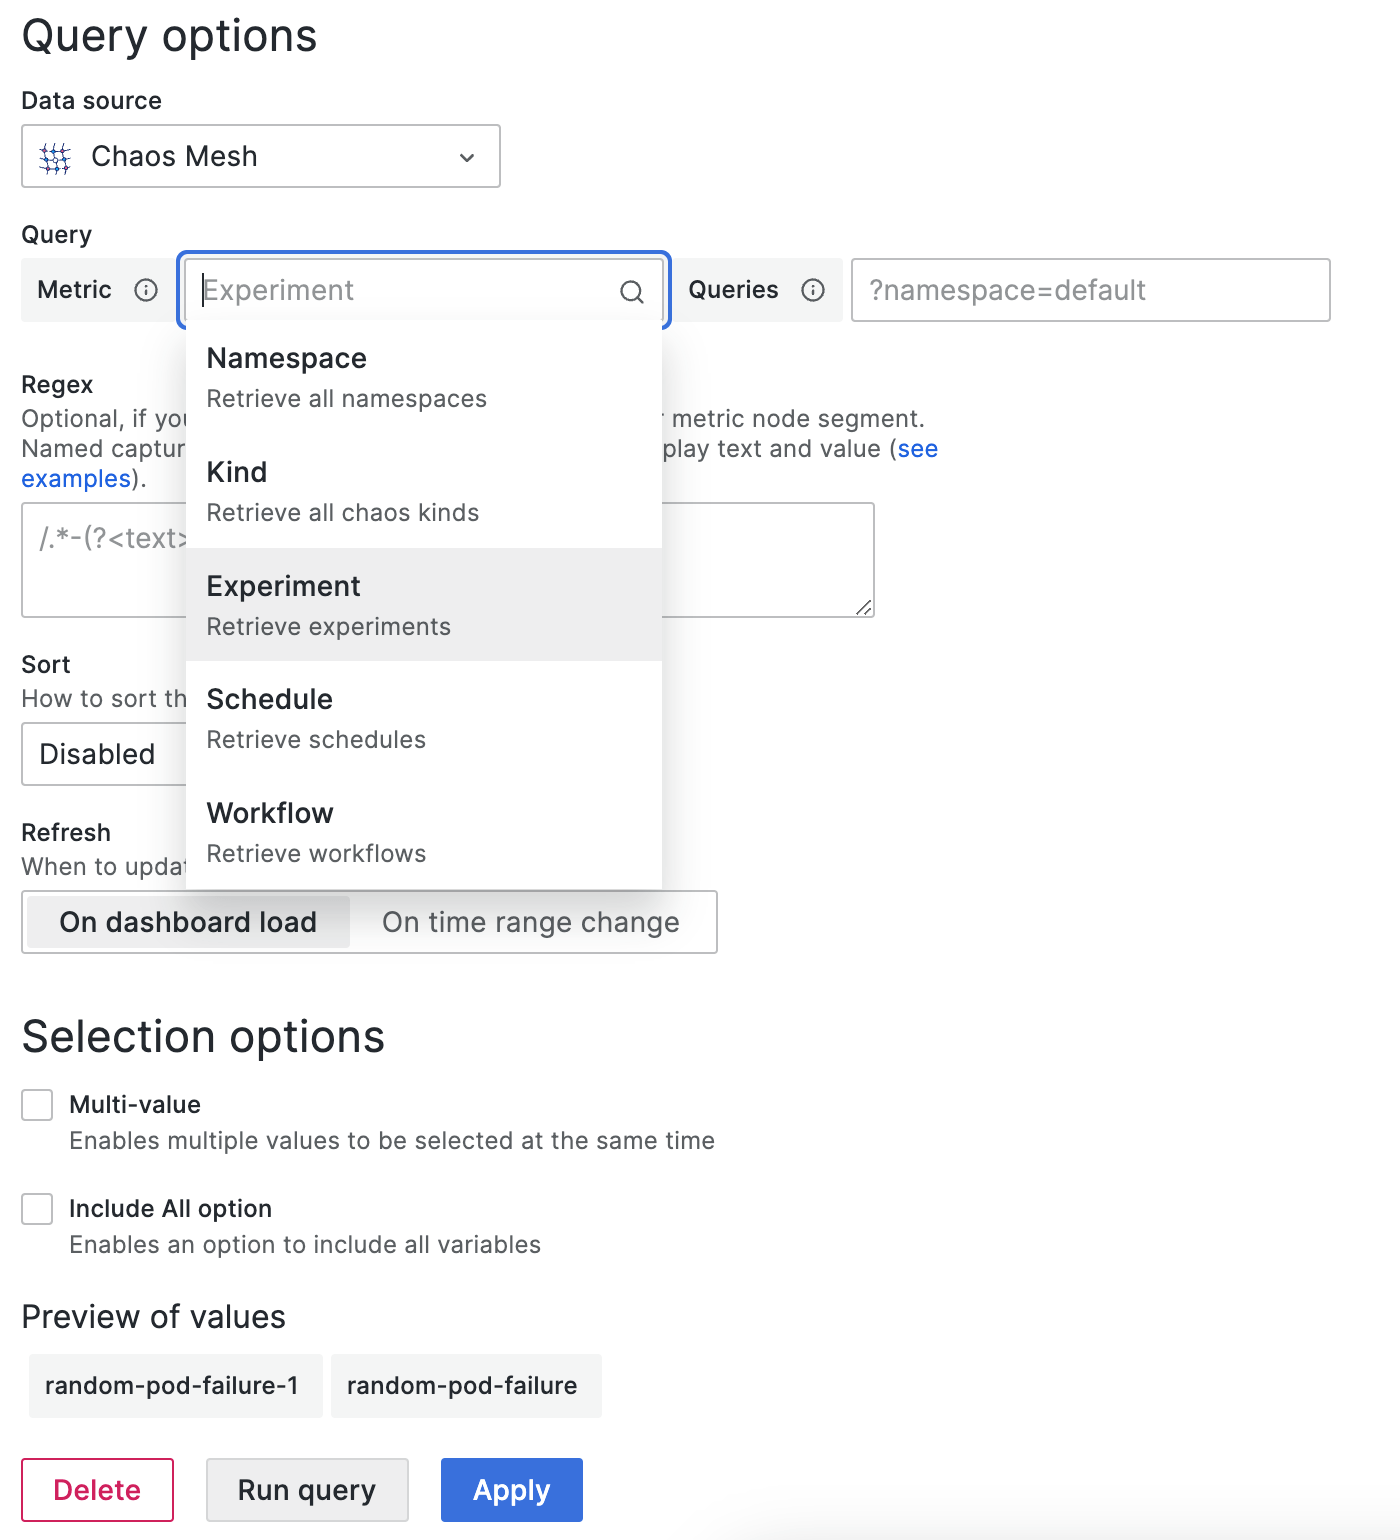
Namespace
After selection, all available namespaces will show in the Preview of values directly.
Kind
Same as Namespace. Retrieve all kinds.
Experiment/Schedule/Workflow
Same as Namespace. Retrieve current all experiments/schedules/workflows.
You can also specify the
queriesto further filter the values, for example,?namespace=defaultwill only retrieve the experiments/schedules/workflows in thedefaultnamespace.
Annotations
You can integrate events into panels via annotations, the following is a sample creation, it will retrieve all PodChaos events:
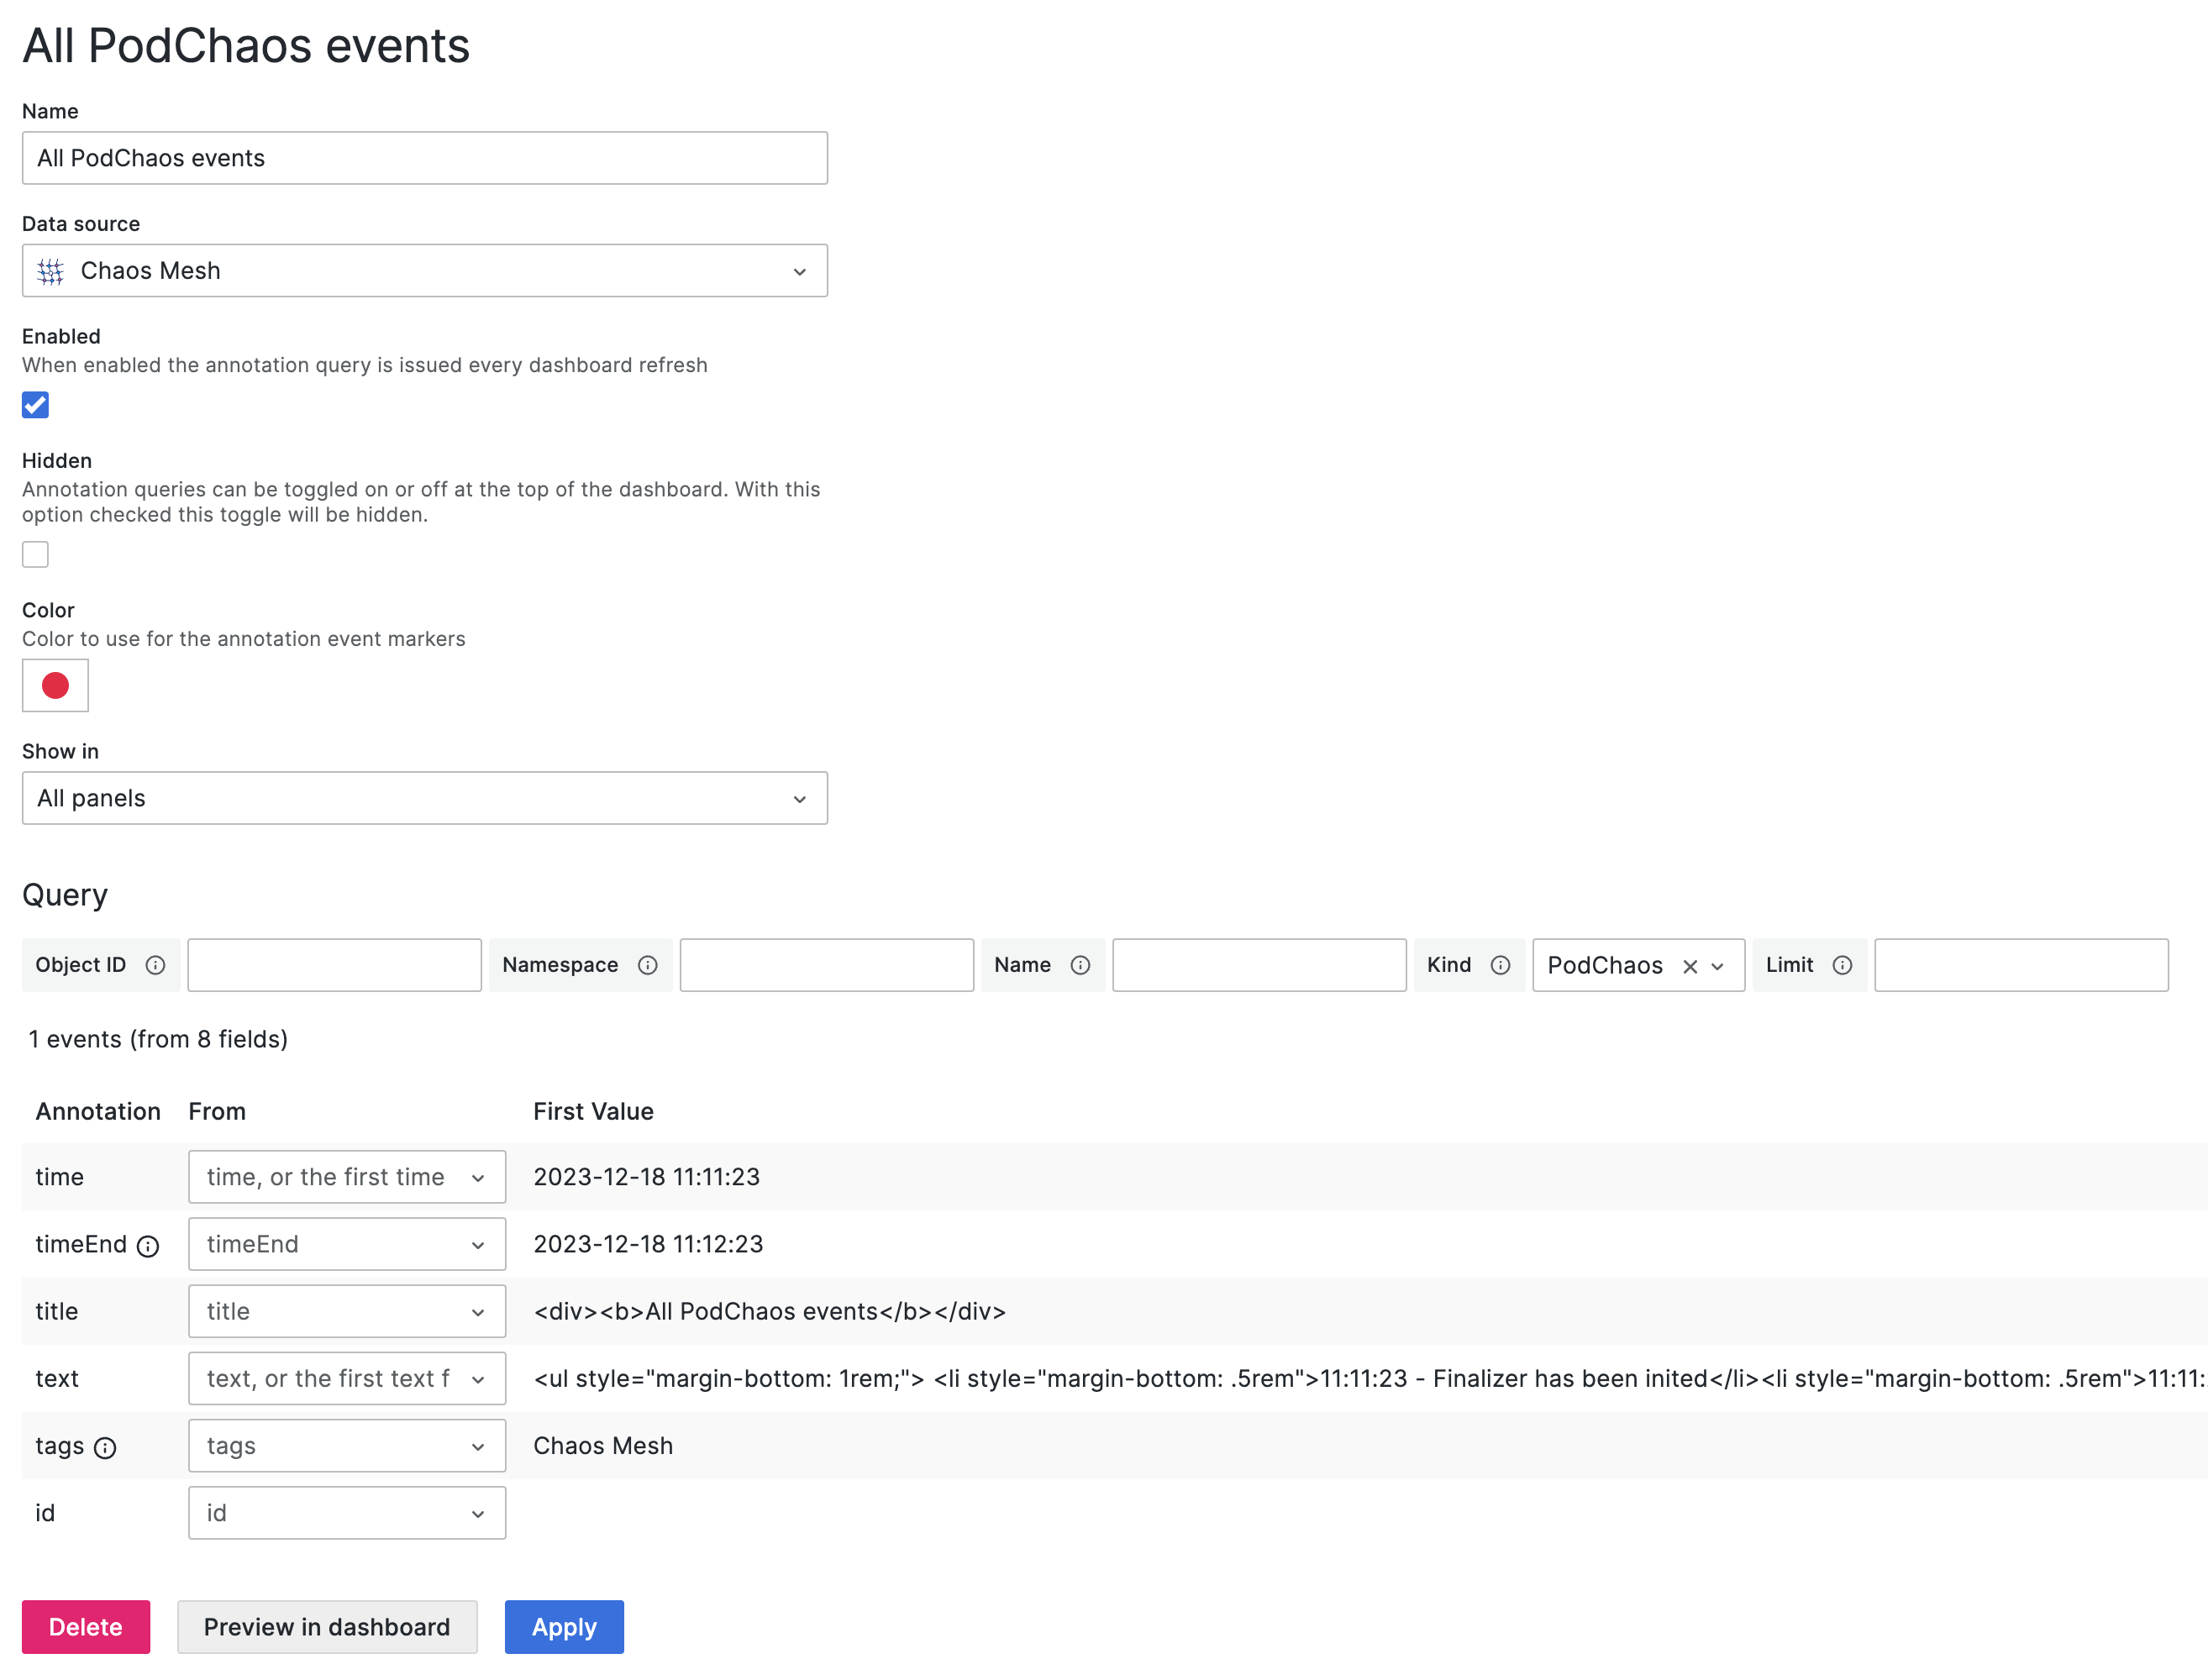
Please refer to Query to fill in the corresponding fields.
How to contribute
Pull a request or open an issue to describe your changes or problems.
License
Same as Chaos Mesh. Under the Apache-2.0 License.
Grafana Cloud Free
- Free tier: Limited to 3 users
- Paid plans: $55 / user / month above included usage
- Access to all Enterprise Plugins
- Fully managed service (not available to self-manage)
Self-hosted Grafana Enterprise
- Access to all Enterprise plugins
- All Grafana Enterprise features
- Self-manage on your own infrastructure
Installing Chaos Mesh on Grafana Cloud:
Installing plugins on a Grafana Cloud instance is a one-click install; same with updates. Cool, right?
Note that it could take up to 1 minute to see the plugin show up in your Grafana.
Installing plugins on a Grafana Cloud instance is a one-click install; same with updates. Cool, right?
Note that it could take up to 1 minute to see the plugin show up in your Grafana.
Installing plugins on a Grafana Cloud instance is a one-click install; same with updates. Cool, right?
Note that it could take up to 1 minute to see the plugin show up in your Grafana.
Installing plugins on a Grafana Cloud instance is a one-click install; same with updates. Cool, right?
Note that it could take up to 1 minute to see the plugin show up in your Grafana.
Installing plugins on a Grafana Cloud instance is a one-click install; same with updates. Cool, right?
Note that it could take up to 1 minute to see the plugin show up in your Grafana.
Installing plugins on a Grafana Cloud instance is a one-click install; same with updates. Cool, right?
Note that it could take up to 1 minute to see the plugin show up in your Grafana.
Installing plugins on a Grafana Cloud instance is a one-click install; same with updates. Cool, right?
Note that it could take up to 1 minute to see the plugin show up in your Grafana.
For more information, visit the docs on plugin installation.
Installing on a local Grafana:
For local instances, plugins are installed and updated via a simple CLI command. Plugins are not updated automatically, however you will be notified when updates are available right within your Grafana.
1. Install the Data Source
Use the grafana-cli tool to install Chaos Mesh from the commandline:
grafana-cli plugins install The plugin will be installed into your grafana plugins directory; the default is /var/lib/grafana/plugins. More information on the cli tool.
Alternatively, you can manually download the .zip file for your architecture below and unpack it into your grafana plugins directory.
Alternatively, you can manually download the .zip file and unpack it into your grafana plugins directory.
2. Configure the Data Source
Accessed from the Grafana main menu, newly installed data sources can be added immediately within the Data Sources section.
Next, click the Add data source button in the upper right. The data source will be available for selection in the Type select box.
To see a list of installed data sources, click the Plugins item in the main menu. Both core data sources and installed data sources will appear.
Changelog
All notable changes to this project will be documented in this file.
The format is based on Keep a Changelog, and this project adheres to Semantic Versioning.
[3.0.0] - 2023-12-18
Changed
Deprecate Angular support. Refer to #55 for more details. Please also read the README for new information.
[2.2.3] - 2022-08-07
Fixed
- Update the outdated annotations screenshot.
[2.2.2] - 2022-07-31
Changed
Ready for submission to grafana official plugins repository. 🥰
[2.2.1] - 2022-07-28
Fixed
- Clone the annotation query before using it, which prevents mutating the original value if you use a variable in annotations.
- Reset the
kindfield toinputin annotations, which allows you to use variables in the kind field, such as$kind.
[2.2.0] - 2022-06-24
Added
- Allow to specify a limit on the number of events for all queries in the settings
- Add
Workflowmetric to the Variables
Changed
- Optimize the display of annotations
Fixed
- Allow the
query stringto be specified in the Variables Query
[2.1.0] - 2021-09-16
Changed
- Compatible with Chaos Mesh 2.x (after 2.0.x, will start with 2.1.x).
- Bump the minimal grafana version to 7.0.0
- Bump grafana/toolkit to 8.x
[0.2.2] - 2021-04-15
Changed
- Allow custom value in the select field
[0.2.0] - 2021-03-09
Added
- Displaying Chaos events in a table visualization
- Support Variables to filter Chaos events
- Support Annotations to annotate Chaos events on the panel