Plugins 〉Business Forms


Business Forms
Business Forms for Grafana
![]()
![]()

This project was originally contributed by Volkov Labs - thanks for all your great work!
We have republished under the same plugin ID, keeping the community signature. This means you can simply update your plugin version. A new ID would have required manual updates to your dashboards. For additional information on the changes, see the Notices.
This project is currently maintained by Grafana Labs. We welcome pull requests and will review them on a best-effort basis. If you're interested in taking on this project long-term, contact integrations@grafana.com. We're eager to work with new maintainers and eventually hand over the project.
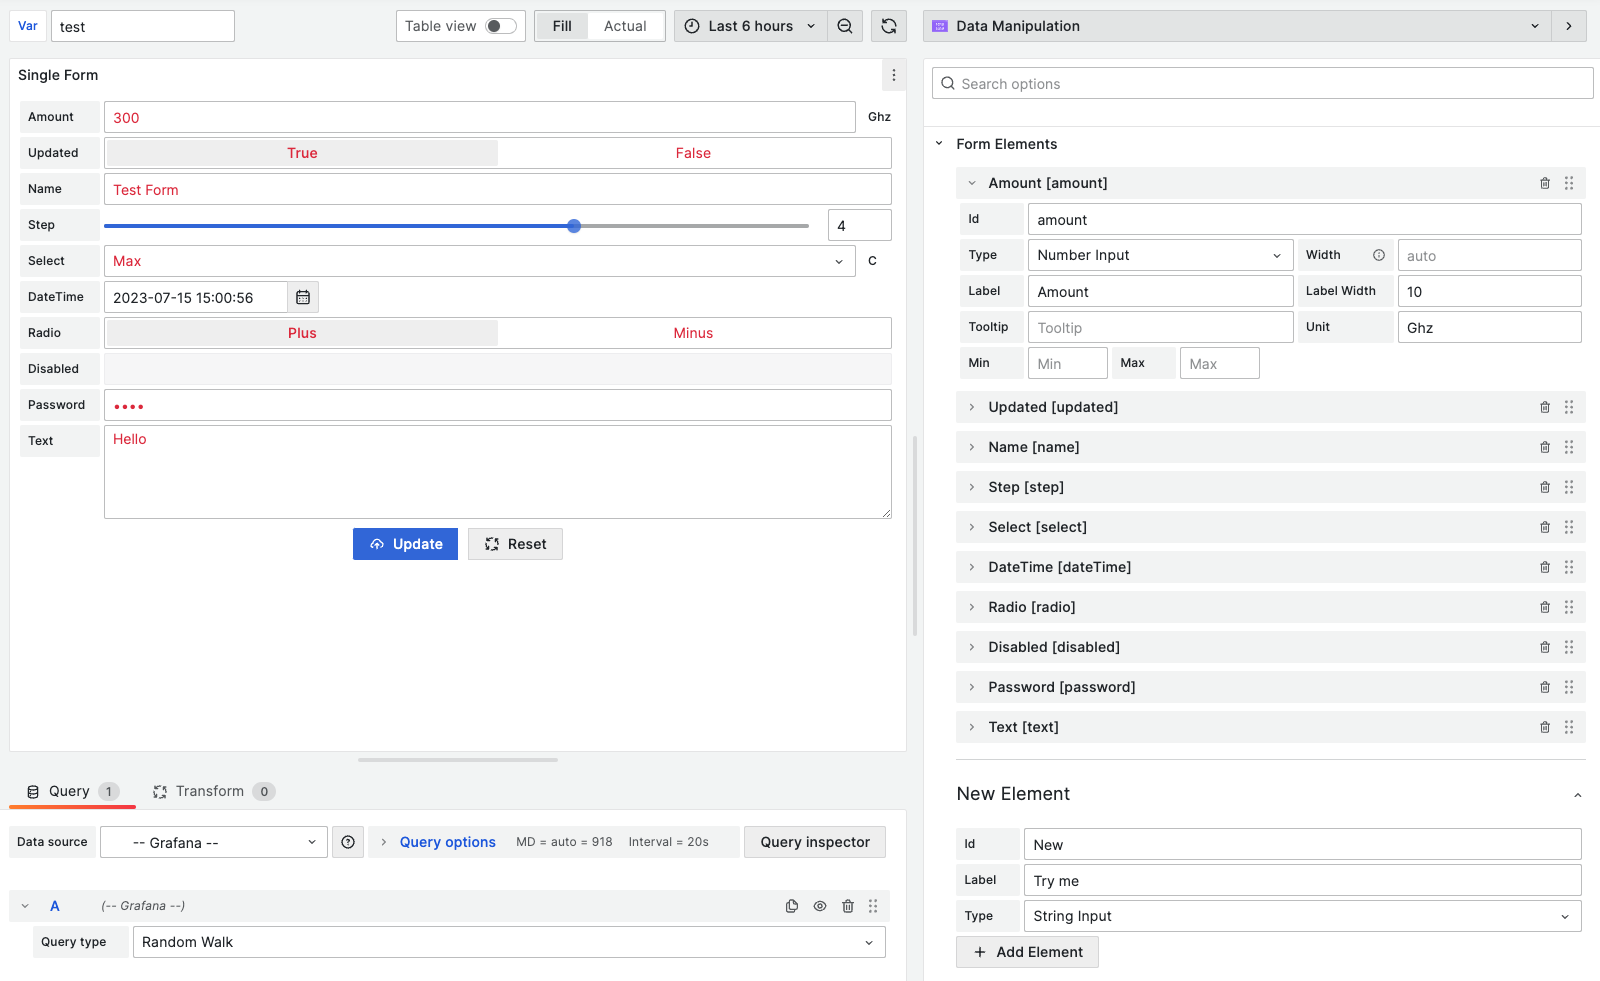
The Business Forms panel is a groundbreaking plugin for Grafana, designed to empower users by allowing direct interaction with application data and configurations within dashboards. Whether you're managing data or customizing settings, this plugin streamlines workflows with an intuitive interface.
📋 Requirements
Ensure your Grafana version meets the following requirements for compatibility with Business Forms:
- Business Forms 6.X: Grafana 11 or 12
- Business Forms 4.X, 5.X: Grafana 10.3 or 11
- Data Manipulation 3.X: Grafana 9 or 10
- Data Manipulation 2.X: Grafana 8.5 or 9
- Data Manipulation 1.X: Grafana 8
🛠️ Getting Started
Install the Business Forms panel easily via the Grafana Plugins Catalog or using the Grafana CLI.
Install via Grafana CLI
grafana cli plugins install volkovlabs-form-panel
✨ Key Features
- Customizable Forms: Create tailored forms to suit your specific needs.
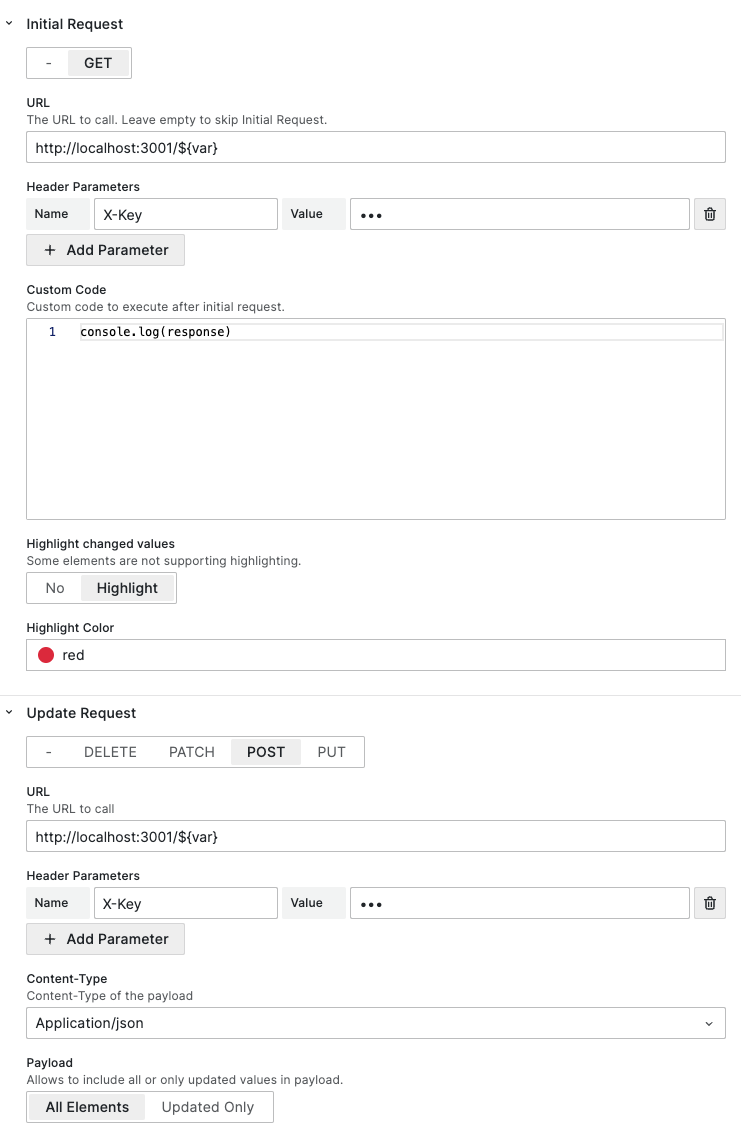
- Custom Code Support: Write custom code for initial and update requests.
- API Integration: Supports
GET,DELETE,PATCH,POST, andPUTrequests for data manipulation. - Request Headers: Add custom headers to initial and update requests.
- Flexible UI: Customize Submit/Reset buttons and form layouts.
- Sectional Layouts: Organize form elements into distinct sections.
- User Confirmation: Prompt users for confirmation before executing updates.
- Payload Control: Send all data or only updated elements in requests.
- Notifications: Display success/error messages via custom code.
- Code Suggestions: Get parameter suggestions in the built-in code editor.
📚 Documentation
Explore detailed guides and resources to maximize the potential of Business Forms:
| Section | Description |
|---|---|
| Data flow | Understand data flow and its specifics. |
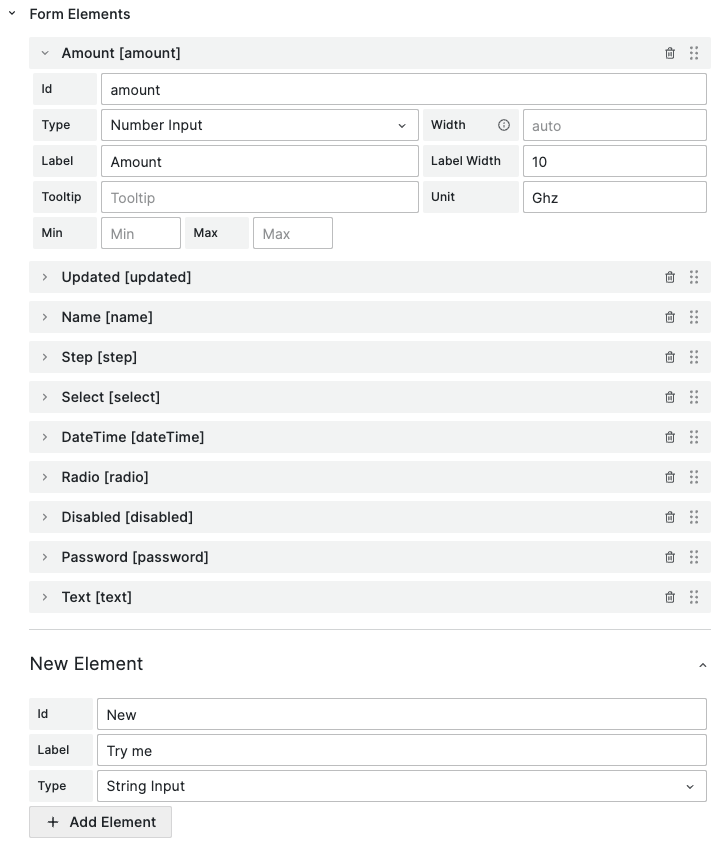
| Form elements | Learn about form element configurations. |
| REST API | Dive into REST API architecture and NGINX usage. |
| Custom code | Access plugin options, API responses, and Grafana services. |
| Features | Explore all plugin capabilities. |
| Servers | View examples of API server implementations. |
| Release notes | Stay updated with the latest features and fixes. |
📜 License
This project is licensed under the Apache License Version 2.0. See the LICENSE file for details.
Grafana Cloud Free
- Free tier: Limited to 3 users
- Paid plans: $55 / user / month above included usage
- Access to all Enterprise Plugins
- Fully managed service (not available to self-manage)
Self-hosted Grafana Enterprise
- Access to all Enterprise plugins
- All Grafana Enterprise features
- Self-manage on your own infrastructure
Install on Grafana Cloud
Plugins can be installed directly from within your Grafana instance or automated using the Cloud API or Terraform.
Learn more about plugin installationMarketplace plugins
This is a paid plugin developed by a marketplace partner. To purchase an entitlement, sign in first, then fill out the contact form.
Get this plugin
This is a paid for plugin developed by a marketplace partner. To purchase entitlement please fill out the contact us form.
What to expect:
- Grafana Labs will reach out to discuss your needs
- Payment will be taken by Grafana Labs
- Once purchased the plugin will be available for you to install (cloud) or a signed version will be provided (on-premise)
Thank you! We will be in touch.
For more information, visit the docs on plugin installation.
Installing on a local Grafana:
For local instances, plugins are installed and updated via a simple CLI command. Plugins are not updated automatically, however you will be notified when updates are available right within your Grafana.
1. Install the Panel
Use the grafana-cli tool to install Business Forms from the commandline:
grafana-cli plugins install The plugin will be installed into your grafana plugins directory; the default is /var/lib/grafana/plugins. More information on the cli tool.
Alternatively, you can manually download the .zip file for your architecture below and unpack it into your grafana plugins directory.
Alternatively, you can manually download the .zip file and unpack it into your grafana plugins directory.
2. Add the Panel to a Dashboard
Installed panels are available immediately in the Dashboards section in your Grafana main menu, and can be added like any other core panel in Grafana.
To see a list of installed panels, click the Plugins item in the main menu. Both core panels and installed panels will appear.
Changelog
All notable changes to this project will be documented in this file.
The format is based on Keep a Changelog, and this project adheres to Semantic Versioning.
[6.3.5] - 2026-06-01
Fixed
- Fixed form values lagging behind the selected variable on dashboard refresh when
Synchronize with datais enabled.
[6.3.4] - 2026-05-21
Fixed
- Fixed header parameter editor losing changes when editing name or value fields.
Security
- Patched transitive dependencies with known vulnerabilities, including a critical CVE in
protobufjs. - Added
.npmrcwithignore-scripts=trueto disable lifecycle scripts and mitigate supply-chain attack risk.
Changed
- Plugin now supports Grafana 13 and React 19 preview builds.
Project Updates
- Updated CI/CD workflows.
- Updated development tooling configuration.
- Migrated publish workflow from auto-stamping changelog to pre-flight changelog validation.
- Bumped
plugin-ci-workflowsto v8.0.0. - Bumped
vitest-coverage-report-actionto v2.12.0.
[6.3.3] - 2026-04-28
Fixed
- Fixed header parameter editor losing changes when editing name or value fields.
Security
- Patched transitive dependencies with known vulnerabilities, including a critical CVE in
protobufjs.
Changed
- Plugin now supports Grafana 13 and React 19 preview builds.
Project Updates
- Updated CI/CD workflows.
- Updated development tooling configuration.
[6.3.2] - 2026-04-06
Changed
- Updated Node.js from 20 to 24.
- Updated
@grafana/create-pluginscaffolding. - Updated
plugin-ci-workflowsfrom v6.1.1 to v7.0.0. - Updated Playwright Dockerfile and docker-compose for E2E.
- Bumped default Grafana image version.
- Cleaned up transitive dependencies.
- Updated patch/minor dependencies for Grafana, webpack, SWC, and ESLint plugins.
- Replaced deprecated
MutableRefObjectwithRefObject. - Replaced deprecated
toArraywithArray.from. - Updated server Dockerfiles to Node 24 and docker-compose-wait 2.12.1.
- Simplified docker-compose: removed redundant Grafana service variants and consolidated profiles.
- Simplified npm scripts for docker compose.
- Updated
uuidfrom v11 to v13, removed@types/uuid. - Updated
@grafana/scenesto 7.3.0,@grafana/plugin-e2eto 3.4.10,@playwright/testto 1.59.0. - Verified React 19 compatibility: no breaking API usage in source;
react/jsx-runtimealready externalized;grafanaDependencyalready>=12.3.0; CI pipeline already tests against React 19 preview image.
Fixed
- Fixed Jest setup and style assertion.
- Fixed scene context typing and legacy scenes router resolution.
- Fixed build errors in ESLint config and TypeScript.
- Fixed Docker E2E run to exit cleanly.
Added
- Added
AGENTS.mdwith build/test commands, code style guidelines, and project conventions. - Added
cspell.config.jsonfor spell checking. - Added
pull-requests: readpermission to CD workflow (required by v7.0.0). - Added PR coverage report workflow with base branch comparison.
- Added PR file changes summary workflow with categorized change list.
[6.3.0] - 2025-10-22
Project Updates
- Grafana Labs fork.
Changed
- Update race condition for initial request (#619).
[6.1.0] - 2025-08-31
Changed
- Updated ESLint configuration for improved code quality (#611).
- Updated Development Provisioning (#616).
[6.0.0] - 2025-07-21
Breaking Changes
- Now requires Grafana 11 and Grafana 12.
Added
- Added TimeZone option for Date element (#604).
Changed
- Updated to Grafana 12.0 and related dependencies (#607).
[5.1.0] - 2025-02-26
Added
- Introduced
isEscapingoption for TextArea and CodeEditor elements (#581). - Added support for streaming state for data (#577).
Changed
- Refactored form elements for better maintainability (#576).
- Updated to Grafana 11.5 and dependencies (#582).
- Enhanced release workflow to include attestation (#582).
[5.0.0] - 2024-12-23
Breaking Changes
- Dashboard variables in Show If, Disabled, and Options are now replaced automatically. The
replaceVariablesfunction is no longer required and has been removed.
Added
Changed
- Updated change value behavior for custom options (#562).
- Improved handling of new lines in Text Area and Code Editor (#563).
- Updated packages for Code Editor (#569).
- Enhanced element helpers (#570).
- Updated to Grafana 11.4.0 and dependencies (#571).
[4.9.0] - 2024-11-16
Added
- Added HTML and Markdown to supported Code Editor languages (#543).
- Introduced functionality for updating sections dynamically (#542).
Changed
- Removed
DatasourceResponseError, moved to external Components (#535). - Updated options to use datasource ID instead of name (#539).
- Improved E2E tests (#538).
- Updated refresh function in the Update Request (#547).
- Removed default payload from Update Request (#550).
[4.8.0] - 2024-10-25
Added
Changed
- Updated refresh mechanism for dashboard scene (#522).
- Enhanced Text Area and Code Editor elements to escape multi-lines (#520).
- Updated refresh for dashboard scene using
useDashboardRefreshhook (#528). - Updated to Grafana 11.3.0 and dependencies (#531).
[4.7.0] - 2024-10-08
Added
- Added custom input for Select and Multi-Select elements (#507).
- Introduced support for frames in initial fields (#508).
Changed
- Updated Autosize Code Editor toolbar (#506).
- Improved behavior for disabled Text Area element (#514).
[4.6.0] - 2024-09-28
Added
- Added Wrap button in the Code Editor (#491).
- Introduced Label Background and Label Color for Button element (#502).
Changed
- Updated initial values for elements from data source (#490).
- Improved loading bar for Initial Request (#492).
[4.5.0] - 2024-09-06
Added
- Added support for dashboard variables in button titles (#479).
- Introduced variable support in sections and labels (#485).
Changed
- Updated date and time input timezone handling (#452).
- Improved suggestions position in Code elements (#483).
[4.4.0] - 2024-08-29
Added
- Introduced Expandable Editors (#472).
Changed
- Updated Pre-Selection for multi-selection elements (#474).
- Improved data source query display error handling (#477).
[4.3.1] - 2024-08-16
Fixed
- Fixed migration helper for undefined nested object properties (#468).
[4.3.0] - 2024-08-12
Added
Changed
- Updated payload options migration (#464).
[4.2.0] - 2024-07-18
Changed
- Updated Docker Compose and E2E pipeline (#446, #447).
- Improved unit tests (#447).
- Updated Business Forms tutorial (#451).
- Enhanced logic for comparing values with initial values (#454).
- Updated position of Query fields for initial values (#455).
[4.1.0] - 2024-07-09
Changed
- Updated context parameters migration (#433).
- Enhanced provisioning files (#433).
- Updated Checkbox list with custom options (#435).
- Improved code defaults to use context properties (#438).
- Updated E2E workflow using Docker (#441).
[4.0.0] - 2024-07-01
Breaking Changes
- Now requires Grafana 10 and Grafana 11.
- Data Source requests updated to use Query Editor.
- Removed non-context code parameters. Please update parameters to use
context.
Migration Guide
data→context.panel.dataelements→context.panel.elementsinitial→context.panel.initialinitialRequest→context.panel.initialRequestlocationService→context.grafana.locationServicenotifyError→context.grafana.notifyErrornotifySuccess→context.grafana.notifySuccessnotifyWarning→context.grafana.notifyWarningonChange→context.panel.onChangeonOptionsChange→context.panel.onOptionsChangeoptions→context.panel.optionsreplaceVariables→context.grafana.replaceVariablesresponse→context.panel.responsesetInitial→context.panel.setInitialtemplateService→context.grafana.templateServicetoDataQueryResponse→context.utils.toDataQueryResponse
Added
- Added support for frontend data sources (#361).
- Introduced custom color/background color for elements (#386).
- Added collapsible sections (#409).
Changed
- Renamed to Business Forms Panel (#361).
- Updated selected type for new options (#402).
- Prepared for Grafana 11 compatibility (#399).
- Updated Reset button handler (#422).
- Enhanced Confirmation Window (#420).
- Improved error handling in code editors for
showIf,disableIf, andgetOptions(#410). - Updated description for Get Options Code (#404).
- Updated to Grafana 11.1 and dependencies (#426).
- Enhanced Date Time query field (#429).
[3.8.0] - 2024-05-30
Added
- Introduced Checkbox List element (#382).
- Added syntax support in Code Editor (#383).
- Implemented plugin E2E tests, removed Cypress (#390).
- Added server-based form elements example (#392).
- Introduced input type time (#385).
- Added form validation provisioning dashboard (#411).
Changed
[3.7.0] - 2024-03-10
Breaking Changes
- Now requires Grafana 9.2 and Grafana 10.
Added
- Added update enabled option and variables examples (#356).
- Introduced files upload examples (#357).
- Added code parameters with builder and initial request to element value changed code (#358).
- Introduced ability to disable columns in confirmation modal (#360).
- Added multiple files option (#375).
Changed
- Updated dependencies and Actions (#368).
- Added skipping elements hidden using Show If from update payload (#369).
[3.6.0] - 2023-01-10
Added
- Introduced backend service to custom code (#331).
- Added support for file base64 encoding in payload (#331).
- Introduced context parameter to Payload (#331).
Fixed
- Fixed element custom options source (#334).
[3.5.0] - 2023-01-04
Added
- Introduced
disableIfcode (#321). - Added code options source for select element (#323).
- Introduced value changed code (#324).
- Added suggestions for code editors (#327).
- Introduced reset button confirmation (#328).
Changed
[3.4.0] - 2023-12-14
Added
- Added ability to disable panel syncing (#298).
- Introduced EventBus and AppEvents to Context (#307).
- Added options migration (#315).
Changed
- Updated ESLint configuration and refactored code (#299).
- Updated Collapse from
@volkovlabs/components(#299). - Added replacing variables in Payload functions (#309).
- Updated to Grafana 10.2.2 and Volkov Labs packages (#313).
Fixed
- Fixed draggable control to support upcoming Grafana changes (#314).
[3.3.0] - 2023-11-21
Added
- Introduced Disabled Text Area element type (#243).
- Added Confirmation Window options (#242).
- Introduced Context object to custom code (#255).
- Added Select Options From Query (#254).
- Introduced NumberInput component allowing decimals (#291).
- Added Autosize Code Editor (#295).
- Introduced Data Source option for Reset button (#296).
- Added Link Element (#297).
Changed
- Updated to Plugin Tools 2.1.1 (#292).
- Used Grafana Access Policy to sign plugin (#292).
- Updated to Grafana 10.2.1 (#292).
- Updated ESLint configuration (#294).
Fixed
- Fixed ability to enter zero value in number field (#288).
[3.2.1] - 2023-09-07
Added
- Added backward compatibility for option ID (#244).
[3.2.0] - 2023-09-06
Added
- Introduced min and max date for DateTime element (#225).
- Added mapping Data Source values to elements (#224).
- Introduced clearing errors before initial and update requests (#232).
- Added URL encode to variables (#231).
- Introduced Query Field Picker for Initial Request (#227).
- Added File element type for File Upload (#229).
- Introduced loading states for Initial, Update, and Reset button actions (#234).
- Added support for asynchronous custom code (#234).
- Introduced icons for radio and select options (#238).
Changed
- Updated element
Show Ifto support variables (#230). - Allowed empty section name (#228).
- Added converting option value to string and number based on type (#233).
- Updated Query and Data Source initial request (#237).
[3.1.0] - 2023-08-13
Added
- Introduced
onChangeto update elements in local state within custom code (#214). - Added Multi-Select element (#217).
- Introduced conditional element visibility (#219).
- Added custom payload code editor (#220).
- Introduced custom reset code editor (#221).
- Added Data Source request (#222).
Changed
[3.0.0] - 2023-07-15
Breaking Changes
- Now requires Grafana 9 and Grafana 10.
- Form Elements are kept in local state and not saved in the dashboard by default.
- Local states and elements refactoring may introduce breaking changes. Please test before using in Production.
Added
- Introduced hidden option to String element (#171).
- Added E2E Cypress testing (#180).
- Introduced
notifyWarning()function (#201). - Added drag and drop for elements editor (#202).
- Introduced vertical layout orientation (#206).
Changed
- Updated Documentation for API Servers (#149).
- Updated to Grafana 10.0.0 (#165, #172, #184, #200).
- Increased Test Coverage and updated Test library (#181, #183, #185).
- Updated Form Elements to delay save changes with auto-save (#186).
- Migrated to Plugin Tools 1.5.2 (#187, #192).
- Updated to Node 18 (#188).
- Updated constants and E2E tests (#190).
- Updated Form elements to use local state (#191).
- Removed Grafana 8.5 support (#203).
- Added running initial request on initial updates (#205).
[2.8.0] - 2023-03-16
Added
- Introduced String, Number Type for Select and Radio options (#120).
- Added lookup options for Disabled element (#121).
- Introduced Server API with MySQL for Feedback Dashboard (#125).
- Added option for DELETE request (#130).
- Introduced "Buttons only" Layout to do GET/POST/DELETE requests (#131).
- Added NoPadding to remove extra padding around and make it configurable (#146).
Changed
- Updated to Grafana 9.3.1 (#129).
- Updated to Grafana 9.4.3 (#146).
- Updated README and moved Documentation to docs.volkovlabs.io (#132).
- Updated README and Documentation (#134, #147).
- Refactored API Servers (#128).
- Updated CI and Release workflows (#145).
Fixed
- Fixed Password and Boolean elements confirmation (#120).
[2.7.0] - 2022-11-10
Added
- Introduced status notification after form submission (#98).
- Added Monaco Code Editor suggestions for available parameters (#88).
- Introduced initial values parameter to Update Request parameters (#117).
Changed
- Updated to Grafana 9.2.2 (#113).
- Updated CI to upload signed artifacts (#116).
- Allowed sending all or updated-only values in Payload (#116).
[2.6.0] - 2022-10-23
Added
- Introduced Compatibility Check Workflow (#92).
- Added custom code to update variable after update request (#106).
- Introduced Number Input and Slider min, max validation (#95).
- Added initialization of element value from a Data Source query (#105).
Changed
Fixed
- Fixed initial GET request date time formatting (#99).
[2.5.0] - 2022-09-10
Added
- Introduced Request Header check (#85).
- Added exposed
initialRequest()in Custom Code to reload panel (#89).
Changed
[2.4.0] - 2022-08-31
Added
- Introduced variables in URL to call from form elements (#78).
- Added Deno Deploy Playground server and dashboard (#80).
- Introduced "How to Manipulate Data using Grafana dashboard" video in README (#80).
Changed
- Updated to Grafana 9.1.1 (#72).
- Explained how to use Dashboard Variables in README (#73).
- Added
onOptionsChangein examples to update the panel (#75). - Added Custom Update Request to README (#79).
- Showed Title instead of Id in the Confirmation Panel (#81).
- Avoided showing confirmation for disabled elements (#77).
- Improved Test Coverage (#21).
[2.3.0] - 2022-08-11
Breaking Changes
- Signed as Community Plugin.
Changed
[2.2.0] - 2022-08-09
Added
- Introduced ability to get Elements Initial Value and Configuration from Data Source (#22).
Changed
Fixed
- Fixed Number Slider not updated properly (#18).
[2.1.0] - 2022-07-17
Added
- Introduced Automatic Code Editor Formatting (#59).
Changed
- Rebuilt based on 9.0.3 (#58).
- Explained Custom code in README (#60).
- Updated YouTube link with tutorial in README (#61).
[2.0.0] - 2022-06-17
Breaking Changes
- Now requires Grafana 8.3+ and 9.0+.
Changed
- Rebuilt based on 9.0.0 (#53).
[1.4.0] - 2022-05-30
Added
Changed
- Allowed updating Element Width (#50).
[1.3.0] - 2022-05-22
Added
- Introduced layout to have sections for Form Fields (#47).
- Added None Request for Initial and Update requests (#48).
- Introduced Code Editor Element for Configuration Forms (#23).
Changed
Fixed
- Fixed changing colors on Submit not working properly (#43).
[1.2.0] - 2022-05-19
Added
- Introduced Label Width and Tooltip (#39).
- Added Server API with Postgres for Feedback Dashboard (#36).
- Introduced Input Parameters to Form Elements (#41).
[1.1.0] - 2022-05-12
Added
- Introduced Disabled Element (#24).
- Added ability to move elements up and down (#19).
- Introduced Split Disabled layout for Input/Output (#27).
- Added Interpolate Variables (#28).
- Introduced Min and Max for Numbers (#29).
- Added Unit Label (#31).
- Introduced Header Parameters (#32).
- Added Password Input (#33).
- Introduced Subscription to Refresh Events (#30).
[1.0.0] - 2022-05-11
Added
- Initial release based on the Volkov Labs Panel template 1.5.0.