Plugins 〉Business Charts


Business Charts
Business Charts for Grafana
![]()
![]()

This project was originally contributed by Volkov Labs - thanks for all your great work!
We have republished under the same plugin ID, keeping the community signature. This means you can simply update your plugin version. A new ID would have required manual updates to your dashboards. For additional information on the changes, see the Notices.
This project is currently maintained by Grafana Labs. We welcome pull requests and will review them on a best-effort basis. If you're interested in taking on this project long-term, contact integrations@grafana.com. We're eager to work with new maintainers and eventually hand over the project.
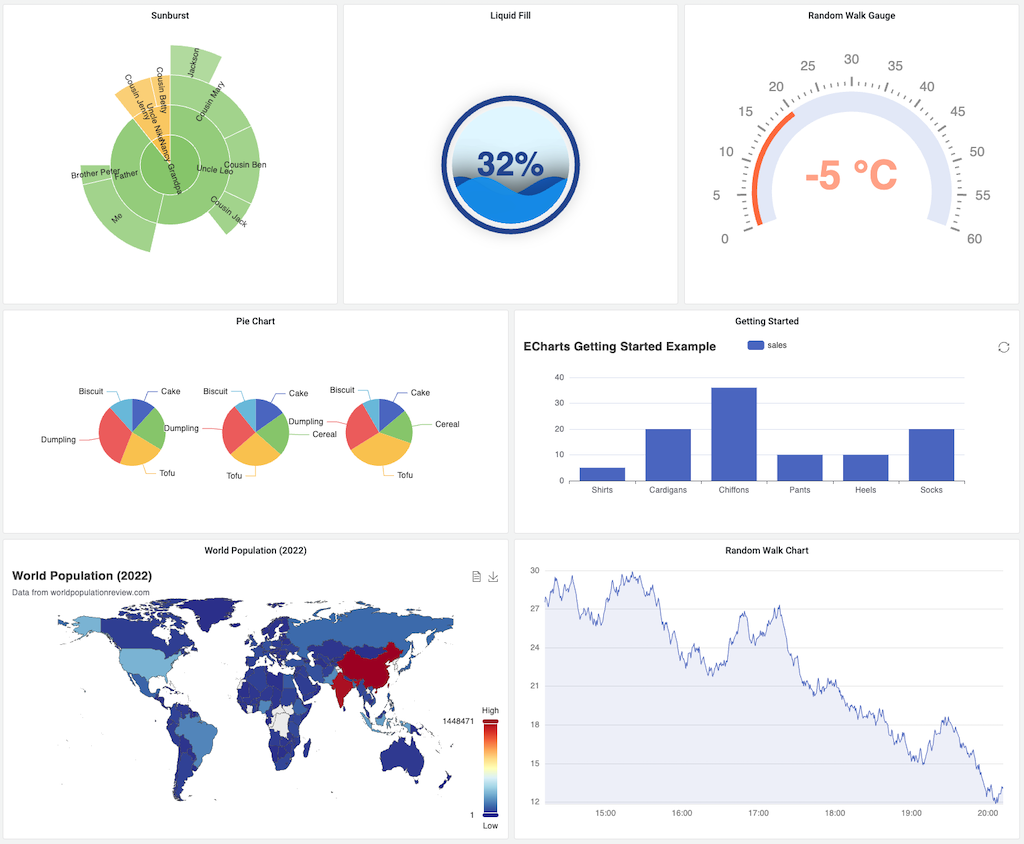
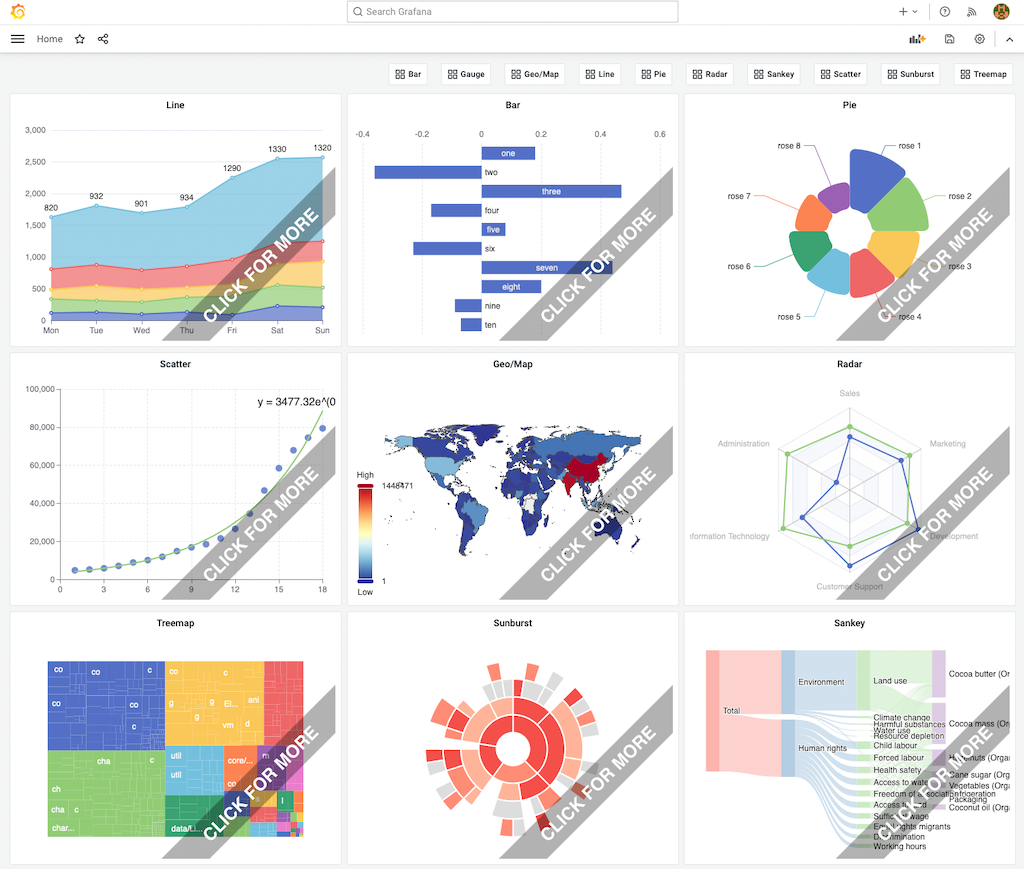
Business Charts is a powerful Grafana plugin that integrates the Apache ECharts library to create dynamic, interactive visualizations for your dashboards. Built with pure JavaScript and lightweight rendering via zrender, this plugin offers a wide variety of chart types and advanced statistical tools to enhance business data analysis.
🚀 Key Features
- Monaco Code Editor: Customize charts using JavaScript for Grafana data frames, JSON for configurations, and theme adjustments.
- Code Assistance: Enjoy autocomplete for parameters and variables.
- Rendering Options: Choose between SVG and Canvas renderers for optimal performance.
- Interactivity: Leverage variables and locationService for dynamic visualizations.
- Maps: Includes USA and World GeoJSON maps, with support for dynamically loading additional maps.
- External Map APIs: Integrate with Baidu, Gaode, and Google Maps (API key required).
- Extensions:
- ECharts-GL: 3D plots, globe visualizations, and WebGL acceleration.
- ecStat: Advanced statistical and data mining tools.
- Liquid Fill Chart: Visualize percentages with fluid animations.
- Wordcloud: Create engaging word cloud charts.
- Real-Time Updates: Support for streaming data sources and Grafana Live.
- Theming: Seamlessly adapts to Grafana’s light and dark themes.
- ECharts Version: Powered by Apache ECharts 5.5.1.
📋 Requirements
| Plugin Version | Compatible Grafana Versions |
|---|---|
| Business Charts 7.x | Grafana 11 or 12 |
| Business Charts 6.x | Grafana 10 or 11 |
| Apache ECharts 5.x | Grafana 9 or 10 |
| Apache ECharts 3.x/4.x | Grafana 8.5 or 9 |
🛠️ Installation
Install the Business Charts plugin via the Grafana Plugins Catalog or using the Grafana CLI:
grafana-cli plugins install volkovlabs-echarts-panel
After installation, restart Grafana and add the Business Charts panel to your dashboard.
📚 Documentation
Dive into detailed guides to make the most of Business Charts:
| Section | Description |
|---|---|
| Charts Function | Configure core Apache ECharts functions. |
| Visual Editor | Create charts effortlessly with the Visual Editor. |
| Examples | Start with ready-made Apache ECharts examples. |
| Features | Explore all plugin capabilities. |
| Maps | Learn to work with various map types. |
| Release Notes | Stay updated with the latest features and fixes. |
🙏 Acknowledgments
Apache ECharts, ECharts, Apache, the Apache feather logo, and the Apache ECharts project logo are registered trademarks or trademarks of The Apache Software Foundation.
📜 License
This project is licensed under the Apache License 2.0.
Grafana Cloud Free
- Free tier: Limited to 3 users
- Paid plans: $55 / user / month above included usage
- Access to all Enterprise Plugins
- Fully managed service (not available to self-manage)
Self-hosted Grafana Enterprise
- Access to all Enterprise plugins
- All Grafana Enterprise features
- Self-manage on your own infrastructure
Install on Grafana Cloud
Plugins can be installed directly from within your Grafana instance or automated using the Cloud API or Terraform.
Learn more about plugin installationMarketplace plugins
This is a paid plugin developed by a marketplace partner. To purchase an entitlement, sign in first, then fill out the contact form.
Get this plugin
This is a paid for plugin developed by a marketplace partner. To purchase entitlement please fill out the contact us form.
What to expect:
- Grafana Labs will reach out to discuss your needs
- Payment will be taken by Grafana Labs
- Once purchased the plugin will be available for you to install (cloud) or a signed version will be provided (on-premise)
Thank you! We will be in touch.
For more information, visit the docs on plugin installation.
Installing on a local Grafana:
For local instances, plugins are installed and updated via a simple CLI command. Plugins are not updated automatically, however you will be notified when updates are available right within your Grafana.
1. Install the Panel
Use the grafana-cli tool to install Business Charts from the commandline:
grafana-cli plugins install The plugin will be installed into your grafana plugins directory; the default is /var/lib/grafana/plugins. More information on the cli tool.
Alternatively, you can manually download the .zip file for your architecture below and unpack it into your grafana plugins directory.
Alternatively, you can manually download the .zip file and unpack it into your grafana plugins directory.
2. Add the Panel to a Dashboard
Installed panels are available immediately in the Dashboards section in your Grafana main menu, and can be added like any other core panel in Grafana.
To see a list of installed panels, click the Plugins item in the main menu. Both core panels and installed panels will appear.
Changelog
All notable changes to Business Charts will be documented in this file. This project adheres to Semantic Versioning.
[7.2.5] - 2026-05-21
Project Updates
- Updated CI/CD workflows.
- Added pull request coverage and file-changes summary reports.
- Updated development documentation.
- Updated development scripts.
- Added
.npmrcwithignore-scripts=trueto disable lifecycle scripts and mitigate supply-chain attack risk. - Removed
pr-files.ymlworkflow; GitHub's native Files changed tab supersedes it.
[7.2.0] - 2025-10-22
Project Updates
- Grafana Labs fork.
[7.1.0] - 2025-08-31
Enhancements
[7.0.0] - 2025-07-21
Breaking Changes
- Now requires Grafana 11 or Grafana 12.
Enhancements
- Removed
@volkovlabs/grafana-utilsdependency (#362). - Upgraded to Grafana 12.0 and updated dependencies (#371).
[6.6.0] - 2025-02-20
Enhancements
- Added end-to-end (E2E) tests (#349).
- Updated packages for Code Editor (#352).
- Upgraded to Apache ECharts 5.6.0 and updated dependencies (#355).
- Upgraded to Grafana 11.5 and updated dependencies (#361).
- Enhanced release workflow to include attestation (#361).
[6.5.0] - 2024-10-25
Enhancements
- Improved autosize functionality in Code Editor toolbar (#341).
- Updated refresh handling for dashboard scenes (#346).
- Upgraded to Grafana 11.3.0 and updated dependencies (#346).
[6.4.1] - 2024-09-16
Enhancements
[6.4.0] - 2024-09-11
Enhancements
- Added Boxplot chart to Visual Editor (#327).
- Upgraded to Grafana 11.2 and updated dependencies (#330).
- Added Scatter chart to Visual Editor and restricted selection to supported chart types (#332).
- Enabled importing of promise-based libraries (#333).
- Improved Code Editor toolbar (#334).
[6.3.0] - 2024-08-26
Enhancements
- Introduced Visual Editor for Bar and Sunburst charts (#322).
- Added expandable editors (#324).
- Updated example dashboards (#325).
[6.2.0] - 2024-08-01
Enhancements
- Upgraded to Apache ECharts 5.5.1 (#309).
- Improved E2E workflow using Docker (#310).
- Updated migration for context parameters (#317).
- Added Radar chart to Visual Editor (#316).
[6.1.0] - 2024-05-26
Enhancements
- Added plugin E2E tests and removed Cypress (#281, #283).
- Updated context parameters in example dashboards (#282).
- Added Business Charts video tutorial (#291).
- Enhanced provisioning for events (#289).
- Improved panel options (#289).
- Enhanced code suggestions in editor (#293).
- Upgraded to Grafana 11.0 and updated dependencies (#294).
[6.0.0] - 2024-03-24
Breaking Changes
- Now requires Grafana 10 or Grafana 11.
- Removed non-context code parameters; update scripts to use
context(see migration guide below).
Migration Guide
Update your code parameters as follows:
data→context.panel.datatheme→context.grafana.themeechartsInstance→context.panel.chartecharts→context.echartsecStat→context.ecStatreplaceVariables→context.grafana.replaceVariableseventBus→context.grafana.eventBuslocationService→context.grafana.locationServicenotifySuccess→context.grafana.notifySuccessnotifyError→context.grafana.notifyError
Enhancements
- Renamed plugin to "Business Charts" (#268).
- Added Apache acknowledgment and updated description (#268).
- Upgraded to Grafana 10.4.1 (#270).
- Removed deprecated
ArrayVectorfor Grafana 11 compatibility (#272). - Addressed Apache ECharts deprecation warnings (#272).
[5.3.0] - 2024-03-06
Enhancements
- Upgraded to Apache ECharts 5.5.0 (#257).
- Enhanced code parameters with Code Parameters Builder (#261).
- Improved autosize functionality in Code Editor (#263).
[5.2.0] - 2024-02-15
Breaking Changes
- Now requires Grafana 9.2 or Grafana 10.
Enhancements
- Updated README and documentation (#214).
- Added Visual Editor for data source integration (#211).
- Updated ESLint configuration and refactored code (#237).
- Updated dependencies and GitHub Actions (#238).
- Added
contextparameter in non-visual mode (#245). - Implemented refresh function via Application Event Bus (#247).
- Prevented selection of already chosen fields (#251).
- Updated
echarts.volkovlabs.ioto leverage Visual Editor and data sources (#248). - Improved draggable handler in Visual Editor (#256).
[5.1.0] - 2023-08-11
Enhancements
- Upgraded to Grafana 10.0.3 (#206).
Bug Fixes
- Fixed memory leak caused by resubscribing to restore events (#208).
[5.0.0] - 2023-07-19
Breaking Changes
- Now requires Grafana 9 or Grafana 10.
Enhancements
- Updated documentation (#182).
- Updated examples for Grafana 10 (#190).
- Added
Result v2with unsubscribe function (#188). - Enhanced streaming to redraw charts (#188).
- Upgraded to Grafana 10.0.0 (#191).
- Improved README and panel options (#192).
- Removed Grafana 8.5 support (#193).
- Upgraded to Grafana 10.0.2 dependencies (#195).
- Updated ESLint configuration (#196).
- Added Wordcloud extension (#198).
- Upgraded to Apache ECharts 5.4.3 (#199).
[4.5.0] - 2023-06-03
Enhancements
- Migrated to Plugin Tools 1.5.2 (#171, #176).
- Upgraded to Node 18 and npm (#172, #173).
- Added alert for theme parsing errors (#175).
- Updated default function to support Grafana 10 (#178).
- Tested compatibility with Grafana 10 Preview (#179).
[4.4.0] - 2023-05-25
Enhancements
- Increased test coverage and updated testing library (#163).
- Upgraded to Grafana 9.5.2 (#164).
- Updated Google Maps extension to 1.6.0 (#164).
- Added E2E Cypress testing (#165).
- Introduced Theme Editor for custom themes (#167).
- Updated documentation (#166, #168).
[4.3.1] - 2023-04-21
Breaking Changes
- Removed
getDataSourceSrvparameter for security reasons (#156).
[4.3.0] - 2023-04-16
Enhancements
- Upgraded to Grafana 9.4.7 (#146).
- Added
getDataSourceSrvparameter for data source access (#146). - Upgraded to Apache ECharts 5.4.2 (#147).
- Updated USA and World GeoJSON for GeoMap (#154).
- Added support for Alert State and Annotations (#155).
[4.2.0] - 2023-03-04
Enhancements
- Added
EventBusparameter for event publishing (#122). - Upgraded to Grafana 9.3.6 (#132).
- Updated CI and release workflows (#134).
- Removed extra padding with
NoPadding(#138). - Set default background color to transparent (#139).
- Added "Magic (JavaScript) Trio" tutorial (#141).
- Upgraded to Grafana 9.4.3 (#142).
[4.1.0] - 2023-01-12
Enhancements
- Synchronized README with documentation (#111).
- Added streaming support for WebSockets and Grafana Live (#113).
- Moved InfluxDB example to a guest blog post (#115).
- Updated documentation and tutorials in README (#116).
- Added Data Zoom to default Line example (#117).
[4.0.0] - 2022-12-20
Breaking Changes
- World and USA GeoJSON maps are no longer loaded by default; select
JSONin the Maps option.
Enhancements
- Updated ECharts examples on
https://echarts.volkovlabs.io(#103). - Added Calendar examples on
https://echarts.volkovlabs.io(#105). - Updated README and moved documentation to
docs.volkovlabs.io(#107).
Bug Fixes
- Fixed JavaScript code in documentation (#102).
[3.8.0] - 2022-12-10
Enhancements
- Updated documentation for event handling (#80).
- Added Histograms, Clustering, and Regression tutorial (#83).
- Added provisioning dashboards for ECharts examples on
https://echarts.volkovlabs.io(#91). - Added Gaode map support (#95).
- Upgraded to Grafana 9.3.1 (#97).
- Added Google Maps support (#98).
- Refactored map support (#99).
- Upgraded to Apache ECharts 5.4.1 (#101).
Bug Fixes
- Fixed disabled format options (#88).
[3.7.0] - 2022-11-16
Enhancements
- Restricted URL loading for Baidu maps (#76).
[3.6.0] - 2022-11-13
Enhancements
- Updated CI to Node 16 and synced with release workflow (#65).
- Upgraded to Grafana 9.2.2 (#66).
- Updated YouTube thumbnails (#66).
- Updated CI to upload signed artifacts (#68).
- Added Statistics tools (Regression, Clustering, etc.) (#69).
- Added tutorial for reacting to mouse events (#71).
- Added Monaco Code Editor suggestions for available parameters (#32).
- Improved test coverage (#8).
- Added status notifications for event handling (#74).
- Added Baidu map support (#64).
- Added tutorial on loading and using Baidu maps (#75).
[3.5.0] - 2022-10-04
Enhancements
- Upgraded to Apache ECharts 5.4.0 (#52).
- Added Stacked Bar Graph (InfluxDB) example (#55).
- Added examples to README and updated links in
plugin.json(#56).
[3.4.0] - 2022-09-21
Enhancements
- Upgraded to Grafana 9.1.0 (#37).
- Added YouTube tutorial for PNG/SVG images (#38).
- Explained dashboard variable access in README (#39).
- Upgraded to Grafana 9.1.4 (#44).
- Added Grafana Variables video (#45).
- Added data source instructions to README (#46).
- Added Compatibility Check workflow (#49).
- Upgraded to Grafana 9.1.6 (#50).
- Added ECharts-GL extension for 3D plots, globe visualization, and WebGL acceleration (#51).
[3.3.0] - 2022-08-12
Breaking Changes
- Signed as a Community Plugin.
Enhancements
- Updated for inclusion in the Grafana Marketplace (#35).
[3.2.0] - 2022-08-09
Enhancements
[3.1.0] - 2022-07-11
Enhancements
- Added
setOption()description in README and options (#12). - Fixed missing Maps JSON files (#14).
- Registered USA and World maps (#20).
- Added auto-formatting (#21).
- Rebuilt using Grafana 9.0.2 (#22).
- Added variables support (
replaceVariables) in Code Editor (#9). - Added
locationServiceparameter (#24). - Added Liquid Fill plugin (#25).
Bug Fixes
- Fixed chart destruction on reset zoom (#13).
[3.0.0] - 2022-06-19
Breaking Changes
- Now requires Grafana 8.5+ or 9.0+.
- Switched to Monaco Code Editor from CodeMirror.
- Upgraded to Apache ECharts 5.3.3.
- Removed outdated ECharts extensions (
echarts-wordcloud,echarts-liquidfill,echarts-gl).
Enhancements
- Initial release based on
bilibala-echarts-panel2.2.4. - Updated using Volkov Labs Panel Template 2.0.0.
- Refactored plugin (#2).
- Replaced CodeMirror with Monaco Code Editor (#3).
- Refactored panel and updated plugin files (#4).
- Updated provisioning, screenshot, and removed Follow Theme (#5).
- Added SVG and Canvas renderers (#6).