Plugins 〉VictoriaMetrics


VictoriaMetrics
VictoriaMetrics datasource for Grafana
The VictoriaMetrics Grafana plugin allows Grafana to query, visualize, and interact with VictoriaMetrics, a high-performance metrics storage and processing system.
Capabilities
- Use MetricsQL to query metrics in Grafana.
- Use Explore mode with Grafana.
- Build dashboards and setup alerts.
- Use Ad Hoc filters.
- Template queries and expressions.
- Get insights about query execution bottlenecks via tracing.
- Automatically format queries via
Prettifybutton.
Try it at VictoriaMetrics playground!
Installation
For detailed instructions on how to install the plugin on Grafana Cloud or locally, please checkout the Plugin installation docs. For installation options in Docker or Kubernetes refer to these docs.
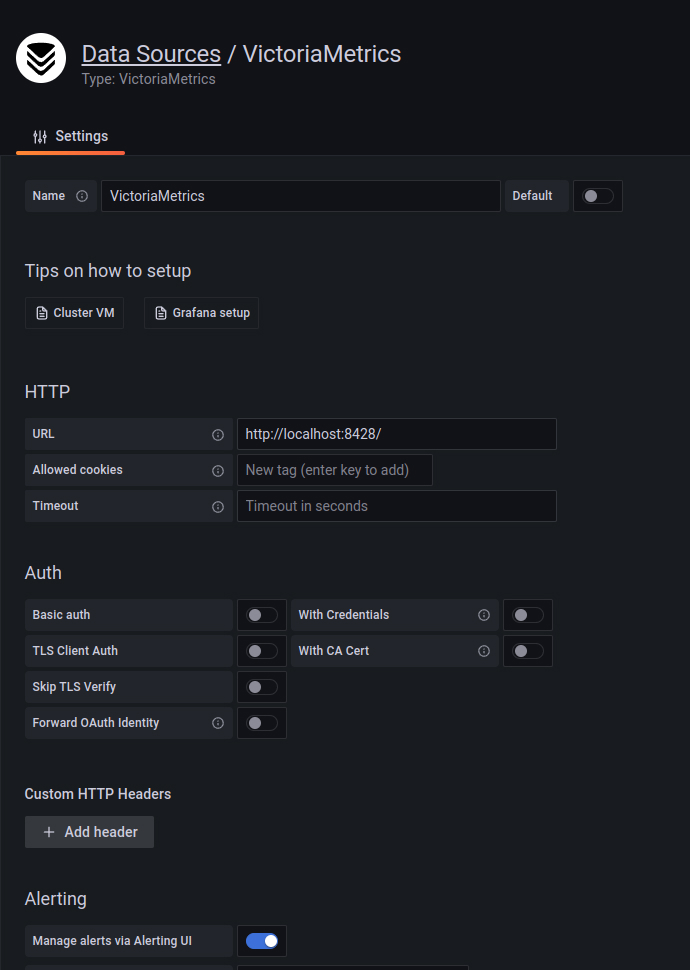
Manual configuration via UI
Once the plugin is installed on your Grafana instance, follow these instructions to add a new VictoriaMetrics data source, and enter configuration options.
Configuration via file
Provision of Grafana plugin requires to create datasource config file:
apiVersion: 1
datasources:
- name: VictoriaMetrics
type: victoriametrics-metrics-datasource
access: proxy
url: http://victoriametrics:8428
isDefault: true
- name: VictoriaMetrics - cluster
type: victoriametrics-metrics-datasource
access: proxy
url: http://vmselect:8481/select/0/prometheus
isDefault: false
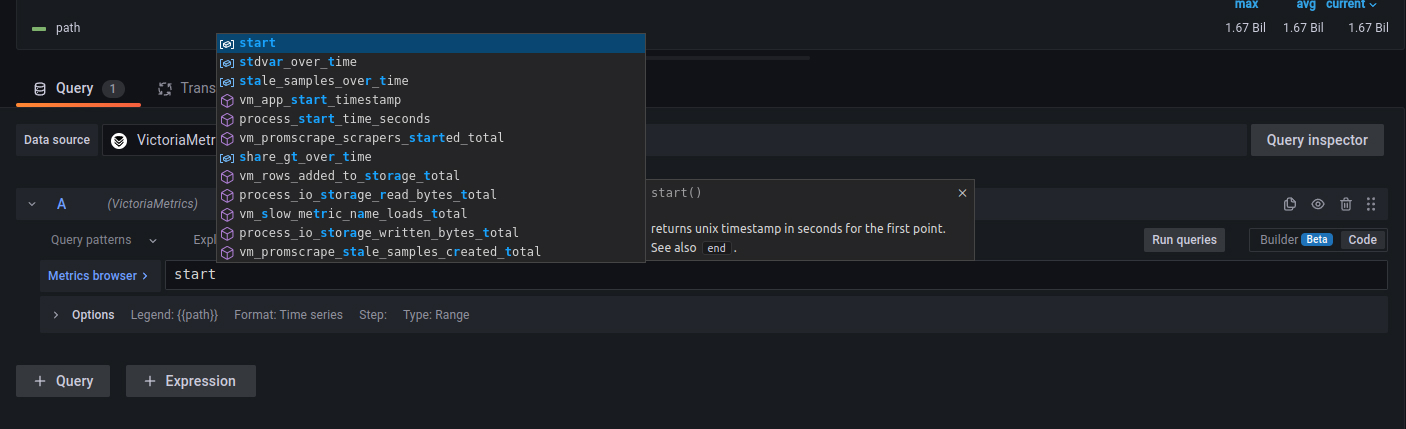
Building queries
VictoriaMetrics query language is MetricsQL - query language inspired by PromQL. MetricsQL is backwards-compatible with PromQL, so Grafana dashboards backed by Prometheus datasource should work the same after switching from Prometheus to VictoriaMetrics. However, there are some intentional differences between these two languages.
Queries can be built using raw MetricsQL or via QueryBuilder. Overall, dashboarding experience is the same as with Prometheus datasource.
See panels examples at VictoriaMetrics playground.
How to use WITH templates
The WITH templates feature simplifies the construction and management of complex queries. You can try this feature in the WITH templates playground.
The "WITH templates" section allows you to create expressions with templates that can be used in dashboards.
WITH expressions are stored in the datasource object. If the dashboard gets exported, the associated WITH templates will not be included in the resulting JSON (due to technical limitations) and need to be migrated separately.
Defining WITH Expressions
- Navigate to the dashboard where you want to add a template.
Note: templates are available within the dashboard scope. - Click the
WITH templatesbutton. - Enter the expression in the input field. Once done, press the
Savebutton to apply the changes. For example:
commonFilters = {instance=~"$node:$port",job=~"$job"},
# cpuCount is the number of CPUs on the node
cpuCount = count(count(node_cpu_seconds_total{commonFilters}) by (cpu)),
# cpuIdle is the sum of idle CPU cores
cpuIdle = sum(rate(node_cpu_seconds_total{mode=‘idle’,commonFilters}[5m]))
You can specify a comment before the variable and use markdown in it. The comment will be displayed as a hint during auto-completion. The comment can span multiple lines.
Using WITH Expressions
After saving the template, you can enter it into the query editor field:
((cpuCount - cpuIdle) * 100) / cpuCount
Thus, the entire query will look as follows:
WITH (
 commonFilters = {instance=~"$node:$port",job=~"$job"},
 cpuCount = count(count(node_cpu_seconds_total{commonFilters}) by (cpu)),
 cpuIdle = sum(rate(node_cpu_seconds_total{mode='idle',commonFilters}[5m]))
)
((cpuCount - cpuIdle) * 100) / cpuCount
To view the raw query in the interface, enable the Raw toggle.
Correlations
Signals can be correlated together if they share the same list of attributes, so they can uniquely identify the same system or event. Grafana provides various interfaces for the correlations feature for interactive links between visualizations.
Trace to metrics
Will be supported since Grafana@v12.4.0. See issue #392.
Tempo, Jaeger, and Zipkin data sources support Trace to metrics feature for navigating from a span in a trace directly to metrics relevant for attributes of that trace.
Metric to logs
Metric to logs correlation can be configured using correlations interface:


Then, in Grafana's Explore mode click on the specified field will open a split view of Logs datasource already filtered
by the configured fields:

Metric to traces
VictoriaMetrics storage doesn't support exemplars for traversing from time series to specific trace.
Jumping from the metric to traces is still possible via correlations
interface in the same fashion as described in Metrics to Logs section above.
FAQ
How to convert dashboard from Prometheus to VictoriaMetrics datasource?
Make sure that VictoriaMetrics datasource plugin is installed, and a new datasource is created from the plugin.
Each panel in Grafana dashboard has a datasource dropdown when in Edit mode. Just choose the VictoriaMetrics datasource instead of Prometheus datasource in dropdown.
If datasource is configured via Grafana variable, then change variable to VictoriaMetrics datasource type.
Why VictoriaMetrics datasource doesn't support alerting?
Grafana doesn't allow forwarding Alert requests to alerting API /api/v1/rules for plugins which are not of Prometheus or Loki type.
See more details here.
License
This project is licensed under the AGPL-3.0-only.
Grafana Cloud Free
- Free tier: Limited to 3 users
- Paid plans: $55 / user / month above included usage
- Access to all Enterprise Plugins
- Fully managed service (not available to self-manage)
Self-hosted Grafana Enterprise
- Access to all Enterprise plugins
- All Grafana Enterprise features
- Self-manage on your own infrastructure
Install on Grafana Cloud
Plugins can be installed directly from within your Grafana instance or automated using the Cloud API or Terraform.
Learn more about plugin installationMarketplace plugins
This is a paid plugin developed by a marketplace partner. To purchase an entitlement, sign in first, then fill out the contact form.
Get this plugin
This is a paid for plugin developed by a marketplace partner. To purchase entitlement please fill out the contact us form.
What to expect:
- Grafana Labs will reach out to discuss your needs
- Payment will be taken by Grafana Labs
- Once purchased the plugin will be available for you to install (cloud) or a signed version will be provided (on-premise)
Thank you! We will be in touch.
For more information, visit the docs on plugin installation.
Installing on a local Grafana:
For local instances, plugins are installed and updated via a simple CLI command. Plugins are not updated automatically, however you will be notified when updates are available right within your Grafana.
1. Install the Data Source
Use the grafana-cli tool to install VictoriaMetrics from the commandline:
grafana-cli plugins install The plugin will be installed into your grafana plugins directory; the default is /var/lib/grafana/plugins. More information on the cli tool.
Alternatively, you can manually download the .zip file for your architecture below and unpack it into your grafana plugins directory.
Alternatively, you can manually download the .zip file and unpack it into your grafana plugins directory.
2. Configure the Data Source
Accessed from the Grafana main menu, newly installed data sources can be added immediately within the Data Sources section.
Next, click the Add data source button in the upper right. The data source will be available for selection in the Type select box.
To see a list of installed data sources, click the Plugins item in the main menu. Both core data sources and installed data sources will appear.
Changelog
tip
v0.25.0
FEATURE: allow exporting label-only selectors such as
{job="prometheus"}from the Export Data dialog. Previously the export button required a named metric in the query. See #471. Thanks to @dmedovich for contributing.FEATURE: move the timestamp column first in exported CSV files and change the download to a direct link to avoid loading large datasets into the browser. Column order is controlled via the
formatparameter. See #471. Thanks to @dmedovich for contributing.FEATURE: provide a plugin binary for OpenBSD. Thanks to @ledeuns for contributing.
BUGFIX: preserve metric names containing special characters (e.g.
CellTemp(1)[°C]) in the Export Data flow. Such names are now wrapped into a__name__="..."matcher, producing a parseable selector. See #508.BUGFIX: fix selector validation errors in the Metrics Browser being reported as "undefined series found". Errors are now shown as a clear message. See #471. Thanks to @dmedovich for contributing.
BUGFIX: make label keys in the Export Data CSV options available even when the query has not been executed yet. Previously they were derived from the current panel response, so opening the export dialog before running the query (or on a query that returned no data) left the labels picker empty.
v0.24.0
FEATURE: store WITH templates as a hidden dashboard variable instead of datasource settings. Templates are now automatically exported/imported with dashboards and support Grafana variable reactivity. See #490. Migration guide: existing templates from datasource settings continue to work automatically — no action is required. To fully migrate a dashboard to the new storage:
- Open any panel on the dashboard in edit mode.
- Click the
WITH templatesbutton (gear icon) and clickSave. - All panels on the dashboard will be automatically migrated in a single step.
- Save the dashboard to persist the changes.
BUGFIX: fix instant queries returning no data when the auto-calculated step is smaller than the metric scrape interval. The minimum step for instant queries is now enforced at 5 minutes unless the user explicitly sets a lower value via the
Min stepfield. See #491.BUGFIX: fix autocomplete inserting duplicate prefix for metric names containing dots (e.g.
kubernetes.pod.id). See #493.
v0.23.4
- MAINTENANCE: update Grafana dependency range to support version 13.x.x.
v0.23.3
BUGFIX: fix health check URL generation when using vmauth with URL rewriting by replacing
/-/healthyendpoint with/api/v1/query?query=1. This ensures health checks go through the same URL path as real queries, validating actual VM backend reachability. See #468 and #482.MAINTENANCE: fix Grafana plugin source code validation failure caused by dependency version mismatch after yarn 4 migration.
v0.23.2
- BUGFIX: enhance error handling in datasource responses to include detailed error messages. See #474.
- BUGFIX: fix an issue with Metrics Browser hangs when the datasource has many metrics. See #469.
v0.23.1
- BUGFIX: fix plugin Grafana dependencies to ensure compatibility with Grafana version 12.4.x. See #462.
v0.23.0
BREAKING: change the supported Grafana version to
>=11.6.11 <12||>=12.0.10 <12.1||>=12.1.7 <12.2||>=12.2.5to ensure compatibility with@grafana/plugin-uiand React 19. This drops support for other versions of Grafana.BUGFIX: fix an issue where requests failed with compression formats other than gzip, resulting in "No metrics found" errors. See #455.
v0.22.0
FEATURE: merge metadata with all available metrics in the query builder. This ensures users can see all available metrics in the metrics explorer, with proper type information when available, while still being able to select metrics that don't yet have metadata defined. See #442.
FEATURE: add export button that allows export data in JSON line and CSV formats via API. See #441.
BUGFIX: add FreeBSD (amd64) build target for datasource backend. See #446.
v0.21.0
- FEATURE: add metrics metadata exploration to the query builder. The button with the book-open icon opens the metrics explorer modal, where the user can explore the metrics metadata. See #417.
v0.20.1
- DEPENDENCY: upgrade
grafana-plugin-sdk-go.
v0.20.0
FEATURE: add a setting to the datasource configuration to choose the api for label names and label values. If enabled, the datasource will use the
/api/v1/labelsfor the label names and the/api/v1/label/<label>/valuesendpoint for label values. See #187.BUGFIX: fix React Router vulnerability to XSS via Open Redirects by updating the transitive dependencies: grafana packages. See pr #426.
BUGFIX: fix time range rounding for the small intervals. See #310.
v0.19.7
- BUGFIX: fix an issue where
Min step>Min intervalcauses an empty graph. See #377.
v0.19.6
- BUGFIX: fix an issue where the
Prettify queryaction caused the refId to be deleted. See #397. - BUGFIX: fix 'auto' legend labels. Now only the label value is displayed if there is only one label. See #407.
v0.19.5
- BUGFIX: fix applying
WITHtemplate to the query expression. See #397. - BUGFIX: fix applying
Custom query parameterswhen querying from Grafana variables. See #396.
v0.19.4
- BUGFIX: fix the problem with health check URL generation where the
/select/prefix was incorrectly included in the health endpoint path. Health check is working properly now. See #388.
v0.19.3
- BUGFIX: auto-calculate
stepparam for range queries consistently with other datasources. Before,stepbetween datapoints on the graph could have use unexpected values depending on the time range. See #383 - BUGFIX: fix issue with intervals less than 1 second not being handled correctly in time parsing. See #376
- BUGFIX: fix issue with heatmap producing empty data or wrong visualization. See #382.
- BUGFIX: fix issue when an instant query on a Stat panel returns
No Value. See #385. - BUGFIX: fix graph visualization issue when query tracing is enabled. Before, enabled tracing could produce response errors.
v0.19.2
- BUGFIX: fix the issue with dashboards showing no data when the
formatfield was undefined. Now theformatdefaults totime_serieswhen not explicitly set, ensuring proper data visualization for existing queries and dashboards. See #377
v0.19.1
- BUGFIX: fix duplication of statistics panels. See #372
v0.19.0
FEATURE: upgrade Go builder from Go1.24.2 to Go1.25. See Go1.25 release notes.
BUGFIX: fix incorrect field unmarshalling when rendering query results as a table. See this issue
BUGFIX: fix issue with concurrent map writes when performing multiple requests to the datasource. See this issue
v0.18.3
- BUGFIX: fix the calculation of the
stepparameter and lookbehind window for therangequeries if the$__rate_intervalvariable is used. See this issue. - BUGFIX: fix parsing of the datasource settings, enable usage of the scrape interval when the lookbehind window is calculated for the query url. See this PR.
- BUGFIX: fix handling of the 'auto' legend mode so series labels are generated correctly. See this issue.
- BUGFIX: fix an issue where line charts were incorrectly connecting data points across missing (null) values despite the "Connect null values" panel setting being set to "Never". See #364.
v0.18.2
- BUGFIX: fix regression of the plugin that cause the plugin to not work with
values,with templateandnamesqueries. Fix comments after the plugin verification procedure.
v0.18.1
- BUGFIX: upgrade
jestlibrary version to fix vulnerability warning.
v0.18.0
BREAKING: increase minimum required Grafana version to
>=10.4.0to ensure compatibility with@grafana/plugin-ui. This drops support for older Grafana versions.FEATURE: preserve variable expression when switching between compatible variable types. See #332.
v0.17.0
FEATURE: add support for the
defaultbinary operator in the visual query builder. See this issue.BUGFIX: add a rollup field to rollup_rate function. See this issue.
v0.16.0
FEATURE: add support dots in label name. See this issue.
FEATURE: update Visual Query Builder code from Grafana upstream. Thanks to @SammyVimes for the pull request.
BUGFIX: fix label filter value loading for metric names with special characters. See this issue.
BUGFIX: fix an issue in Grafana 10.1.5 where creating a variable using label_values is not possible. See this issue.
v0.15.1
- Added PDC support. See this issue.
v0.15.0
- Added PDC support. See this issue.
v0.15.0-alpha2
- BUGFIX: removed version constraint for secure proxy configuration
v0.15.0-alpha1
Update Note 1: This is an alpha release. We do not recommend using it in production.
- Added PDC support. See this issue.
v0.14.0
FEATURE: automatically escape metric and label names in the query builder. See this issue.
BUGFIX: fix an issue where the
vmuilink had an incorrect address of the typeabout:blank. See this issue.BUGFIX: fix change of the selected time range when aligning query intervals. See #275.
v0.13.4
- BUGFIX: fix error when response detected as not a wide series. See this issue.
- BUGFIX: fix the inspector query while press on refresh button. Thanks to @yincongcyincong for the pull request.
v0.13.3
- BUGFIX: correctly calculate step for the instant query, use
5mstep for the alerting queries if interval wasn't explicitly set by user. This change reduces alerts flapping for Grafana managed alerts. See this issue.
v0.13.2
- BUGFIX: use
5mstep for the alerting queries if interval wasn't explicitly set by user. This change reduces alerts flapping for Grafana managed alerts. See this issue.
v0.13.1
- BUGFIX: cleanup README.md for the plugin. Clarify how to make release. See this PR.
v0.13.0
v0.12.2
FEATURE: change
localStoragekey names to avoid collisions with other systems. See this PR.BUGFIX: clean up the plugin codebase after the plugin verification procedure. See this PR and this PR.
v0.12.1
- BUGFIX: fix issue with including the lezer-metricsql package to the build and fix public folder. See this PR.
- BUGFIX: fix plugin loading for query formatting in the editor. See this issue.
- BUGFIX: fix issue with "Prettify query" functionality corrupting dashboard JSON model. See this issue.
v0.12.0
⚠️ Breaking Change: Plugin ID Updated
Update Note 1:
In the new version of the plugin, the plugin ID has been updated. The new plugin ID is victoriametrics-metrics-datasource. This is a breaking change: Grafana will treat this as a new plugin.
- You must update the
allow_loading_unsigned_pluginsfield in thegrafana.iniordefaults.iniconfiguration file.
Example:allow_loading_unsigned_plugins = victoriametrics-metrics-datasource - If you are using provisioning, update the
typefield tovictoriametrics-metrics-datasourcein your provisioning configuration. - After making these changes, you must restart the Grafana server for the updates to take effect.
- FEATURE: update plugin id name to
victoriametrics-metrics-datasourceafter the review while sign procedure. See this issue.
v0.11.1
- BUGFIX: fix checksum calculation for release files.
v0.11.0
FEATURE: include request url in the
got unexpected response status codeerror message for troubleshooting. Thanks to @chenlujjj for the pull request.BUGFIX: fix issue with variables not working in adhoc filters. See this issue.
BUGFIX: fix query type switching when creating alerts in Grafana. See this issue
v0.10.3
- BUGFIX: fix query loading when using multiple visible queries in a panel. See this issue.
- BUGFIX: fix escaping when selecting metrics in the metrics browser. See this issue.
- BUGFIX: fix incorrect step calculation in annotation queries. See this issue.
v0.10.2
BUGFIX: fix the inspector query while press on refresh button. See this issue. Thanks to @yincongcyincong for the pull request.
BUGFIX: fix shows the value after prettified request in the table view. See this issue. Thanks to @yincongcyincong for the pull request.
v0.10.1
- BUGFIX: fixed healthcheck
v0.10.0
FEATURE: set the default query type to
instantwhen creating alerting rules. See this issue.BUGFIX: removed
/select/-prefixed part of path for /health endpoint requests. See this issue.
v0.9.1
- BUGFIX: fix parsing dots in the the
label_valuesfunction in the query builder. See this issue. Thanks to @yincongcyincong for the pull request.
v0.9.0
- FEATURE: make retry attempt for datasource requests if returned error is a temporary network error. See this issue
v0.8.5
- BUGFIX: restore support for Grafana versions below
10.0.0. See this issue. - BUGFIX: fix issue with forwarding headers from datasource to the backend or proxy. It might be helpful if a user wants to use some kind of authentication. See this issue.
v0.8.4
- BUGFIX: fix label join function in builder mode. See this issue. Thanks to @yincongcyincong for the pull request.
- BUGFIX: add missing rollup functions to the builder suggestion list. See this issue. Thanks to @yincongcyincong for the pull request.
- BUGFIX: properly apply ad-hoc filters for some rollup functions. See this issue. Thanks to @yincongcyincong for the pull request.
v0.8.3
- BUGFIX: fix an issue with prettify query if the query includes Grafana variables in the lookbehind window. See this issue.
- BUGFIX: fix an issue with ad-hoc filters applied to variables in query. See this issue. Thanks to @yincongcyincong for the pull request.
v0.8.2
- BUGFIX: fix parsing of label names with special characters for the query builder. See this issue.
v0.8.1
- BUGFIX: fix an issue in the template variable service where accessing the
datasourceproperty ofundefinedcaused a failure. See this issue.
v0.8.0
FEATURE: add variable type selector to optimize API usage, favoring /api/v1/labels and /api/v1/label/.../values over /api/v1/series. See this issue
BUGFIX: correct parsing the Annotations queries when template variables are used. See this issue
v0.7.0
FEATURE: add visually highlight partial responses. See this issue
BUGFIX: correct the queries for
Label FiltersandMetrics Browserfor metrics with special characters. See this issue
v0.6.0
FEATURE: add support metrics with special characters in query builder. See this issue
BUGFIX: fix the default link to vmui. See this issue
BUGFIX: fix the parsing logic in
renderLegendFormatto correctly replace legend label names. See this issueBUGFIX: fix query editor which produce a lot of requests for alerting rule evaluation. See this issue
v0.5.1
- BUGFIX: fix query builder logic to correctly parse metric names with dots. See this issue
v0.5.0
FEATURE: add Windows support for backend plugin. See how to build backend plugin for various platforms here. See this issue.
FEATURE: migrate to React to prevent warnings about the discontinuation of Angular support. See this issue.
FEATURE: add
--versionflag for backend datasource binary. See this issue.FEATURE: add a warning window about using
WITH templatesfor not yet created dashboards. See this issue.FEATURE: add a separate scope for storing
WITH templatesfor the Explore tab.BUGFIX: fix incorrect parsing when switching between code/builder modes in query editor. See this issue
v0.4.0
FEATURE: add datasource settings for limiting the number of metrics during discovery. The proper limits should protect users from slowing down the browser when datasource returns big amounts of discovered metrics in response. See this issue.
FEATURE: add a
prettify queryicon, which when clicked, formats the query. See this issue.FEATURE: change the style of the buttons
WITH templatesandRun in vmuito icons.BUGFIX: correctly handle custom query parameters in annotation queries. See this issue
BUGFIX: fix the duplication of labels in the legend when using expressions. See this issue
BUGFIX: fix the loading of metrics in the
metrics browser. See this issueBUGFIX: fix an issue where
metricsqlfunctions were not properly processed. See this issue
v0.3.0
- FEATURE: Improvements to WITH Templates (see this comment):
- The management of
WITH templateshas been transferred from datasource settings to the panel editing page; - Improved display of templates in auto-complete hints;
- Enabled auto-complete within curly braces for filters defined in templates;
- Added support for Grafana variables such as
$__interval,$__rate_interval, etc. in WITH expression validation; - Fixed the link to
vmuiwhen usingWITH templates.
- The management of
v0.2.1
- BUGFIX: respect the time filter change on updating dashboard variables. See this issue
v0.2.0
FEATURE: add the ability to define expressions for each panel so that users can define WITH templates once and then reuse them. See this issue.
FEATURE: add support MetricsQL to query builder. See this issue.
FEATURE: add the ability to change the link for Run in VMUI button. See this issue.
BUGFIX: fix the tracing display for Grafana version 9.4.
BUGFIX: support label with dots in names for template function
label_values(). See this issue.
v0.1.3
Released at 08-03-2022
FEATURE: Add links to VMUI from the query panel. See this issue.
FEATURE: Add option to show query trace from the query panel. See this issue and this issue.
FEATURE: Change license to AGPLv3. See this issue.
BUGFIX: respect time filter for variables update. See this issue
v0.1.2
Released at 21-12-2022
- FEATURE: add annotation support
- FEATURE: add datasource backend
v0.1.1
Released at 17-11-2022
- BUGFIX: Add enum
AbstractLabelOperator. See this issue
v0.1.0
Released at 11-11-2022