Plugins 〉Mapgl


Mapgl


Start a new panel with a mock node graph to test styles and modes.
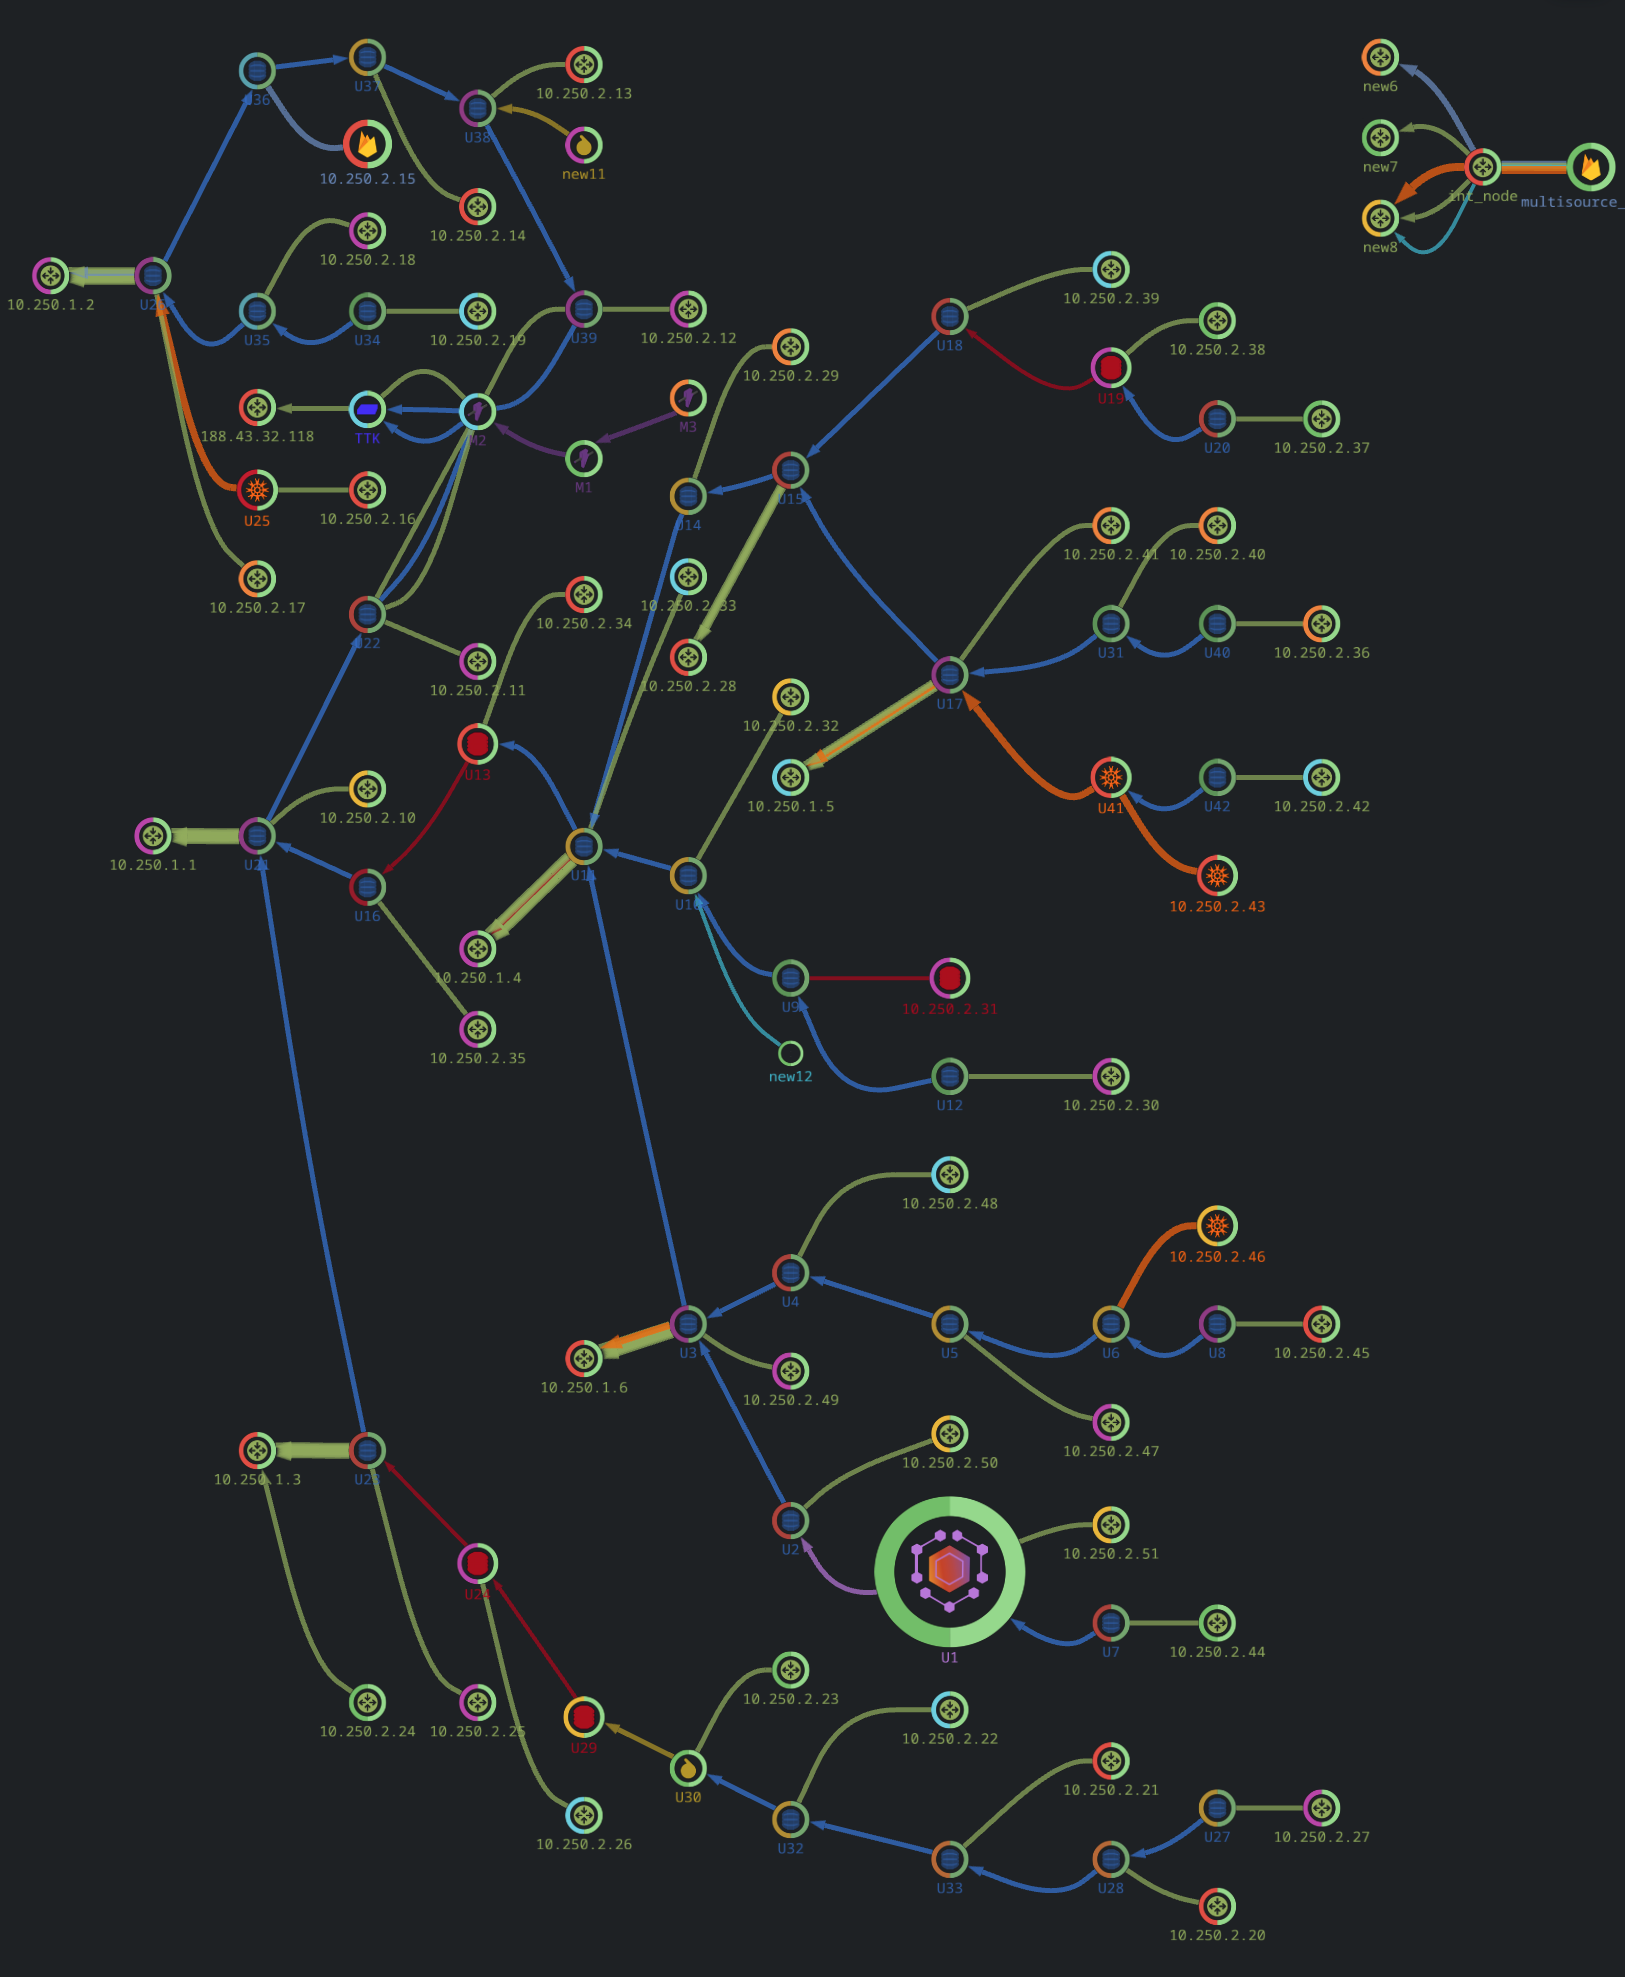
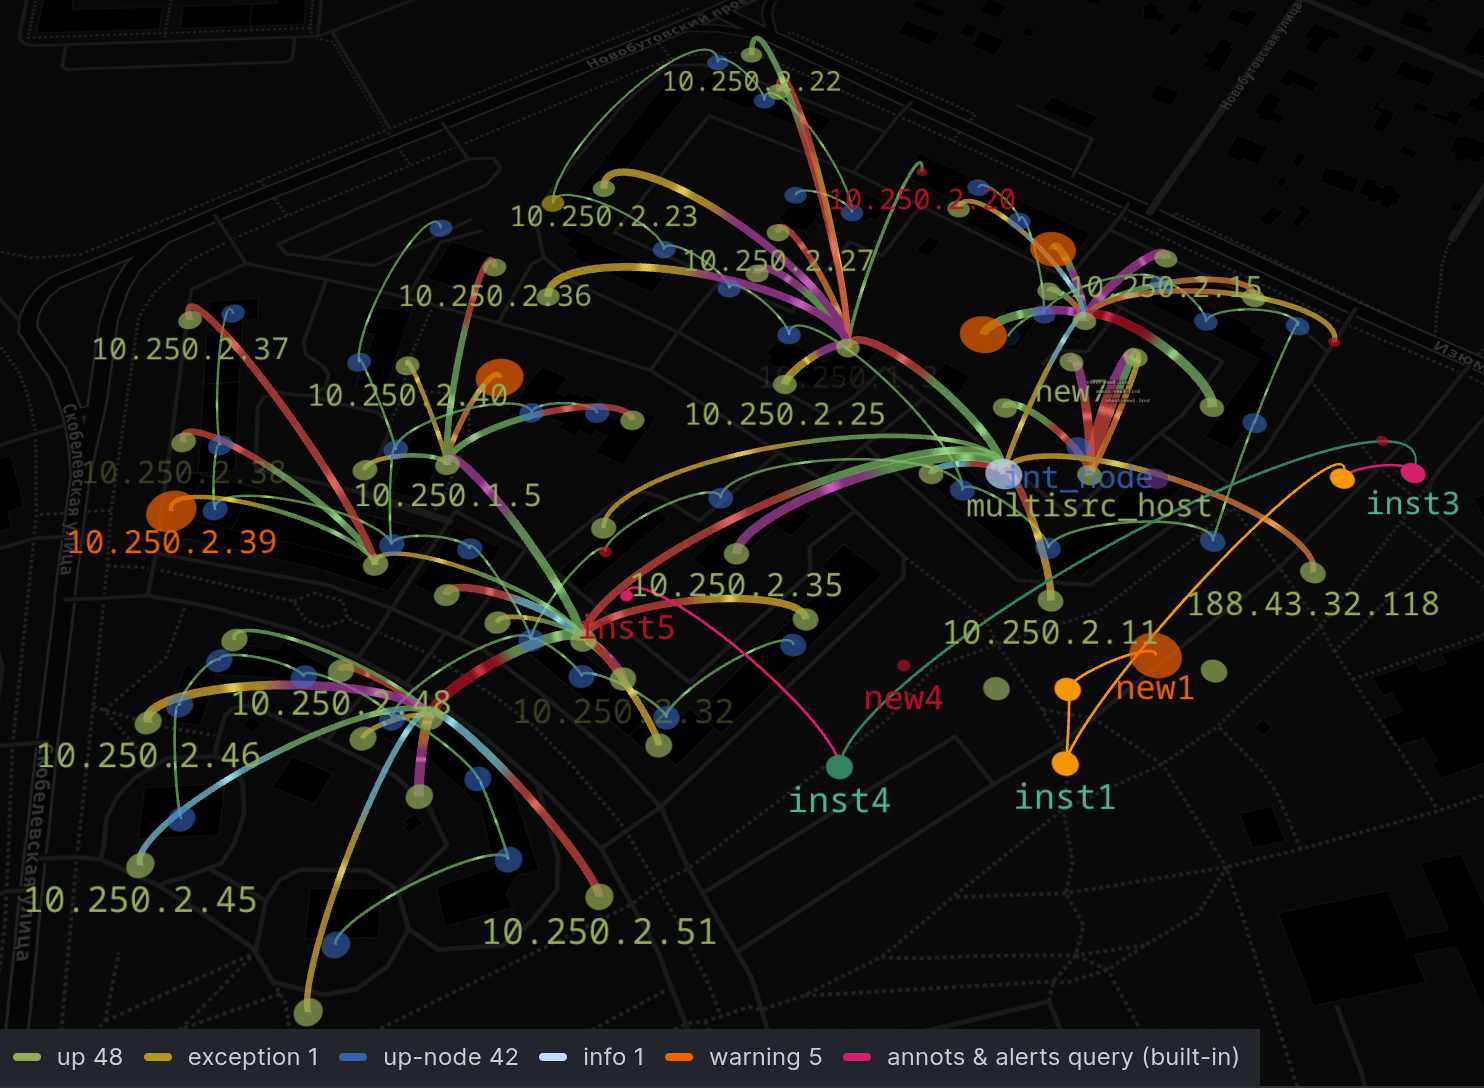
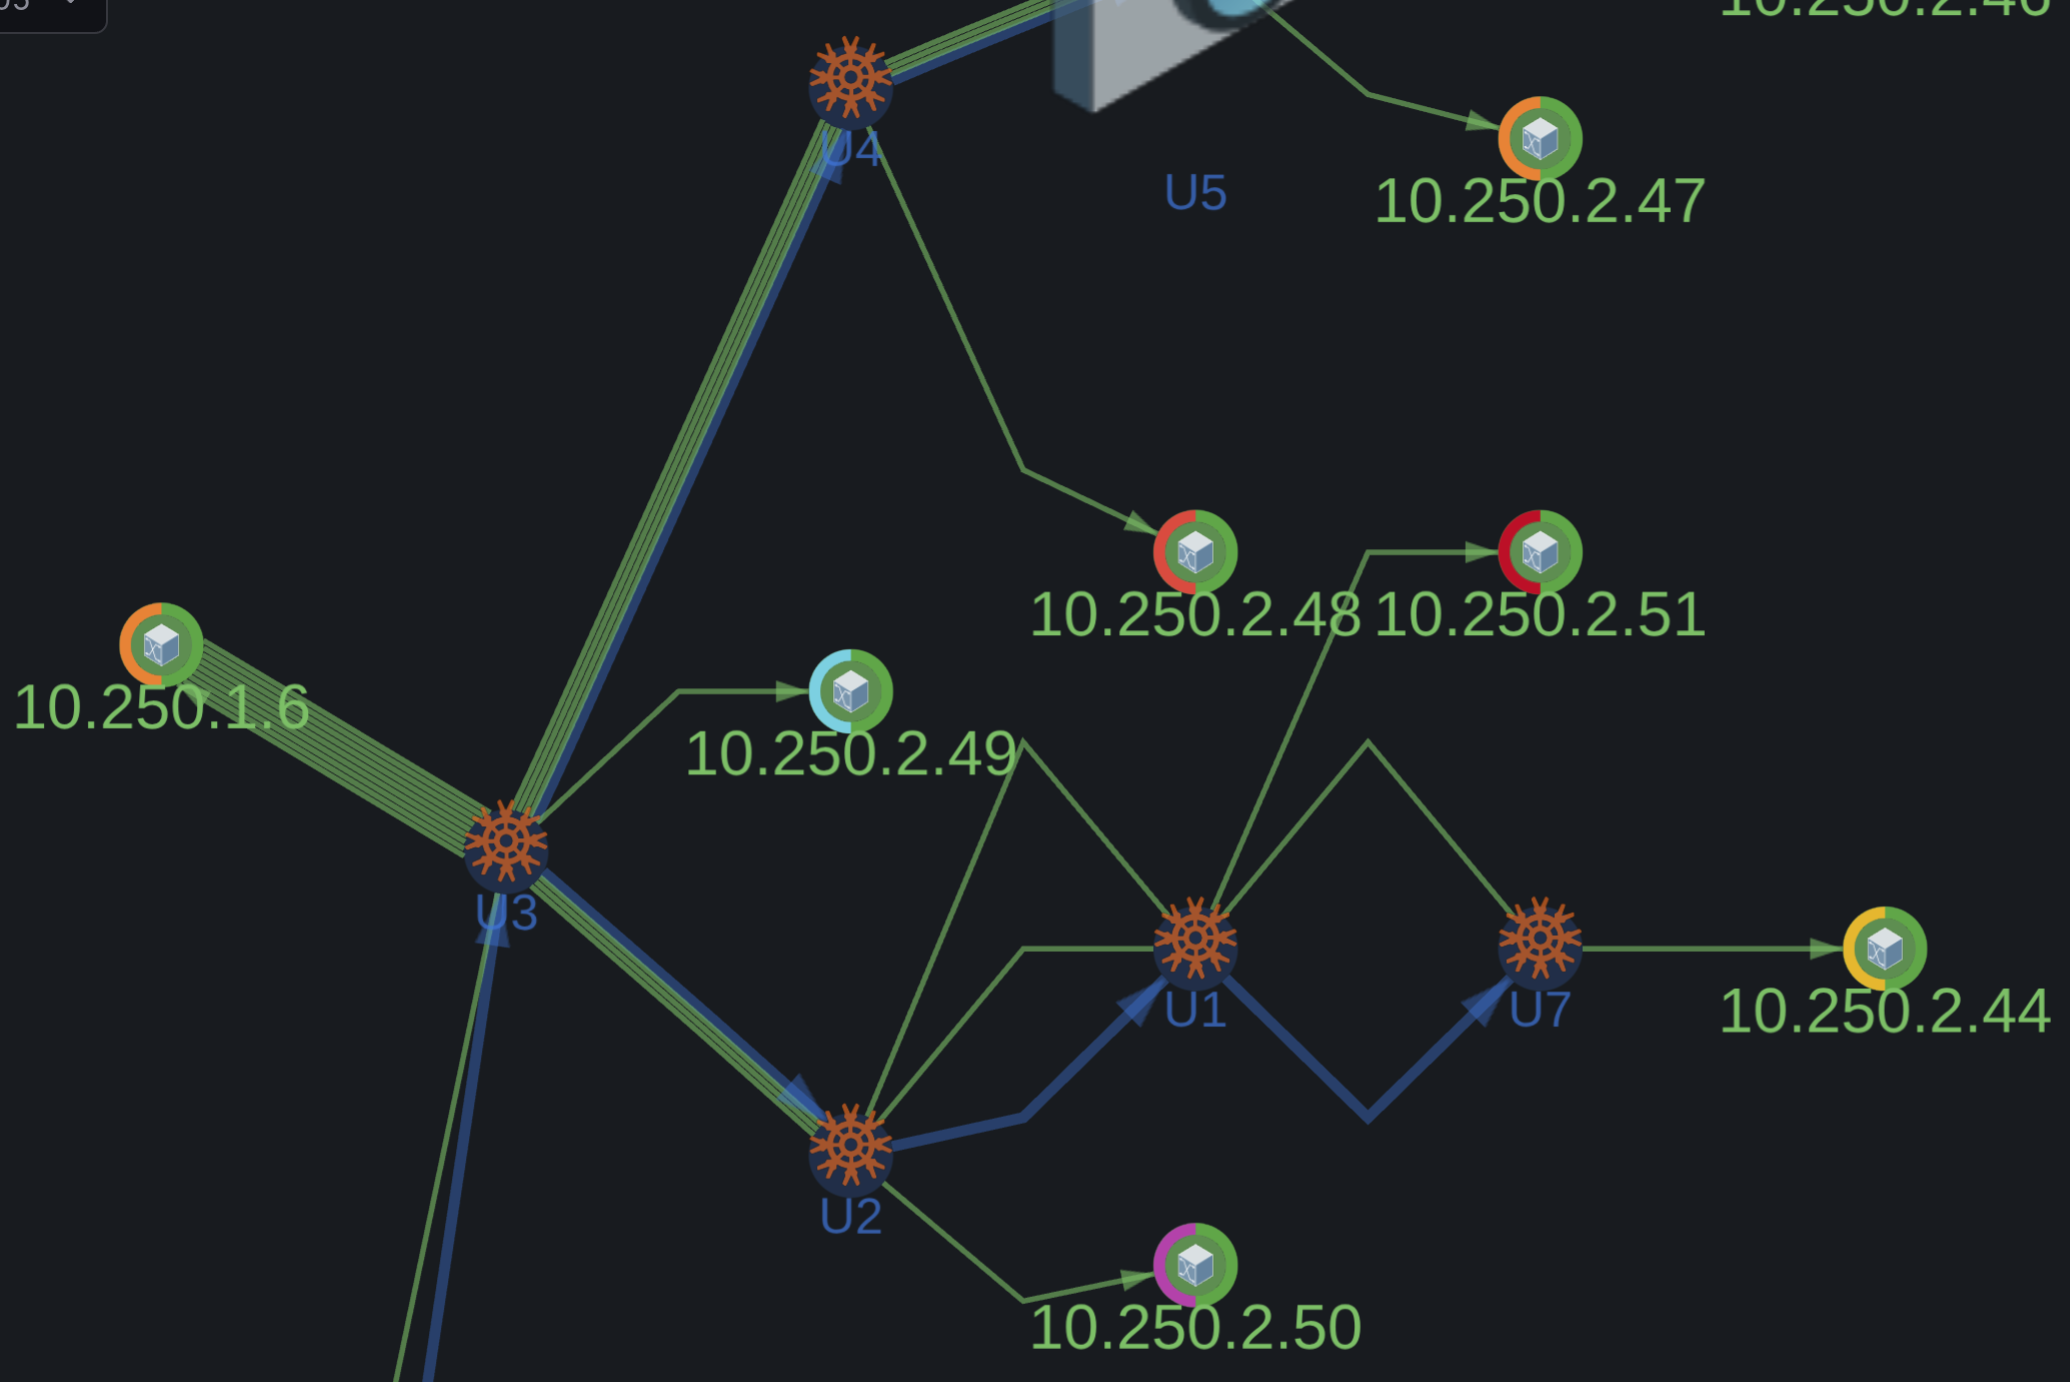
- Node graph with layered auto-layout and Geomap view
- Spline, rectilinear, self-loop, multi-hop, and parallel edge routing
- Arc sections on nodes for multiple metrics
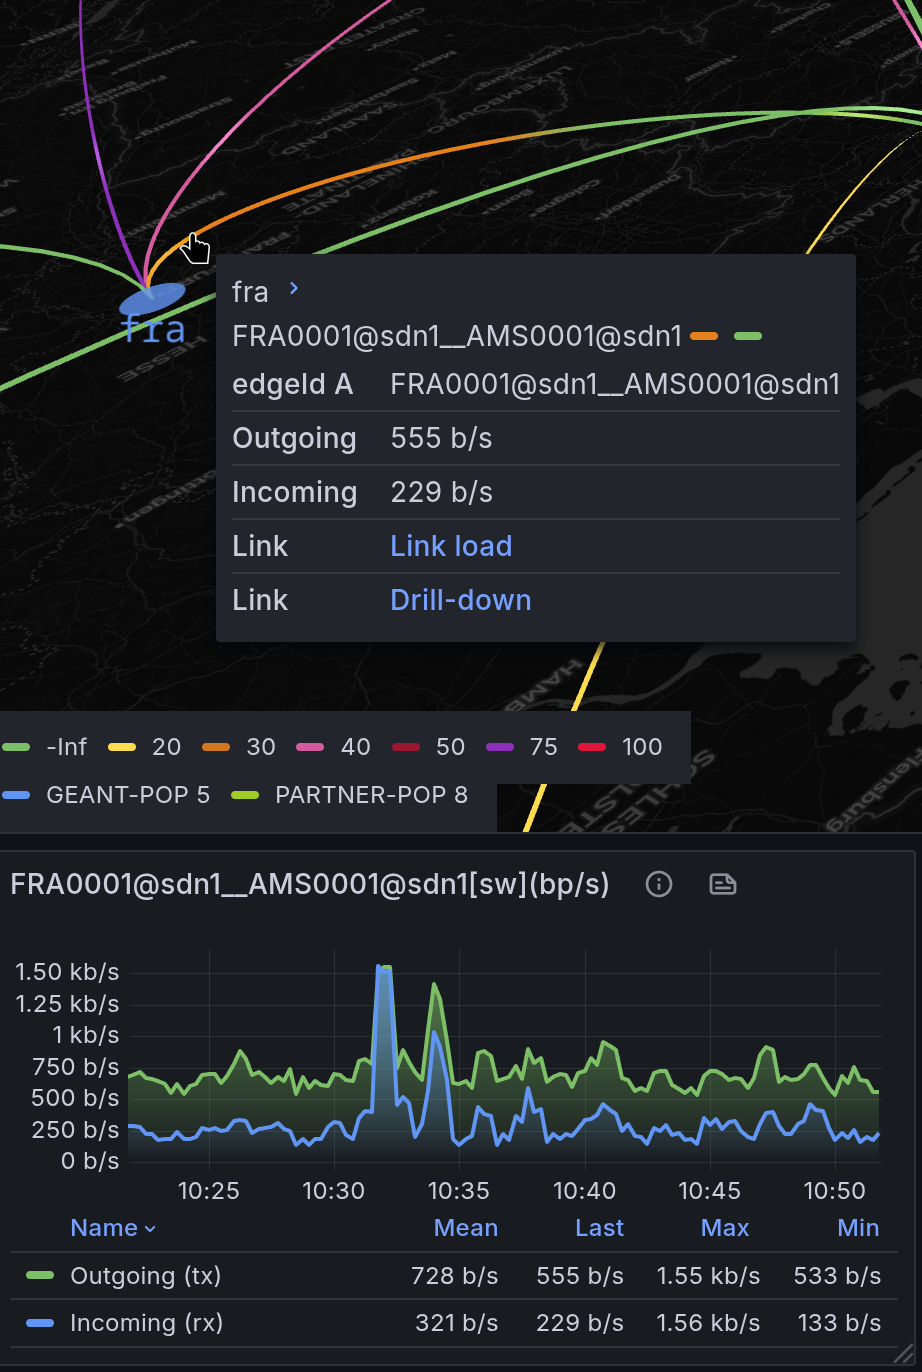
- TX/RX interface load visualization with bi-metric arcs
- WebGL GPU-accelerated rendering for large datasets
- Ad hoc filtering by layers and node groups in the legend
- Dynamic drill-down data links to external panels
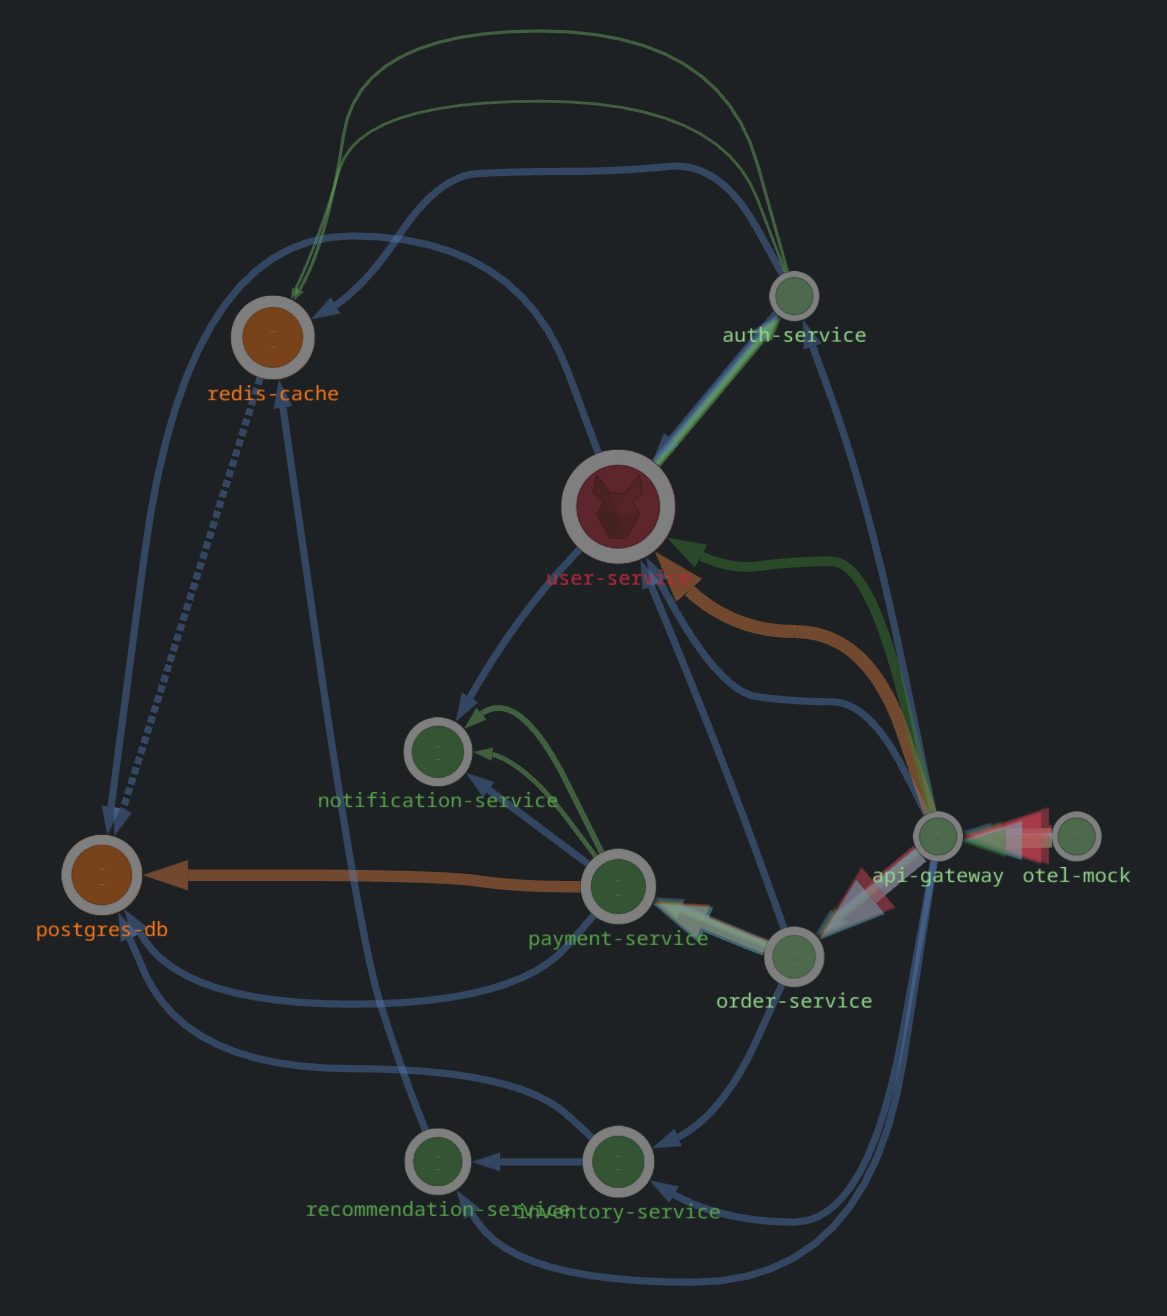
- Distributed tracing paths with per-span properties
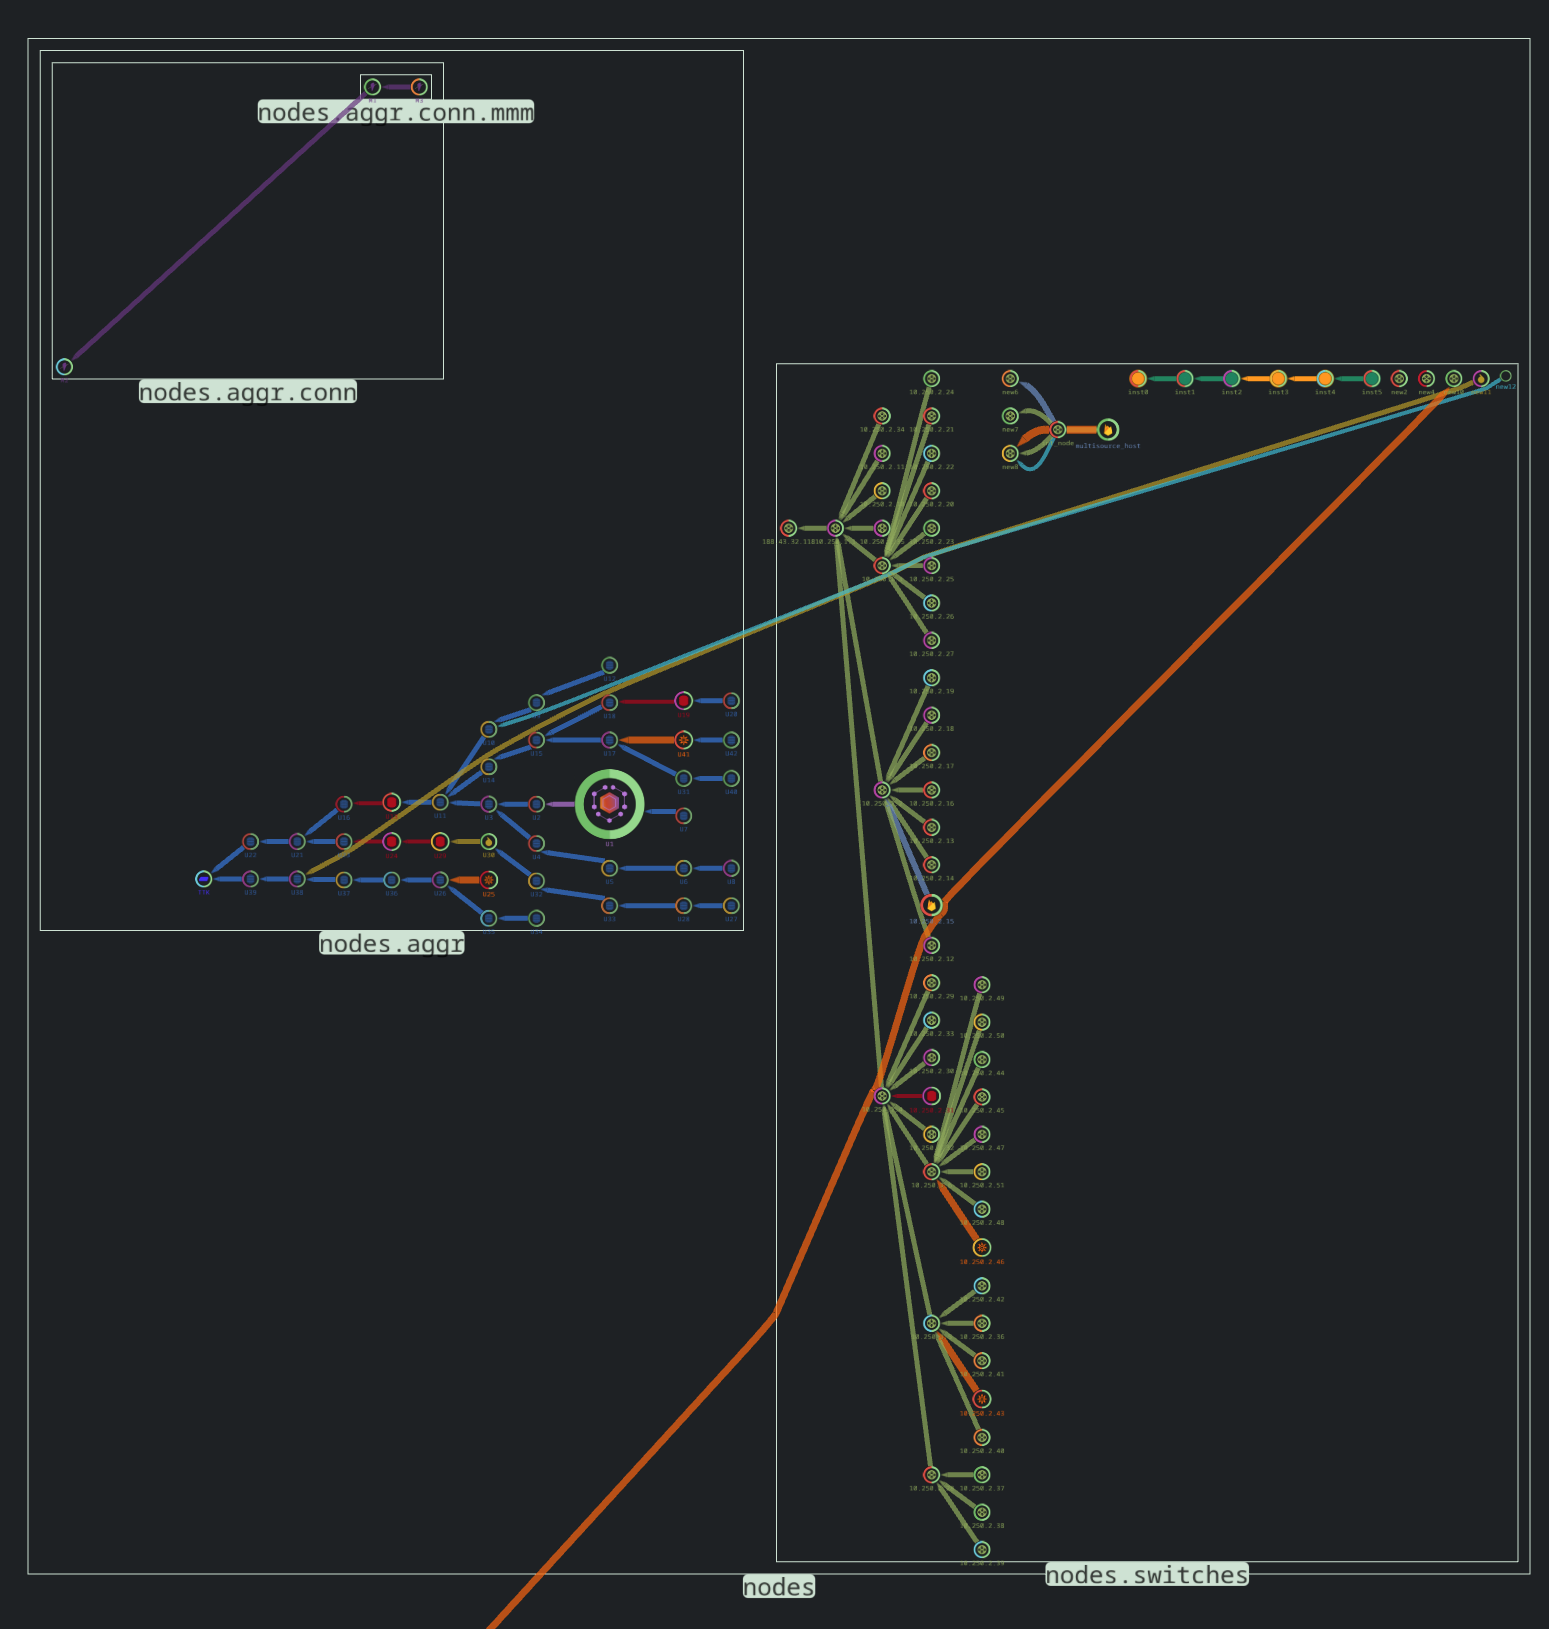
- Namespace-based subgraphs
🕹️ Demo
Playground with open configuration
Data Format
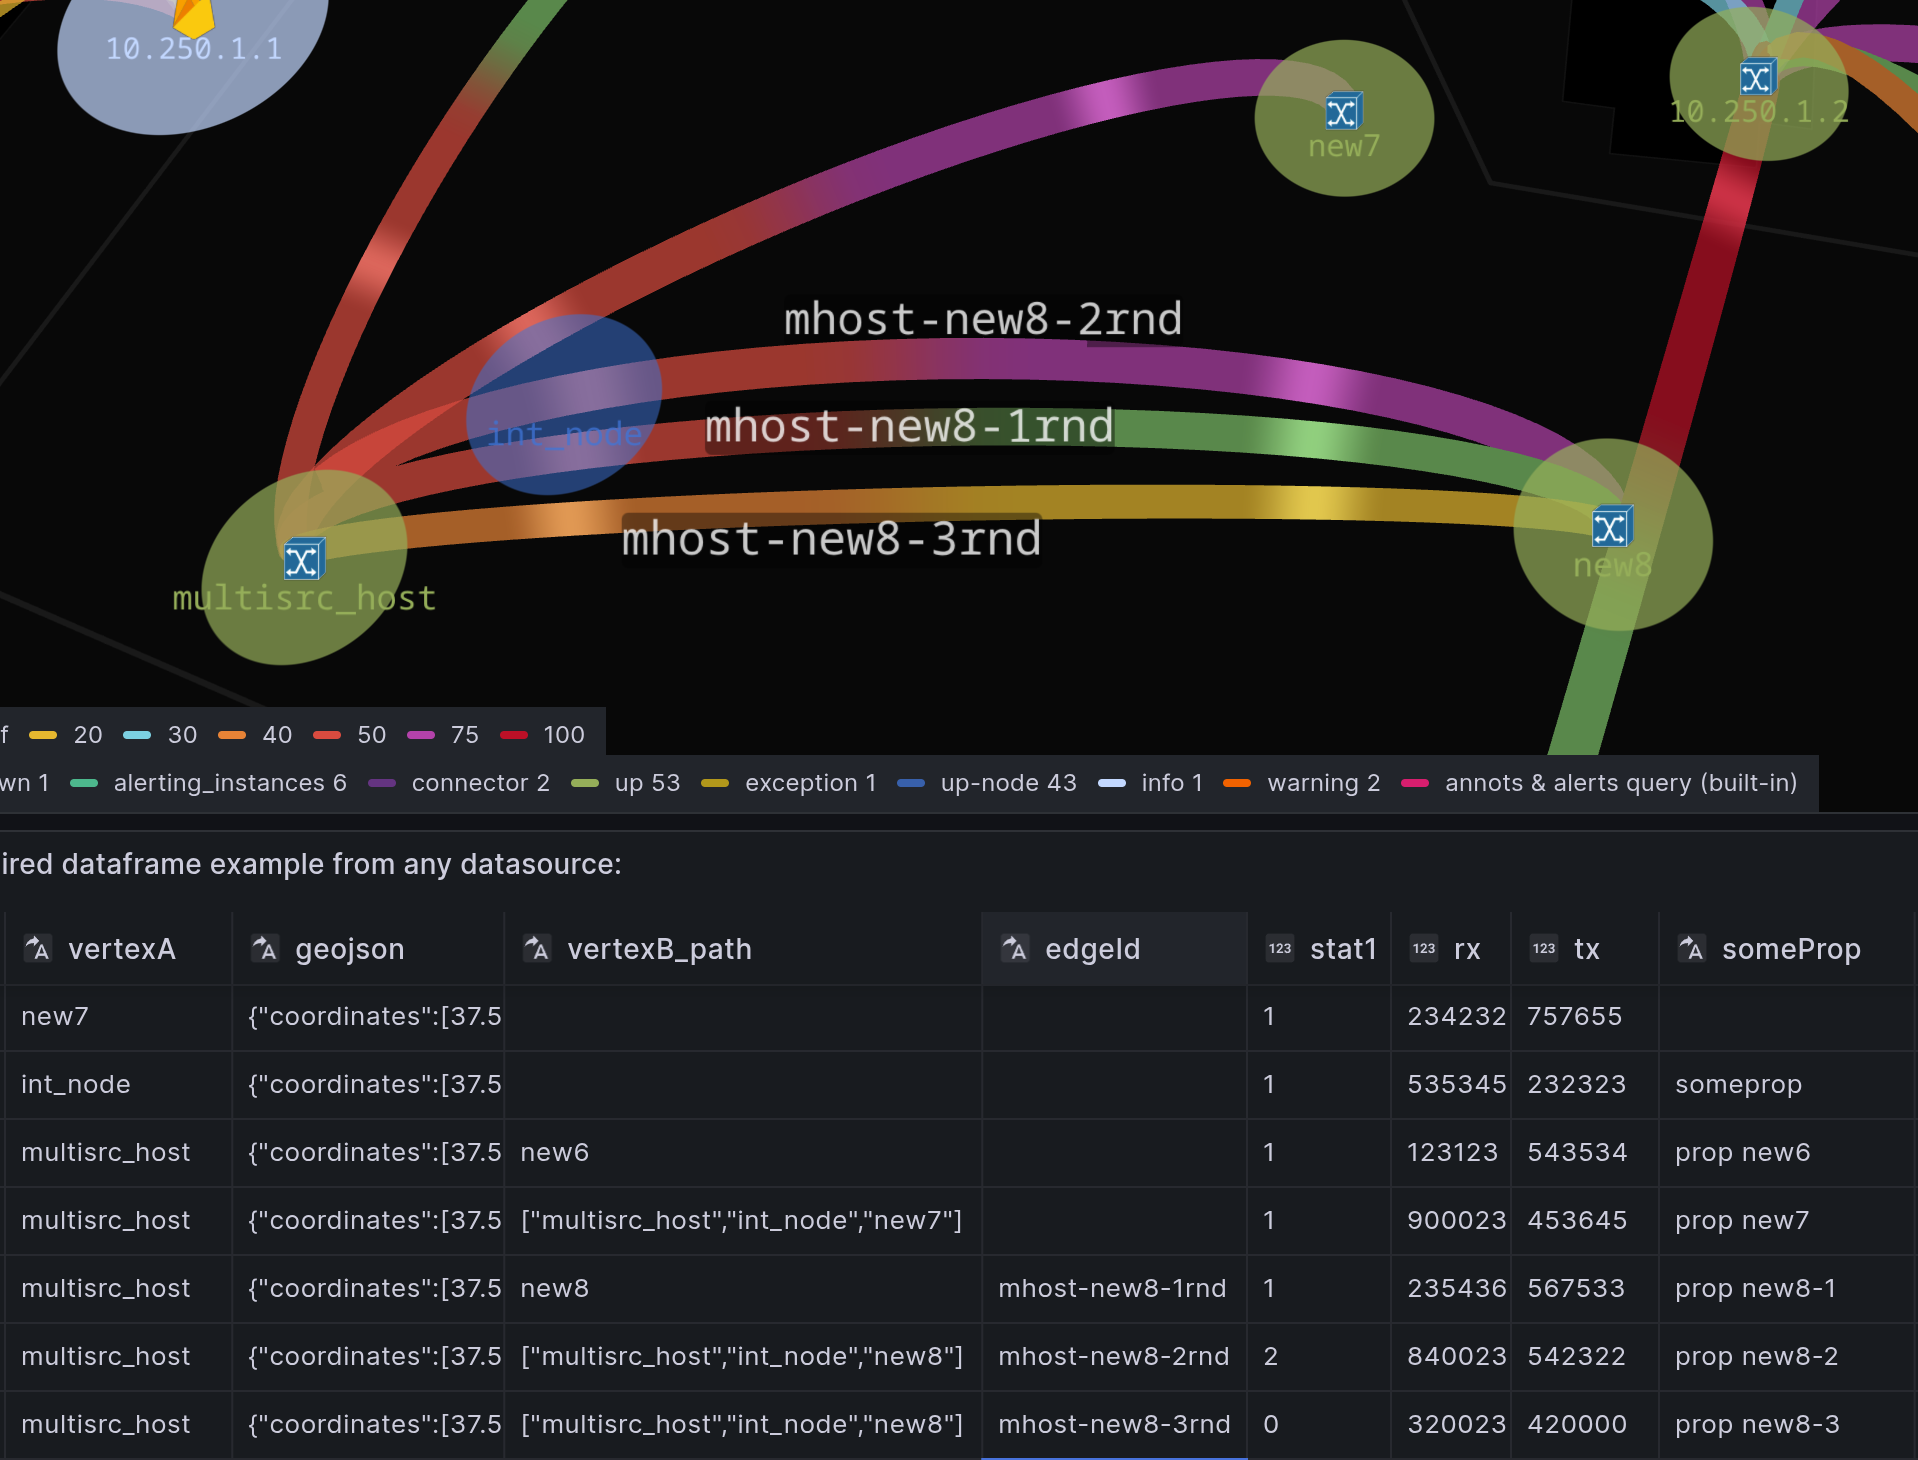
*Unified dataframe model for nodes and edges. Field names are examples only; Mapgl does not require fixed field names.
See Panel configuration for setup details and dataframe usage.
Data Preparation
Use Grafana’s built-in transformations to prepare and merge data from:
- Zabbix
- Prometheus
- Postgres
- Any other datasource
Netbox + Prometheus with drill-down
Netbox to Mapgl automation
Zabbix events on geomap
Field Config
Full support for native Grafana field config:
Thresholds– value ranges with associated colors to visually indicate statusMapping– rename displayed valuesUnits– measurement unit conversionOverrides– custom settings for specific metricsDataLinks– links to external dashboards or graphsNode Group style rules extend control over node color, icon, size, and line width.
Grafana Cloud Free
- Free tier: Limited to 3 users
- Paid plans: $55 / user / month above included usage
- Access to all Enterprise Plugins
- Fully managed service (not available to self-manage)
Self-hosted Grafana Enterprise
- Access to all Enterprise plugins
- All Grafana Enterprise features
- Self-manage on your own infrastructure
Install on Grafana Cloud
Plugins can be installed directly from within your Grafana instance or automated using the Cloud API or Terraform.
Learn more about plugin installationMarketplace plugins
This is a paid plugin developed by a marketplace partner. To purchase an entitlement, sign in first, then fill out the contact form.
Get this plugin
This is a paid for plugin developed by a marketplace partner. To purchase entitlement please fill out the contact us form.
What to expect:
- Grafana Labs will reach out to discuss your needs
- Payment will be taken by Grafana Labs
- Once purchased the plugin will be available for you to install (cloud) or a signed version will be provided (on-premise)
Thank you! We will be in touch.
For more information, visit the docs on plugin installation.
Installing on a local Grafana:
For local instances, plugins are installed and updated via a simple CLI command. Plugins are not updated automatically, however you will be notified when updates are available right within your Grafana.
1. Install the Panel
Use the grafana-cli tool to install Mapgl from the commandline:
grafana-cli plugins install The plugin will be installed into your grafana plugins directory; the default is /var/lib/grafana/plugins. More information on the cli tool.
Alternatively, you can manually download the .zip file for your architecture below and unpack it into your grafana plugins directory.
Alternatively, you can manually download the .zip file and unpack it into your grafana plugins directory.
2. Add the Panel to a Dashboard
Installed panels are available immediately in the Dashboards section in your Grafana main menu, and can be added like any other core panel in Grafana.
To see a list of installed panels, click the Plugins item in the main menu. Both core panels and installed panels will appear.
Changelog Mapgl
2.7.4:
- fix: fresh new panel initializes with mock data and a datalayer in panel config
2.7.3:
Regression bug: new panels do not initialize with this version. Update to v2.7.4.
- inverted style scaling option, allowing lower metric values to appear larger
- node graph zoom levels normalized to match Geo mode’s 1–18 range. QA:
- debounce auto-layout recalculation on opts change
- panel async update gate. Drops stale tasks on panel update/reload
2.7.2
- dashed style for edges; fit-to-data Max zoom range
2.7.1
- traces on service dependency graph: multi-hop edge with per-fragment span info from separate data-rows
- new provisioned dashboard: traces + service graph
- config: 'routed' edge mode by default; rm node group icon offset
- fix tooltip adjacency list selection bugs: icons flicker, target node selection
- refactor: externalize panel-core package. Panel acts as core consumer.
- auto-layout config in
Basemap layersection - dim text labels for non-highlighted edges
2.6.1
- auto-layout via Web Worker with shared memory for a non-blocking UX and no JSON-passthrough overhead
- refactor: types relocated, graph imports moved to the Web Worker, leaving only a thin shim in the main bundle
- fix: same-query layers and no-refId queries no longer panic due to positions buffer under-allocation
2.5.0
- adjacent edges list in tooltip.
- graph highlighter via shader mask for instant nodes/edges picking.
- FIX: cross-namespace edges with > 1 segment
2.4.0
- edge routing modes: SugiyamaSplines/Rectilinear
- edge curve interpolation on GPU shaders
2.3.0
- icon color tint config for Node Groups #8
- adhoc node group filter in the legend. GPU-fast
- SVGs (raw/donut) resampled for highres, boxed into circle boundaries. Simplify group rules (rm icon size)
- text labels offset from circle boundary (not from center point).
2.2.0
- namespace subgraphs support. Make your graph more branchy.
- revamped Group rules section #6
- fix: group rules threshold options sync with node metric field #5
- fix: scale on zoom for arrows and arc labels. Better arrow tips positioning.
2.1.0
- align styles with Grafana theme tokens. Theme support for widget buttons.
- hot patch for upstream FolderPickerTab Grafana 12.4.0. (No portal popups #119187)
- robust svg loading for edge arrows under stricter Grafana environments (v11.2.0)
- update field pickers and matchers from Grafana core
2.0.1
- arrows config for edges in 'routed' view mode
- parallel edges support for arcs/multi-hop edges in nodegraph view
- cut edges at node boundary ports to prevent overlapping with semi-transparent nodes.
- show head node id in edge tooltip
- enlarge picked arc, edge
2.0.0
- Node Graph with autolayout and spline edge routing that respects node boundary curves. In addition to Geo mode.
- Arc sections on nodes for any metrics.
- Style config extends Grafana Geomap styles-from-dimensions concept with overrides for user-defined node groups
- Native Grafana Field config support: Thresholds, Mappings, Units, Overrides, Data links.
- Bi-metric Arcs (ex., for TX/RX)
- Ad-hoc filters by layers, node groups in the legend
- Unified (Graph+Geo) single dataframe for nodes and edges (same as in v.1) avoids hardcoded dataframe requirements of the native Geomap/NodeGraph.
- v1 -> v2 data migration is not required
1.6.1
- fix labels in thresholds config to work with Tooltip component since Grafana 10.3.0
- fix tooltip css classes for pointerEvents:all
1.6.0
- cluster legend-filter
- fullscreen and compass widgets
1.5.0
- point circle and text label dimensions
- svg icon rules collapsible + resource picker
- bugfix: cluster hull polygon onHover doesn't lag on large datasets
1.4.0
- alerting states from built-in Grafana annotations query. State colors for nodes and clusters
- see-through convex hull polygon for cluster area
1.3.0
- cluster max zoom menu select to control clusterization
- convex hull polygon shows cluster boundaries, cluster expansion zoom on click
- restore Grafana >=9.2.5 support
- fix performance issues with composite sublayers constantly recalculating. IconGeoJsonLayer (circles+icons+text) has been separated from IconClusterLayer
1.2.0
- svg icons for nodes
- text labels with collision filter.
- bug fixes: allow lineWidth custom size, no min/max
1.1.0
- Multi-source, multi-target support
- Switch path direction by declaring dashboard variable 'locRole'.
- Data-links: icon in tooltip to sets values for 'target' and 'source' dashboard variables.
- Comment icons from specs inlined in intermediate coordinates (ex.: [37.560447,55.550818, 0, "comment", "green"])
- Aggregation nodes and offset for overlapping lines.
- stat1/stat2 switch to disable offset and show secondary metric
- edge labels in stat2 mode , aggregation nodes labels.
1.0.2
- Parent path as an array of coords or location IDs
- Aggregation nodes and offset for overlapping lines.
- Extended dotted line path to root.
- Bug fixes: isolate config options for different layers;
1.0.1
- Multi layers support
- PolygonsLayer, Path (LineStrings) layer from query
- Static GeoJson layer with FeatureCollection support from GeoJson file (url)
- Advanced thresholds processor for node group styles.
- Points show toggle
1.0.0
Initial release.