Plugins 〉PerfCurve
PerfCurve
Grafana Plugin PerfCurve
Overview
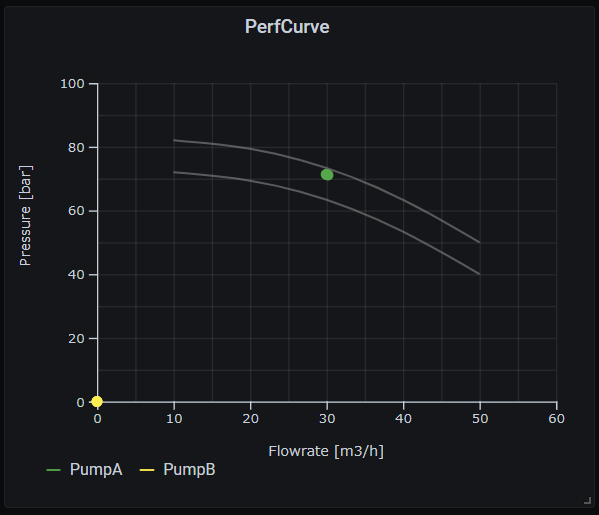
PerfCurve is a grafana panel plugin to plot operation point of rotating machine, such as pump, compressor and etc., on a canvas with its performance curves. You can draw multiple performance curves on the canvas only by giving sample points on the performance curve. The panel plugin connects sample points smoothly.
Important notes !!
Select the plugin version in accordance with the following rule.
- For Grafana >= 8.X.X, use version >= 1.5.X
- For Grafana >= 7.4.X, use version >= 1.4.X
- For Grafana <= 7.3.X, use version <= 1.3.X
Getting started
Axes
Specify Min., Max., Label, Unit and Decimals of X-axis amd Y-axis.
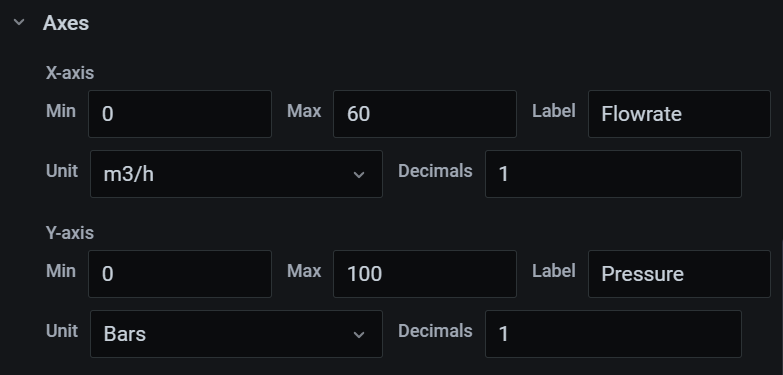
Static curve
Add performance curves to the canvas by specifying sample points in comma separated value format.
The number of values in X input box and Y input Box shall be same.
Natural curves are drawn based on the sample points.

Dynamic curve (Advanced)
In case performance curve data is availble in database, they can be used to draw peformance curve which dynamically move based on the data. (Example of query is written for InfluxDB datasource.)
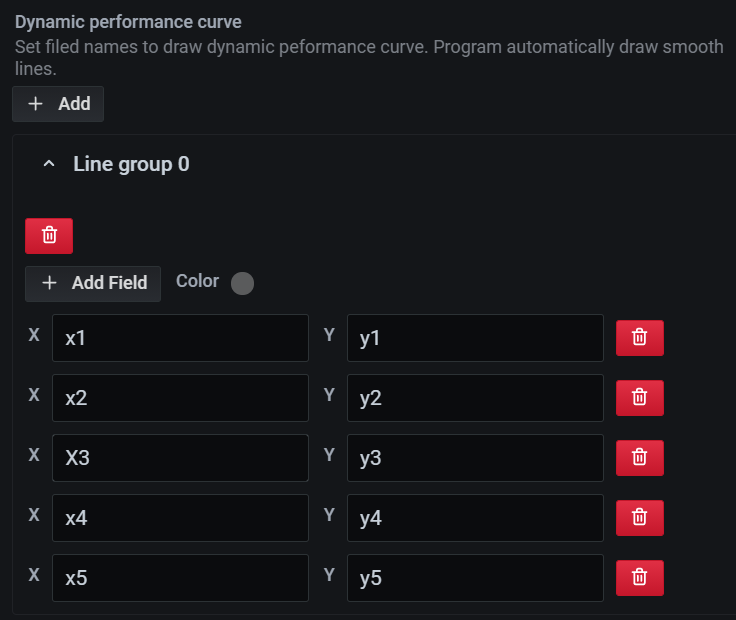

Operation points
Set field names for X box and Y box to plot operating points.
Set Label, Color and Point Radius, too.
Table format is recommended as query option.
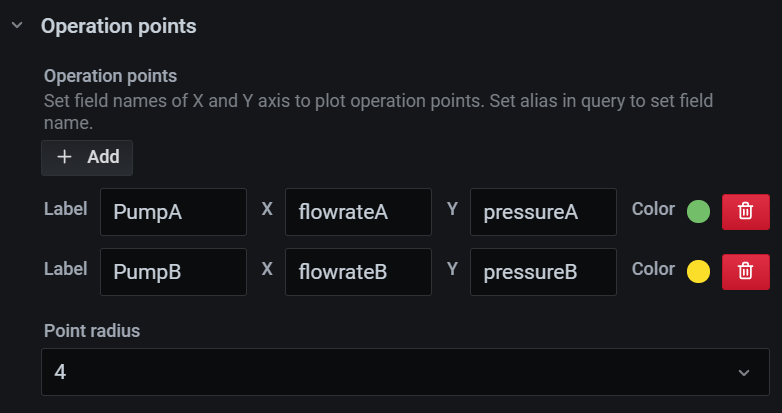
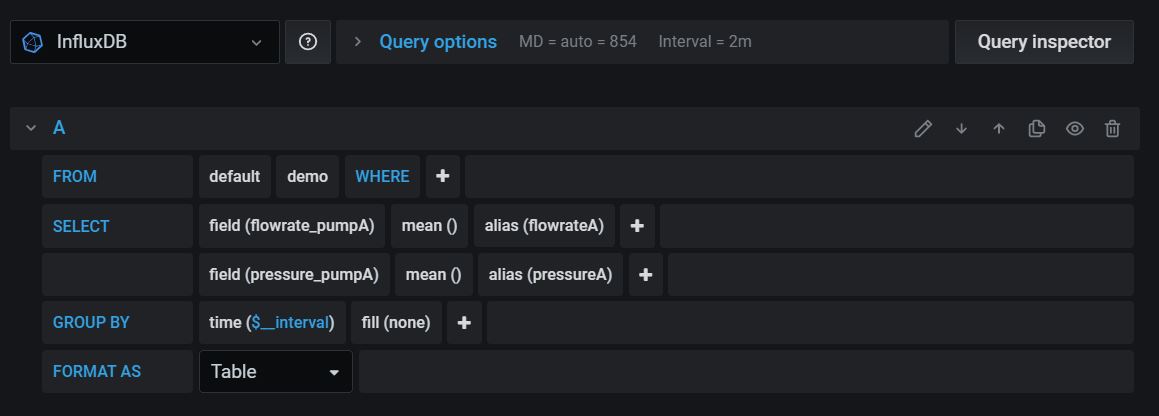
Sample with TestData DB
Refer to the attached sample input with TestData DB. TestData DB is available as default, if you add TestaData DB to data source.

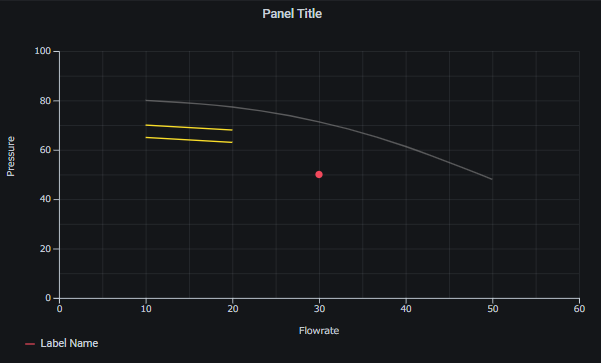
Sample of Panel JSON:
{
  "id": 23763571993,
  "gridPos": {
    "h": 9,
    "w": 12,
    "x": 0,
    "y": 0
  },
  "type": "sskgo-perfcurve-panel",
  "title": "Panel Title",
  "pluginVersion": "7.5.6",
  "targets": [
    {
      "alias": "Field X",
      "csvWave": {
        "timeStep": 60,
        "valuesCSV": "0,0,2,2,1,1"
      },
      "lines": 10,
      "points": [],
      "pulseWave": {
        "offCount": 3,
        "offValue": 1,
        "onCount": 3,
        "onValue": 2,
        "timeStep": 60
      },
      "refId": "A",
      "scenarioId": "csv_metric_values",
      "stream": {
        "bands": 1,
        "noise": 2.2,
        "speed": 250,
        "spread": 3.5,
        "type": "signal"
      },
      "stringInput": "30"
    },
    {
      "alias": "Field Y",
      "csvWave": {
        "timeStep": 60,
        "valuesCSV": "0,0,2,2,1,1"
      },
      "hide": false,
      "lines": 10,
      "points": [],
      "pulseWave": {
        "offCount": 3,
        "offValue": 1,
        "onCount": 3,
        "onValue": 2,
        "timeStep": 60
      },
      "refId": "B",
      "scenarioId": "csv_metric_values",
      "stream": {
        "bands": 1,
        "noise": 2.2,
        "speed": 250,
        "spread": 3.5,
        "type": "signal"
      },
      "stringInput": "50"
    },
    {
      "scenarioId": "csv_metric_values",
      "refId": "C",
      "alias": "Curve X1",
      "csvWave": {
        "timeStep": 60,
        "valuesCSV": "0,0,2,2,1,1"
      },
      "hide": false,
      "lines": 10,
      "points": [],
      "pulseWave": {
        "offCount": 3,
        "offValue": 1,
        "onCount": 3,
        "onValue": 2,
        "timeStep": 60
      },
      "stream": {
        "bands": 1,
        "noise": 2.2,
        "speed": 250,
        "spread": 3.5,
        "type": "signal"
      },
      "stringInput": "10, 10"
    },
    {
      "scenarioId": "csv_metric_values",
      "refId": "D",
      "alias": "Curve Y1",
      "csvWave": {
        "timeStep": 60,
        "valuesCSV": "0,0,2,2,1,1"
      },
      "hide": false,
      "lines": 10,
      "points": [],
      "pulseWave": {
        "offCount": 3,
        "offValue": 1,
        "onCount": 3,
        "onValue": 2,
        "timeStep": 60
      },
      "stream": {
        "bands": 1,
        "noise": 2.2,
        "speed": 250,
        "spread": 3.5,
        "type": "signal"
      },
      "stringInput": "70, 65"
    },
    {
      "scenarioId": "csv_metric_values",
      "refId": "E",
      "alias": "Curve X2",
      "csvWave": {
        "timeStep": 60,
        "valuesCSV": "0,0,2,2,1,1"
      },
      "hide": false,
      "lines": 10,
      "points": [],
      "pulseWave": {
        "offCount": 3,
        "offValue": 1,
        "onCount": 3,
        "onValue": 2,
        "timeStep": 60
      },
      "stream": {
        "bands": 1,
        "noise": 2.2,
        "speed": 250,
        "spread": 3.5,
        "type": "signal"
      },
      "stringInput": "20, 20"
    },
    {
      "scenarioId": "csv_metric_values",
      "refId": "F",
      "alias": "Curve Y2",
      "csvWave": {
        "timeStep": 60,
        "valuesCSV": "0,0,2,2,1,1"
      },
      "hide": false,
      "lines": 10,
      "points": [],
      "pulseWave": {
        "offCount": 3,
        "offValue": 1,
        "onCount": 3,
        "onValue": 2,
        "timeStep": 60
      },
      "stream": {
        "bands": 1,
        "noise": 2.2,
        "speed": 250,
        "spread": 3.5,
        "type": "signal"
      },
      "stringInput": "68,63"
    }
  ],
  "options": {
    "xAxis": {
      "minValue": 0,
      "maxValue": 60,
      "label": "Flowrate"
    },
    "yAxis": {
      "minValue": 0,
      "maxValue": 100,
      "label": "Pressure"
    },
    "performanceCurveData": [
      {
        "color": "rgba(136, 136, 136, 0.6)",
        "performCurveX": "10,20,30,40,50",
        "performCurveY": "80,78,72,62,48"
      }
    ],
    "dynamicPerfCurve": [
      {
        "fieldGroup": [
          {
            "xField": "Curve X1",
            "yField": "Curve Y1"
          },
          {
            "xField": "Curve X2",
            "yField": "Curve Y2"
          }
        ],
        "color": "#FADE2A"
      }
    ],
    "plotSetting": [
      {
        "color": "#F2495C",
        "label": "Label Name",
        "xField": "Field X",
        "yField": "Field Y"
      }
    ],
    "pointRadius": 4
  },
  "timeFrom": null,
  "timeShift": null,
  "datasource": null
}
Grafana Cloud Free
- Free tier: Limited to 3 users
- Paid plans: $55 / user / month above included usage
- Access to all Enterprise Plugins
- Fully managed service (not available to self-manage)
Self-hosted Grafana Enterprise
- Access to all Enterprise plugins
- All Grafana Enterprise features
- Self-manage on your own infrastructure
Installing PerfCurve on Grafana Cloud:
Installing plugins on a Grafana Cloud instance is a one-click install; same with updates. Cool, right?
Note that it could take up to 1 minute to see the plugin show up in your Grafana.
Installing plugins on a Grafana Cloud instance is a one-click install; same with updates. Cool, right?
Note that it could take up to 1 minute to see the plugin show up in your Grafana.
Installing plugins on a Grafana Cloud instance is a one-click install; same with updates. Cool, right?
Note that it could take up to 1 minute to see the plugin show up in your Grafana.
Installing plugins on a Grafana Cloud instance is a one-click install; same with updates. Cool, right?
Note that it could take up to 1 minute to see the plugin show up in your Grafana.
Installing plugins on a Grafana Cloud instance is a one-click install; same with updates. Cool, right?
Note that it could take up to 1 minute to see the plugin show up in your Grafana.
Installing plugins on a Grafana Cloud instance is a one-click install; same with updates. Cool, right?
Note that it could take up to 1 minute to see the plugin show up in your Grafana.
Installing plugins on a Grafana Cloud instance is a one-click install; same with updates. Cool, right?
Note that it could take up to 1 minute to see the plugin show up in your Grafana.
For more information, visit the docs on plugin installation.
Installing on a local Grafana:
For local instances, plugins are installed and updated via a simple CLI command. Plugins are not updated automatically, however you will be notified when updates are available right within your Grafana.
1. Install the Panel
Use the grafana-cli tool to install PerfCurve from the commandline:
grafana-cli plugins install The plugin will be installed into your grafana plugins directory; the default is /var/lib/grafana/plugins. More information on the cli tool.
Alternatively, you can manually download the .zip file for your architecture below and unpack it into your grafana plugins directory.
Alternatively, you can manually download the .zip file and unpack it into your grafana plugins directory.
2. Add the Panel to a Dashboard
Installed panels are available immediately in the Dashboards section in your Grafana main menu, and can be added like any other core panel in Grafana.
To see a list of installed panels, click the Plugins item in the main menu. Both core panels and installed panels will appear.
Change Log
v1.5.0 - 2021-02-14
Fixed
- Fix the bug which happens when the plugin is used in Grafana 8.x.
ADDED
- Add version dependency information in README.
- TestData DB sample in README.
v1.4.0 - 2021-02-14
Fixed
- Fix the bug which happens when the plugin is used in Grafana 7.4.x.
Changed
- Change devDependencies of "@grafana/data", "@grafana/toolkit" and "@grafana/ui".
v1.3.1 - 2021-01-16
Changed
- Change the options structures and appearance. (Compatible with the previous version)
v1.3.0 - 2020-11-25
Added
- Add MANIFEST file in dist directory to ensure that the distributed file is community level plugin.
v1.2.2 - 2020-10-17
Added
- Add screenshots.
v1.2.1 - 2020-10-16
Added
- Add how to use instruction in README.md.
Fixed
- Fix to indicate operation point with 0 value.
v1.2.0 - 2020-10-11
Added
- Show time stamp in tooltip.
v1.1.0 - 2020-10-03
Added
- Add tooltip.
- Add unit and decimal options to axes.
v1.0.0 - 2020-09-27
Added
- Add min. value option for x axis and y axis.
- Add dynamic performance curve.
Changed
- Change the options structures. (Not compatible with the previous version)
v0.1.1 - 2020-09-23
Fixed
- Fix id in plugin.json to follow metadata instruction.
v0.1.0 - 2020-09-23
- Initial Release

