
Grafana Plugin PerfCurve
Overview
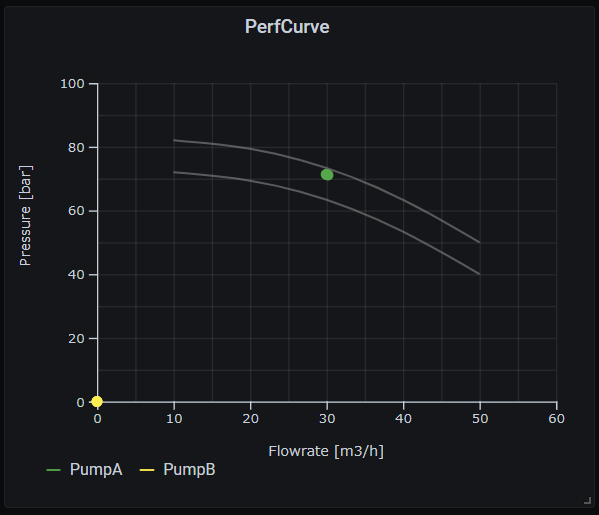
PerfCurve is a grafana panel plugin to plot operation point of rotating machine, such as pump, compressor and etc., on a canvas with its performance curves. You can draw multiple performance curves on the canvas only by giving sample points on the performance curve. The panel plugin connects sample points smoothly.
Important notes !!
Select the plugin version in accordance with the following rule.
- For Grafana >= 8.X.X, use version >= 1.5.X
- For Grafana >= 7.4.X, use version >= 1.4.X
- For Grafana <= 7.3.X, use version <= 1.3.X
Getting started
Axes
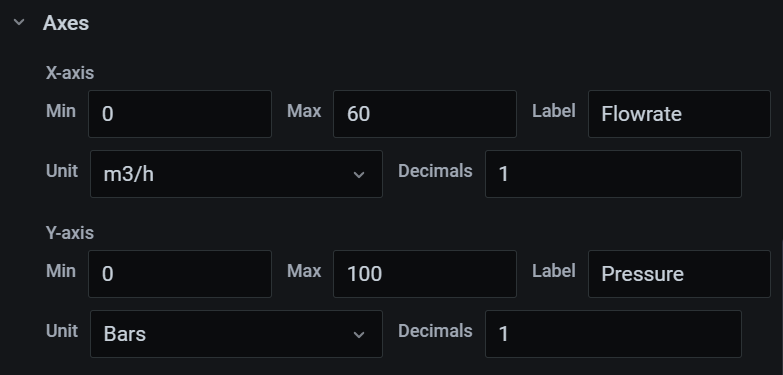
Specify Min., Max., Label, Unit and Decimals of X-axis amd Y-axis.
Static curve
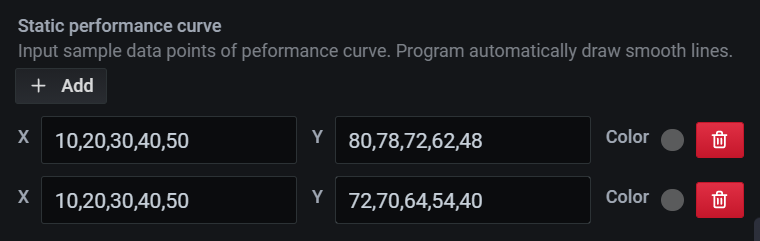
Add performance curves to the canvas by specifying sample points in comma separated value format.
The number of values in X input box and Y input Box shall be same.
Natural curves are drawn based on the sample points.
Dynamic curve (Advanced)
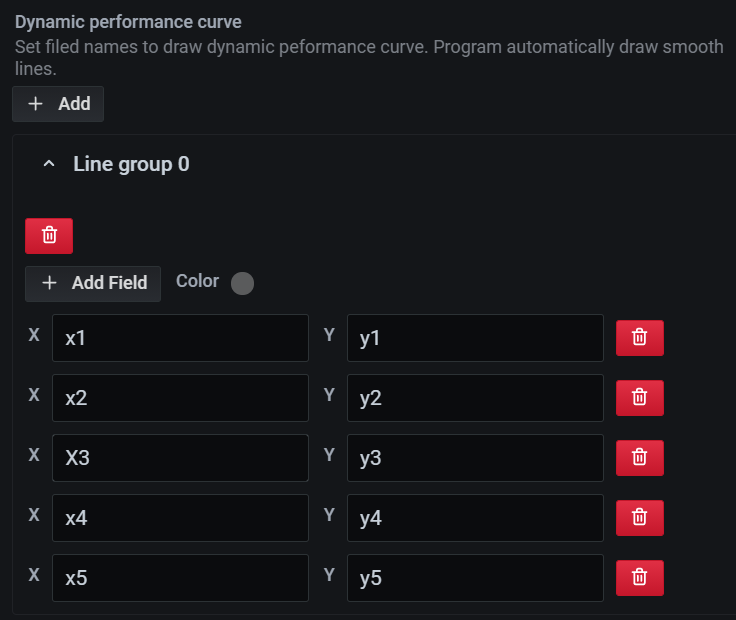
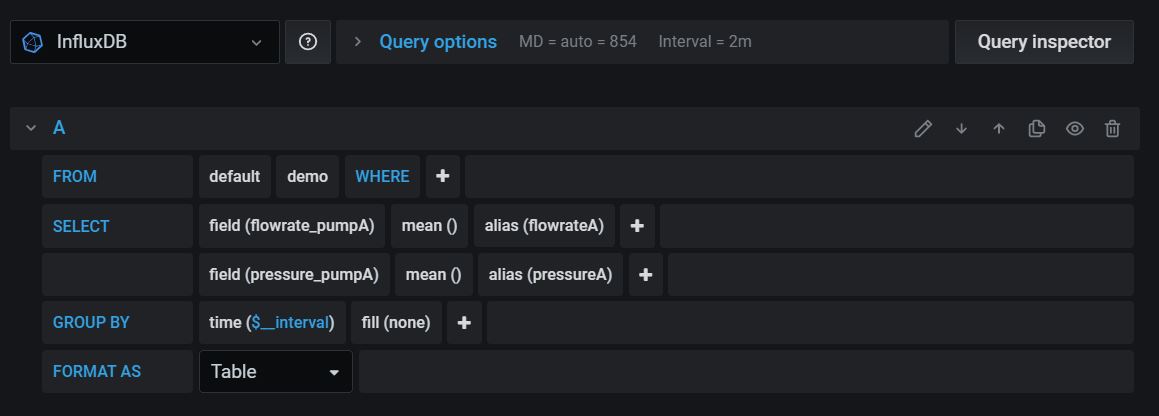
In case performance curve data is availble in database, they can be used to draw peformance curve which dynamically move based on the data. (Example of query is written for InfluxDB datasource.)

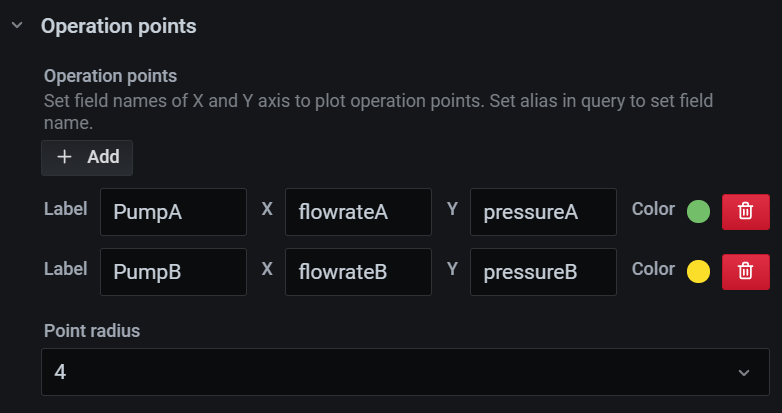
Operation points
Set field names for X box and Y box to plot operating points.
Set Label, Color and Point Radius, too.
Table format is recommended as query option.
Sample with TestData DB
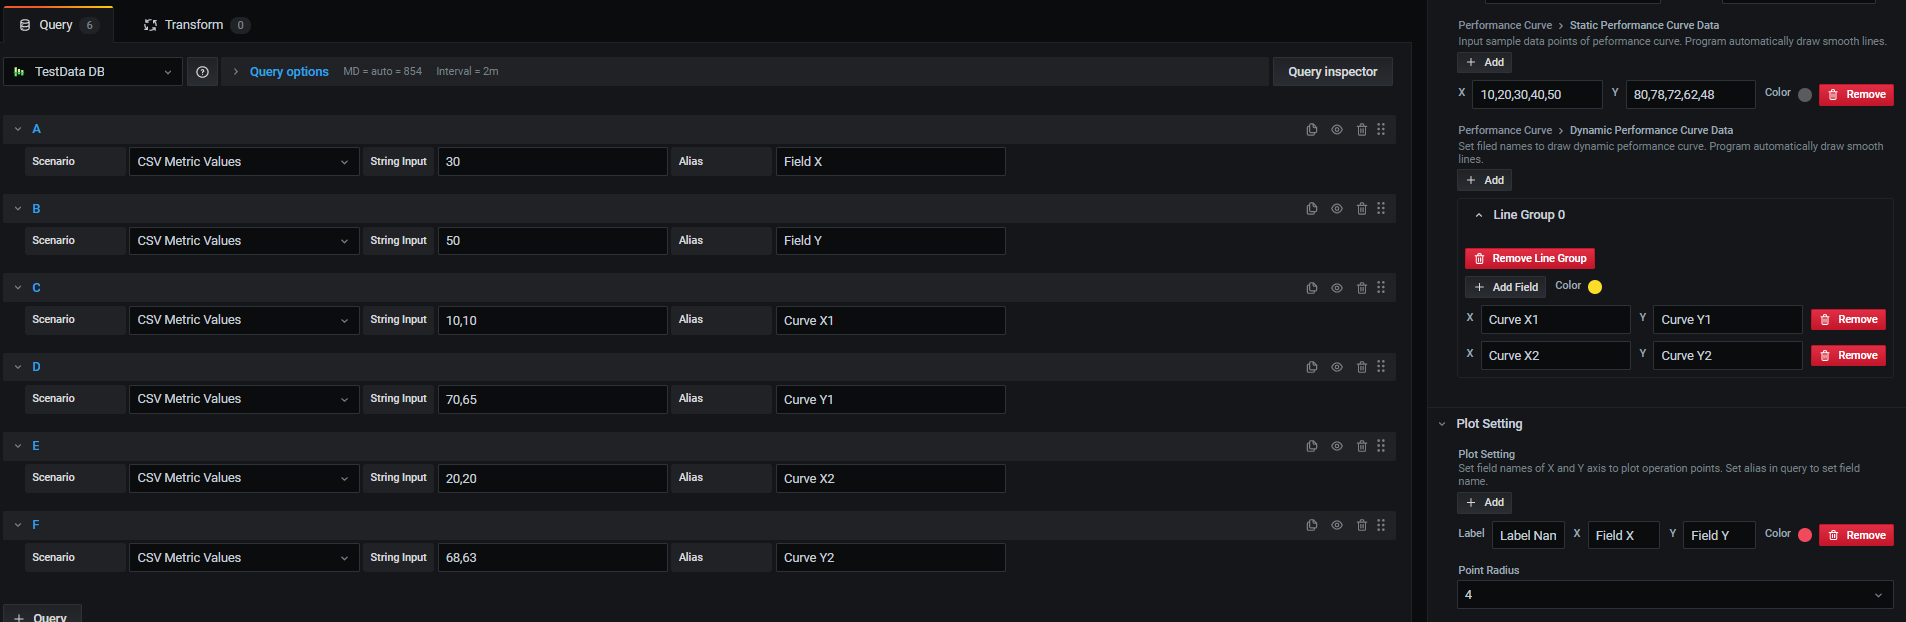
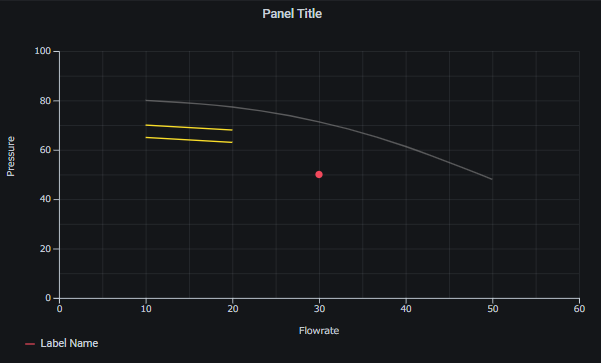
Refer to the attached sample input with TestData DB. TestData DB is available as default, if you add TestaData DB to data source.
Sample of Panel JSON:
{
  "id": 23763571993,
  "gridPos": {
    "h": 9,
    "w": 12,
    "x": 0,
    "y": 0
  },
  "type": "sskgo-perfcurve-panel",
  "title": "Panel Title",
  "pluginVersion": "7.5.6",
  "targets": [
    {
      "alias": "Field X",
      "csvWave": {
        "timeStep": 60,
        "valuesCSV": "0,0,2,2,1,1"
      },
      "lines": 10,
      "points": [],
      "pulseWave": {
        "offCount": 3,
        "offValue": 1,
        "onCount": 3,
        "onValue": 2,
        "timeStep": 60
      },
      "refId": "A",
      "scenarioId": "csv_metric_values",
      "stream": {
        "bands": 1,
        "noise": 2.2,
        "speed": 250,
        "spread": 3.5,
        "type": "signal"
      },
      "stringInput": "30"
    },
    {
      "alias": "Field Y",
      "csvWave": {
        "timeStep": 60,
        "valuesCSV": "0,0,2,2,1,1"
      },
      "hide": false,
      "lines": 10,
      "points": [],
      "pulseWave": {
        "offCount": 3,
        "offValue": 1,
        "onCount": 3,
        "onValue": 2,
        "timeStep": 60
      },
      "refId": "B",
      "scenarioId": "csv_metric_values",
      "stream": {
        "bands": 1,
        "noise": 2.2,
        "speed": 250,
        "spread": 3.5,
        "type": "signal"
      },
      "stringInput": "50"
    },
    {
      "scenarioId": "csv_metric_values",
      "refId": "C",
      "alias": "Curve X1",
      "csvWave": {
        "timeStep": 60,
        "valuesCSV": "0,0,2,2,1,1"
      },
      "hide": false,
      "lines": 10,
      "points": [],
      "pulseWave": {
        "offCount": 3,
        "offValue": 1,
        "onCount": 3,
        "onValue": 2,
        "timeStep": 60
      },
      "stream": {
        "bands": 1,
        "noise": 2.2,
        "speed": 250,
        "spread": 3.5,
        "type": "signal"
      },
      "stringInput": "10, 10"
    },
    {
      "scenarioId": "csv_metric_values",
      "refId": "D",
      "alias": "Curve Y1",
      "csvWave": {
        "timeStep": 60,
        "valuesCSV": "0,0,2,2,1,1"
      },
      "hide": false,
      "lines": 10,
      "points": [],
      "pulseWave": {
        "offCount": 3,
        "offValue": 1,
        "onCount": 3,
        "onValue": 2,
        "timeStep": 60
      },
      "stream": {
        "bands": 1,
        "noise": 2.2,
        "speed": 250,
        "spread": 3.5,
        "type": "signal"
      },
      "stringInput": "70, 65"
    },
    {
      "scenarioId": "csv_metric_values",
      "refId": "E",
      "alias": "Curve X2",
      "csvWave": {
        "timeStep": 60,
        "valuesCSV": "0,0,2,2,1,1"
      },
      "hide": false,
      "lines": 10,
      "points": [],
      "pulseWave": {
        "offCount": 3,
        "offValue": 1,
        "onCount": 3,
        "onValue": 2,
        "timeStep": 60
      },
      "stream": {
        "bands": 1,
        "noise": 2.2,
        "speed": 250,
        "spread": 3.5,
        "type": "signal"
      },
      "stringInput": "20, 20"
    },
    {
      "scenarioId": "csv_metric_values",
      "refId": "F",
      "alias": "Curve Y2",
      "csvWave": {
        "timeStep": 60,
        "valuesCSV": "0,0,2,2,1,1"
      },
      "hide": false,
      "lines": 10,
      "points": [],
      "pulseWave": {
        "offCount": 3,
        "offValue": 1,
        "onCount": 3,
        "onValue": 2,
        "timeStep": 60
      },
      "stream": {
        "bands": 1,
        "noise": 2.2,
        "speed": 250,
        "spread": 3.5,
        "type": "signal"
      },
      "stringInput": "68,63"
    }
  ],
  "options": {
    "xAxis": {
      "minValue": 0,
      "maxValue": 60,
      "label": "Flowrate"
    },
    "yAxis": {
      "minValue": 0,
      "maxValue": 100,
      "label": "Pressure"
    },
    "performanceCurveData": [
      {
        "color": "rgba(136, 136, 136, 0.6)",
        "performCurveX": "10,20,30,40,50",
        "performCurveY": "80,78,72,62,48"
      }
    ],
    "dynamicPerfCurve": [
      {
        "fieldGroup": [
          {
            "xField": "Curve X1",
            "yField": "Curve Y1"
          },
          {
            "xField": "Curve X2",
            "yField": "Curve Y2"
          }
        ],
        "color": "#FADE2A"
      }
    ],
    "plotSetting": [
      {
        "color": "#F2495C",
        "label": "Label Name",
        "xField": "Field X",
        "yField": "Field Y"
      }
    ],
    "pointRadius": 4
  },
  "timeFrom": null,
  "timeShift": null,
  "datasource": null
}
Grafana Cloud
Connect any plugin in Grafana Cloud.
- 150+ data source integrations
- Grafana Assistant - AI that correlates your data, builds queries, and answers questions
- 10k Prometheus metrics + 50 GB logs, traces, and profiles on the free tier
- ...and more
Insights
- Adoption
Running on 466 active Grafana instances.
- Activity
Last updated 11 Jan 2022.
0 releases in the past year.
- Version
- 1.5.0
- Dependencies
- Grafana >=7.0.0
- Developer
- sskgo
Grafana Cloud
Connect any plugin in Grafana Cloud.
- 150+ data source integrations
- Grafana Assistant - AI that correlates your data, builds queries, and answers questions
- 10k Prometheus metrics + 50 GB logs, traces, and profiles on the free tier
- ...and more