Plugins 〉SunBurst
SunBurst
grafana-sunburst-panel
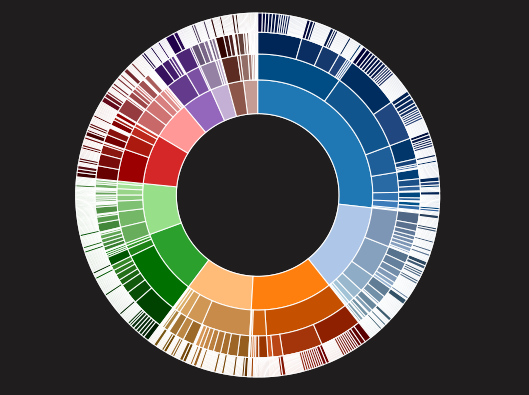
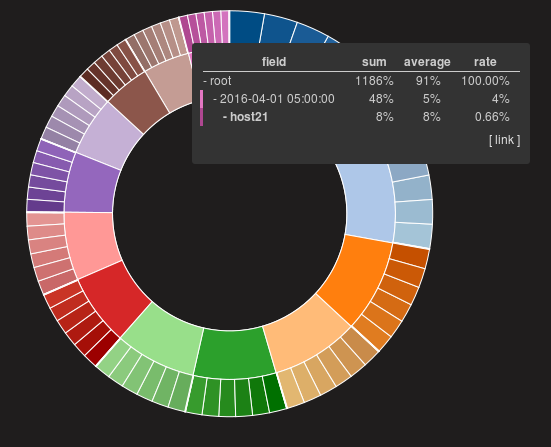
The sunburst panel is a multi-level pie chart. It can contain hierarchical data.
Features
Tooltip
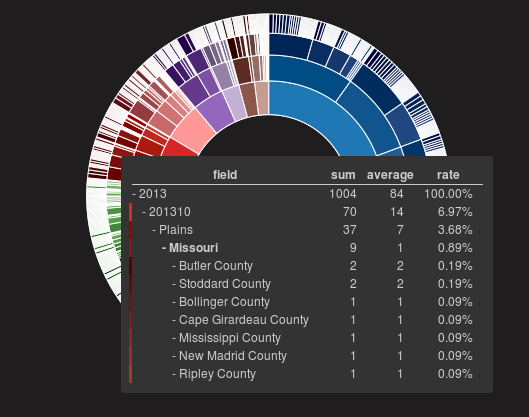
Tooltip is shown on mouse over of each arch node. Tooltip of a node shows information about same-leveled nodes and its child nodes.
| Description | |
|---|---|
| sum | The value of a node. If the node has children, the value of the node means sum of the values of its children. |
| average | If the node has children, the value of the node means average of the values of its children. |
| rate | The rate against the value of parent node. |
Drill down
If you click an node in the graph, the graph transforms to zoom and show the child nodes.

Options
Link template
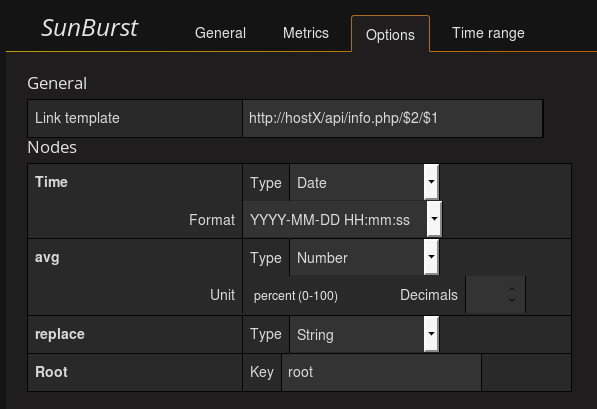
If link template isn't blank, tooltip contains a link with values of node and its ancectors. You can use $1, $2, $3 ... to add values to the link.
Nodes
You can specify fields' types of a node.
| Description | |
|---|---|
| Number | Add unit (%, $, bits/sec, ...) |
| String | Do nothing and just display. |
| Date | Convert numbers as unix timestamp to date text in specified format. |
Ex.)<br>
Supported datasources and formats
| Data source | TimeSeries | Table | Docs |
|---|---|---|---|
| ElasticSearch | OK | -- | OK |
| InfluxDB | OK | OK | -- |
| Sqldb (not released) | OK | OK | OK |
- Docs is the format returned by terms-aggregation in ElasticSearch.
License
Apache V2.0 License
Grafana Cloud Free
- Free tier: Limited to 3 users
- Paid plans: $55 / user / month above included usage
- Access to all Enterprise Plugins
- Fully managed service (not available to self-manage)
Self-hosted Grafana Enterprise
- Access to all Enterprise plugins
- All Grafana Enterprise features
- Self-manage on your own infrastructure
Installing SunBurst on Grafana Cloud:
Installing plugins on a Grafana Cloud instance is a one-click install; same with updates. Cool, right?
Note that it could take up to 1 minute to see the plugin show up in your Grafana.
Warning
Plugin installation from this page will be removed in February 2026. Use the Plugin Catalog in your Grafana instance instead. Refer to Install a plugin in the Grafana documentation for more information.
Installing plugins on a Grafana Cloud instance is a one-click install; same with updates. Cool, right?
Note that it could take up to 1 minute to see the plugin show up in your Grafana.
Installing plugins on a Grafana Cloud instance is a one-click install; same with updates. Cool, right?
Note that it could take up to 1 minute to see the plugin show up in your Grafana.
Warning
Plugin installation from this page will be removed in February 2026. Use the Plugin Catalog in your Grafana instance instead. Refer to Install a plugin in the Grafana documentation for more information.
Installing plugins on a Grafana Cloud instance is a one-click install; same with updates. Cool, right?
Note that it could take up to 1 minute to see the plugin show up in your Grafana.
For more information, visit the docs on plugin installation.
Installing on a local Grafana:
For local instances, plugins are installed and updated via a simple CLI command. Plugins are not updated automatically, however you will be notified when updates are available right within your Grafana.
1. Install the Panel
Use the grafana-cli tool to install SunBurst from the commandline:
grafana-cli plugins install The plugin will be installed into your grafana plugins directory; the default is /var/lib/grafana/plugins. More information on the cli tool.
Alternatively, you can manually download the .zip file for your architecture below and unpack it into your grafana plugins directory.
Alternatively, you can manually download the .zip file and unpack it into your grafana plugins directory.
2. Add the Panel to a Dashboard
Installed panels are available immediately in the Dashboards section in your Grafana main menu, and can be added like any other core panel in Grafana.
To see a list of installed panels, click the Plugins item in the main menu. Both core panels and installed panels will appear.


