Plugins 〉Status Overview Panel


Status Overview Panel


Status Overview Panel
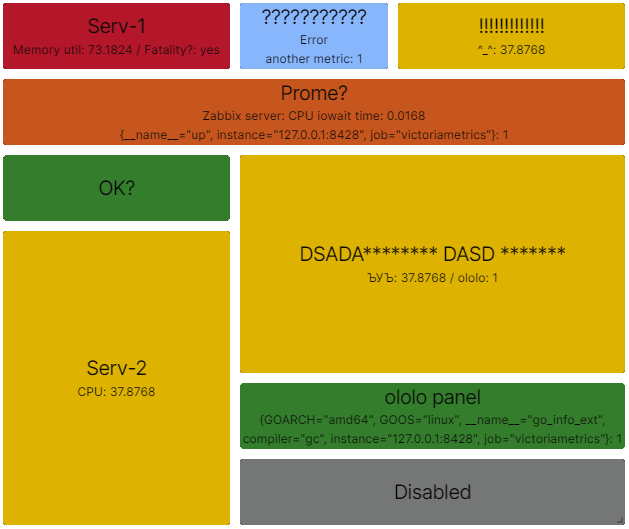
Status Overview Panel is an ideological continuation of the Status Panel plugin, written on the latest framework supported by Grafana. The plugin's task is to display the worst status of any component based on various metrics or one of the metrics of that component. In this context, the component can be any server, application, IT system, or anything else you can think of, combining metrics into a single entity. The main feature of the plugin is the visual representation of the component's status changes. We achieve this with a large panel displaying the component's name, the display of all metrics or metrics influencing the status change, as well as a flashing effect when the status changes. Audio notifications are also planned for the future.
More info on github Status-Overview-Panel
Preview
Grafana Cloud Free
- Free tier: Limited to 3 users
- Paid plans: $55 / user / month above included usage
- Access to all Enterprise Plugins
- Fully managed service (not available to self-manage)
Self-hosted Grafana Enterprise
- Access to all Enterprise plugins
- All Grafana Enterprise features
- Self-manage on your own infrastructure
Install on Grafana Cloud
Plugins can be installed directly from within your Grafana instance or automated using the Cloud API or Terraform.
Learn more about plugin installationMarketplace plugins
This is a paid plugin developed by a marketplace partner. To purchase an entitlement, sign in first, then fill out the contact form.
Get this plugin
This is a paid for plugin developed by a marketplace partner. To purchase entitlement please fill out the contact us form.
What to expect:
- Grafana Labs will reach out to discuss your needs
- Payment will be taken by Grafana Labs
- Once purchased the plugin will be available for you to install (cloud) or a signed version will be provided (on-premise)
Thank you! We will be in touch.
For more information, visit the docs on plugin installation.
Installing on a local Grafana:
For local instances, plugins are installed and updated via a simple CLI command. Plugins are not updated automatically, however you will be notified when updates are available right within your Grafana.
1. Install the Panel
Use the grafana-cli tool to install Status Overview Panel from the commandline:
grafana-cli plugins install The plugin will be installed into your grafana plugins directory; the default is /var/lib/grafana/plugins. More information on the cli tool.
Alternatively, you can manually download the .zip file for your architecture below and unpack it into your grafana plugins directory.
Alternatively, you can manually download the .zip file and unpack it into your grafana plugins directory.
2. Add the Panel to a Dashboard
Installed panels are available immediately in the Dashboards section in your Grafana main menu, and can be added like any other core panel in Grafana.
To see a list of installed panels, click the Plugins item in the main menu. Both core panels and installed panels will appear.
Changelog
[v0.0.4] (dev-release)
Released at 17-06-2023
Added
- Selecting metrics by regular expression
- Replacing the name of the metric by regular expression
Changed
- Changed error display for duplicate metrics
Fixed
- Small fixes
[v0.0.3] (dev-release)
Released at 11-05-2023
- Initial release.