Plugins 〉CDF - Cumulative Distribution Function


CDF - Cumulative Distribution Function


Cumulative Distribution Function (CDF) Panel
If you already know what a CDF is, you may skip the next sections and directly jump to the bottom to check out the steps to install this plugin.
What does the CDF panel plugin show?
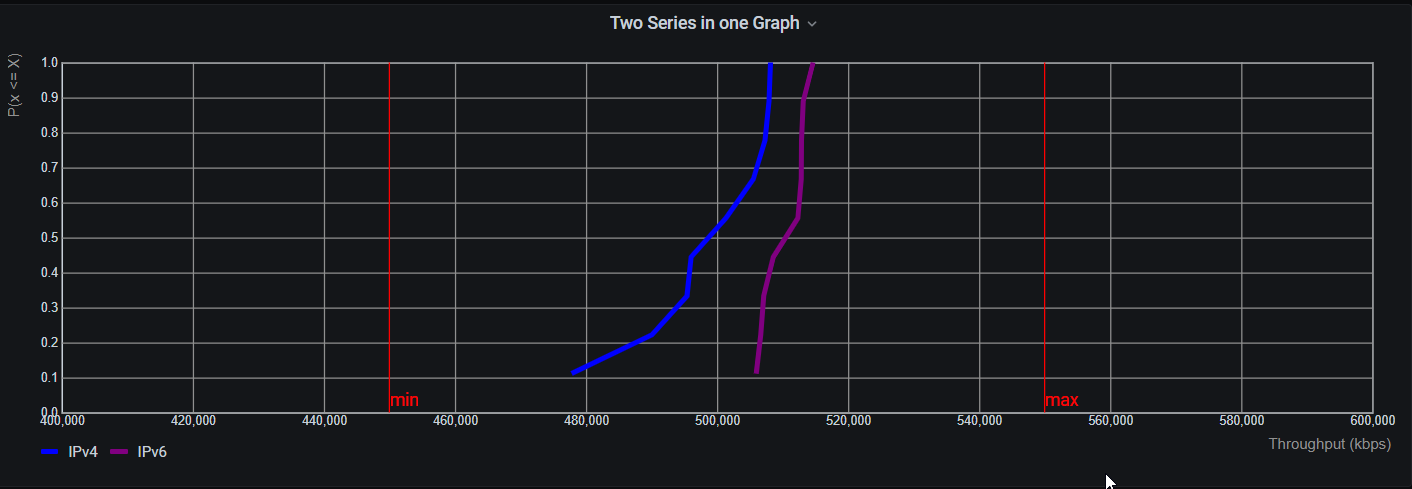
The CDF panel plugin visualizes the (complementary) cumulative distribution of a given series of values. Statistically speaking, it shows P(x <= X). It shows the frequency/probability P of a certain value "x" to be less than "X".

The CDF may be used to quantify the amount of outliers not fitting into the expection of the value distribution.
Example
A query responses with the following series:
| time | value |
|---|---|
| t1 | 1 |
| t2 | 5 |
| t3 | 3 |
| t4 | 2 |
The time values (t1, t2, t3, t4) are ignored and not processed. Only relevant are the values 1, 5, 3, 2. The probability of a value "x" to be less than X=3 is P(x <= 3) = 0.75 as the values 1, 2, 3 are equal or less than 3 and these are 3 out of 4 values.
Properties
If "x" is less than the smallest value of the series, the probability is zero. If "x" is larger or equal to the largest value of the seres, the probability is one.
How to use this panel?
This panel has been developed together with influxdb. However, as the series responds with a "number" series, any other db fulfilling this requirement is fine, too. Per query, the first "number" field is evaluated.
The panel displays on the x-axis, the value range and on the y-axis the probability from 0 to 1.
Config
This panel allows a flavor of config options:
X-Axis
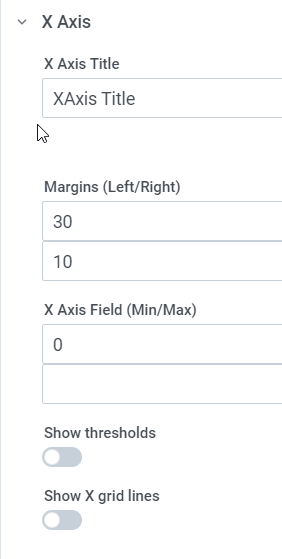
- Show grid
- Visualize thresholds on x-axis ..* min threshold with value and label ..* max threshold with value and label
- Change title
- Configurable range on x-axis
- Margins for proper vizualization
Y-Axis
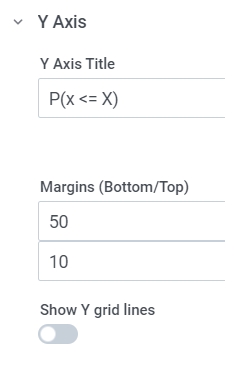
- Show grid
- Change title
- Margins for proper vizualization
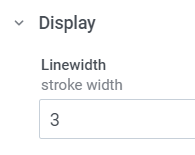
Display
- Change color per series
- Change stroke witdth
- Change to complementary distribution function 1-P(x <= X).
Contact
For feature request or bug reporting please use sebastian.gunreben@telekom.de.
Learn more
Contact
For feature requests or bug reports, please contact me directly
Grafana Cloud Free
- Free tier: Limited to 3 users
- Paid plans: $55 / user / month above included usage
- Access to all Enterprise Plugins
- Fully managed service (not available to self-manage)
Self-hosted Grafana Enterprise
- Access to all Enterprise plugins
- All Grafana Enterprise features
- Self-manage on your own infrastructure
Install on Grafana Cloud
Plugins can be installed directly from within your Grafana instance or automated using the Cloud API or Terraform.
Learn more about plugin installationMarketplace plugins
This is a paid plugin developed by a marketplace partner. To purchase an entitlement, sign in first, then fill out the contact form.
Get this plugin
This is a paid for plugin developed by a marketplace partner. To purchase entitlement please fill out the contact us form.
What to expect:
- Grafana Labs will reach out to discuss your needs
- Payment will be taken by Grafana Labs
- Once purchased the plugin will be available for you to install (cloud) or a signed version will be provided (on-premise)
Thank you! We will be in touch.
For more information, visit the docs on plugin installation.
Installing on a local Grafana:
For local instances, plugins are installed and updated via a simple CLI command. Plugins are not updated automatically, however you will be notified when updates are available right within your Grafana.
1. Install the Panel
Use the grafana-cli tool to install CDF - Cumulative Distribution Function from the commandline:
grafana-cli plugins install The plugin will be installed into your grafana plugins directory; the default is /var/lib/grafana/plugins. More information on the cli tool.
Alternatively, you can manually download the .zip file for your architecture below and unpack it into your grafana plugins directory.
Alternatively, you can manually download the .zip file and unpack it into your grafana plugins directory.
2. Add the Panel to a Dashboard
Installed panels are available immediately in the Dashboards section in your Grafana main menu, and can be added like any other core panel in Grafana.
To see a list of installed panels, click the Plugins item in the main menu. Both core panels and installed panels will appear.
Changelog
0.3.0
- bugfix when calculating xmin and xmax values
- cleanup
- bugfix: displayName is now considered
0.2.7
- bugfix: alias of series has not been considered
0.2.6
- bugfix: adapted name of series
0.2.5
- skipped
0.2.4
- feature: added scaling factor to handle very large/small numbers scaling factor in combination with labeling, makes the x axis more beautiful
0.2.3
- feature: thresholds on y axis added
- feature: min/max selection of y axis added
0.2.2
- version update
0.2.1
- bugfix: max/min value of data is now dynamically calculated
- feature: complementary function has been added
0.2.0
- release to publish
0.1.5
- bugfix: ShowThresholds with undefined values
- bugfix: adjustment of label positioning of xaxis labels for Firefox/Chrome
- addd: knobs to position and size xaxis/yaxis labels nicely
- plugin is signed
- updated logo
0.1.3
- updated README file, fixed links to images
- bugfix: TitleEditor, MarginEditor with proper handling of default values
0.1.2
- Initial Release
- CDF: cumulative distribution function panel plugin