Plugins 〉SCADAvis Synoptic Panel


SCADAvis Synoptic Panel

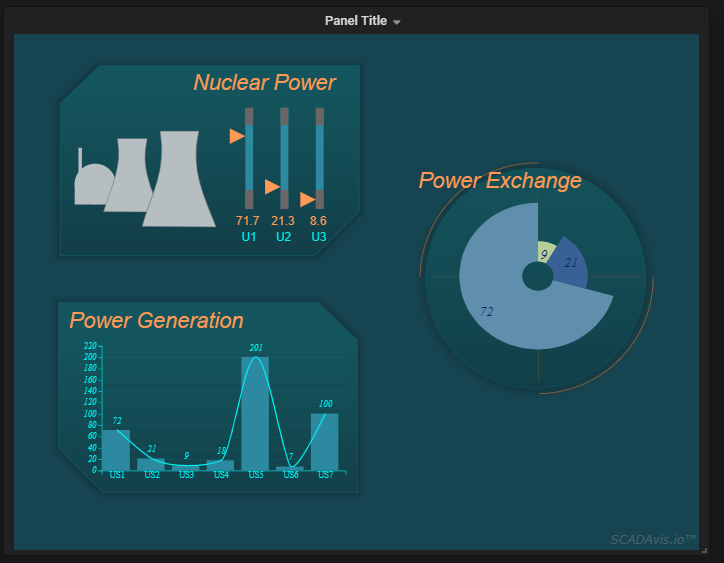
Powerful SCADA-like synoptic graphics panel for Grafana
This panel plugin allows unleashing the power of SCADA-like graphics in Grafana.
The SCADAvis.io online service provides an incredibly powerful SVG Editor that can be used to create free-form graphics animated with Grafana data.
Learn how to obtain and use the SCADAvis.io editor here.
In the SVG file, graphical objects should be marked with tags that match metrics or aliases names from Grafana data queries.
Step-by-step example:
- Create a new SVG file using the SCADAvis.io Synoptic Editor.
- Put a text object the top left position.
- Change the text to %f (use printf convention to format numbers).
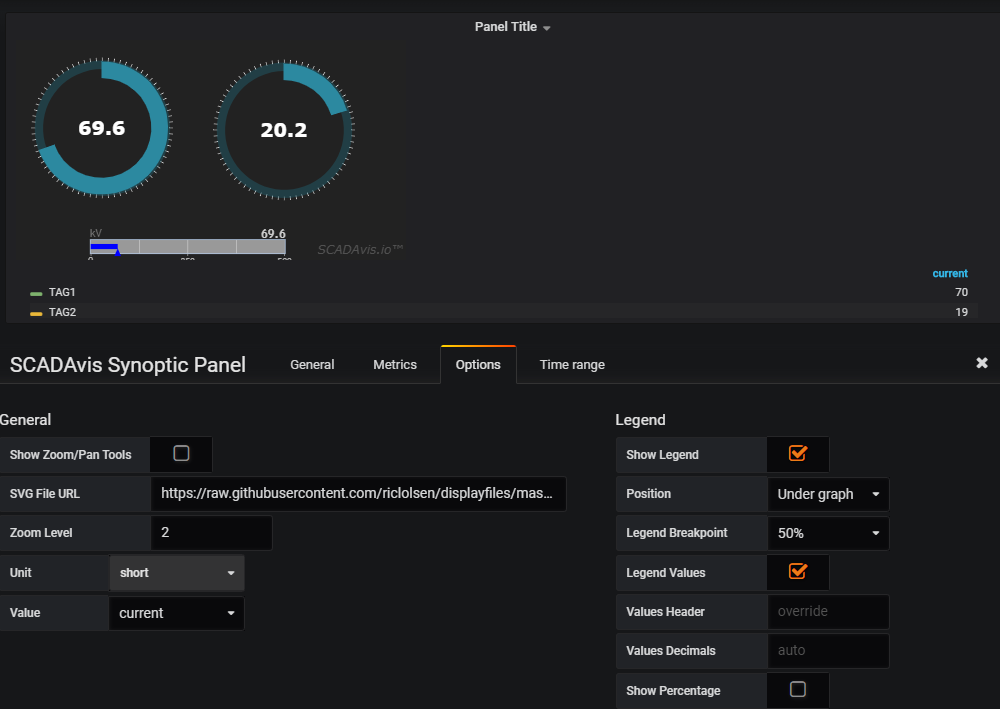
- Select the text object and click the right mouse button, choose "Object Properties".
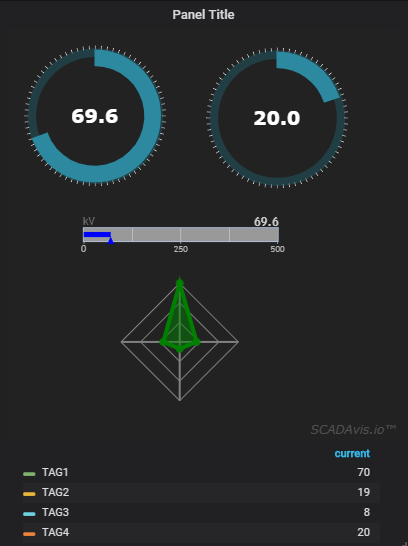
- Go to the "Get" tab and type in the "Tag" field some tag name such as "TAG1". Tags like "@1", "@2", etc. will link to 1st, 2nd, etc. data series available at runtime.
- Save the SVG file (do not change the default format).
- Edit the Grafana panel with the SCADAvis.io plugin.
- In the "Panel Options" tab, click the "Upload SVG file" button and choose your SVG file.
- In the "Query" panel choose a Data Source and use the tag name that is inside the SVG file (e.g. "TAG1") as the metric name. Example query: "SELECT <value column> as value, "TAG1" as metric FROM ...". Example data sources like "Random Walk" and "Live Measurements" will also work.
- Save the panel and it will display the value obtained from the query in the panel as a float value.
- There are many animations possible such as fill/stroke color, position, opacity, etc. (see "Learn" section on https://scadavis.io site).
This plugin uses IFrames, so it may be necessary to enable the "allow_embedding" Grafana config option.
In grafana.ini:
[security]
allow_embedding = true
Or with an environment variable:
GF_SECURITY_ALLOW_EMBEDDING=true
Installation
Use the new grafana-cli tool to install scadavis-synoptic-panel from the command line:
grafana-cli plugins install scadavis-synoptic-panel
The plugin will be installed into your grafana plugins directory; the default is /var/lib/grafana/plugins if you installed the grafana package.
More instructions on the cli tool can be found here.
Alternative installation method
It is also possible to clone this repo directly into your plugins directory.
Afterwards restart grafana-server and the plugin should be automatically detected and used.
git clone https://github.com/riclolsen/scadavis-synoptic-panel.git
sudo service grafana-server restart
Clone into a directory of your choice
If the plugin is cloned to a directory that is not the default plugins directory then you need to edit your grafana.ini config file (Default location is at /etc/grafana/grafana.ini) and add this:
[plugin.scadavis-synoptic-panel]
path = /home/your/clone/dir/scadavis-synoptic-panel
Notice that if you clone it into the grafana plugins directory you do not need to add the above config option. That is only if you want to place the plugin in a directory outside the standard plugins directory. Be aware that grafana-server needs read access to the directory.
Changelog
Version 2.0.2
- Fix file not found error when Grafana configured with "serve_from_sub_path = true".
Version 2.0.1
- Fix errors related to crypto.randomUUID on http servers.
Version 2.0.0
- Plugin updated for React.
- Internet connectivity not required.
- Compatible with Grafana 9.* and 10.*.
Version 1.0.4
- Added "Load SVG from local file" config option.
- Better auto resize handling.
- Internet connectivity required.
- Compatible also with Grafana 6.7, 7 and 8.
- For Grafana 7.* and 8.*, use this version and apply the "Prepare Time Series" / "Multi-frame time series" transform operation to the data source.
Version 1.0.3
- Added "Auto Resize" config option.
- Supported Grafana Templating Variables.
- More efficient data update and display rendering.
- Generic tagging (@1, @2, @3, ...) compatible with the Power BI plugin.
- Better responsiveness to configuration changes.
Version 1.0.2
- Better README.md.
Version 1.0.1
- Revised version. Watermark removed.
Version 1.0.0
- Initial version.
Grafana Cloud Free
- Free tier: Limited to 3 users
- Paid plans: $55 / user / month above included usage
- Access to all Enterprise Plugins
- Fully managed service (not available to self-manage)
Self-hosted Grafana Enterprise
- Access to all Enterprise plugins
- All Grafana Enterprise features
- Self-manage on your own infrastructure
Install on Grafana Cloud
Plugins can be installed directly from within your Grafana instance or automated using the Cloud API or Terraform.
Learn more about plugin installationMarketplace plugins
This is a paid plugin developed by a marketplace partner. To purchase an entitlement, sign in first, then fill out the contact form.
Get this plugin
This is a paid for plugin developed by a marketplace partner. To purchase entitlement please fill out the contact us form.
What to expect:
- Grafana Labs will reach out to discuss your needs
- Payment will be taken by Grafana Labs
- Once purchased the plugin will be available for you to install (cloud) or a signed version will be provided (on-premise)
Thank you! We will be in touch.
For more information, visit the docs on plugin installation.
Installing on a local Grafana:
For local instances, plugins are installed and updated via a simple CLI command. Plugins are not updated automatically, however you will be notified when updates are available right within your Grafana.
1. Install the Panel
Use the grafana-cli tool to install SCADAvis Synoptic Panel from the commandline:
grafana-cli plugins install The plugin will be installed into your grafana plugins directory; the default is /var/lib/grafana/plugins. More information on the cli tool.
Alternatively, you can manually download the .zip file for your architecture below and unpack it into your grafana plugins directory.
Alternatively, you can manually download the .zip file and unpack it into your grafana plugins directory.
2. Add the Panel to a Dashboard
Installed panels are available immediately in the Dashboards section in your Grafana main menu, and can be added like any other core panel in Grafana.
To see a list of installed panels, click the Plugins item in the main menu. Both core panels and installed panels will appear.
Changelog
Version 2.0.0
- Plugin updated for React.
- Internet connectivity not required.
- Compatible with Grafana 9.* and 10.*.
Version 1.0.4
- Added "Load SVG from local file" config option.
- Better auto resize handling.
- Internet connectivity required.
- Compatible also with Grafana 6.7, 7 and 8.
- For Grafana 7.* and 8.*, use this version and apply the "Prepare Time Series" / "Multi-frame time series" transform operation to the data source.
Version 1.0.3
- Added "Auto Resize" config option.
- Supported Grafana Templating Variables.
- More efficient data update and display rendering.
- Generic tagging (@1, @2, @3, ...) compatible with the Power BI plugin.
- Better responsiveness to configuration changes.
Version 1.0.2
- Better README.md.
Version 1.0.1
- Revised version. Watermark removed.
Version 1.0.0
- Initial version.