
Plugins 〉Redis Explorer

- Grafana, of course
- 10k series Prometheus metrics
- 50 GB logs
- 50 GB traces
- 2,232 app o11y host hours
- ...and more
No credit card needed, ever.
- Reduce metric cardinality by 30-50%
- Pay only for metrics you use
- Centralize control over your data in Grafana Cloud
Gain insight into unused metrics and optimize metric cardinality with the new cardinality management dashboards and Adaptive Metrics


Redis Explorer


Redis Explorer plugin for Grafana
![]()
![]()
![]()

Introduction
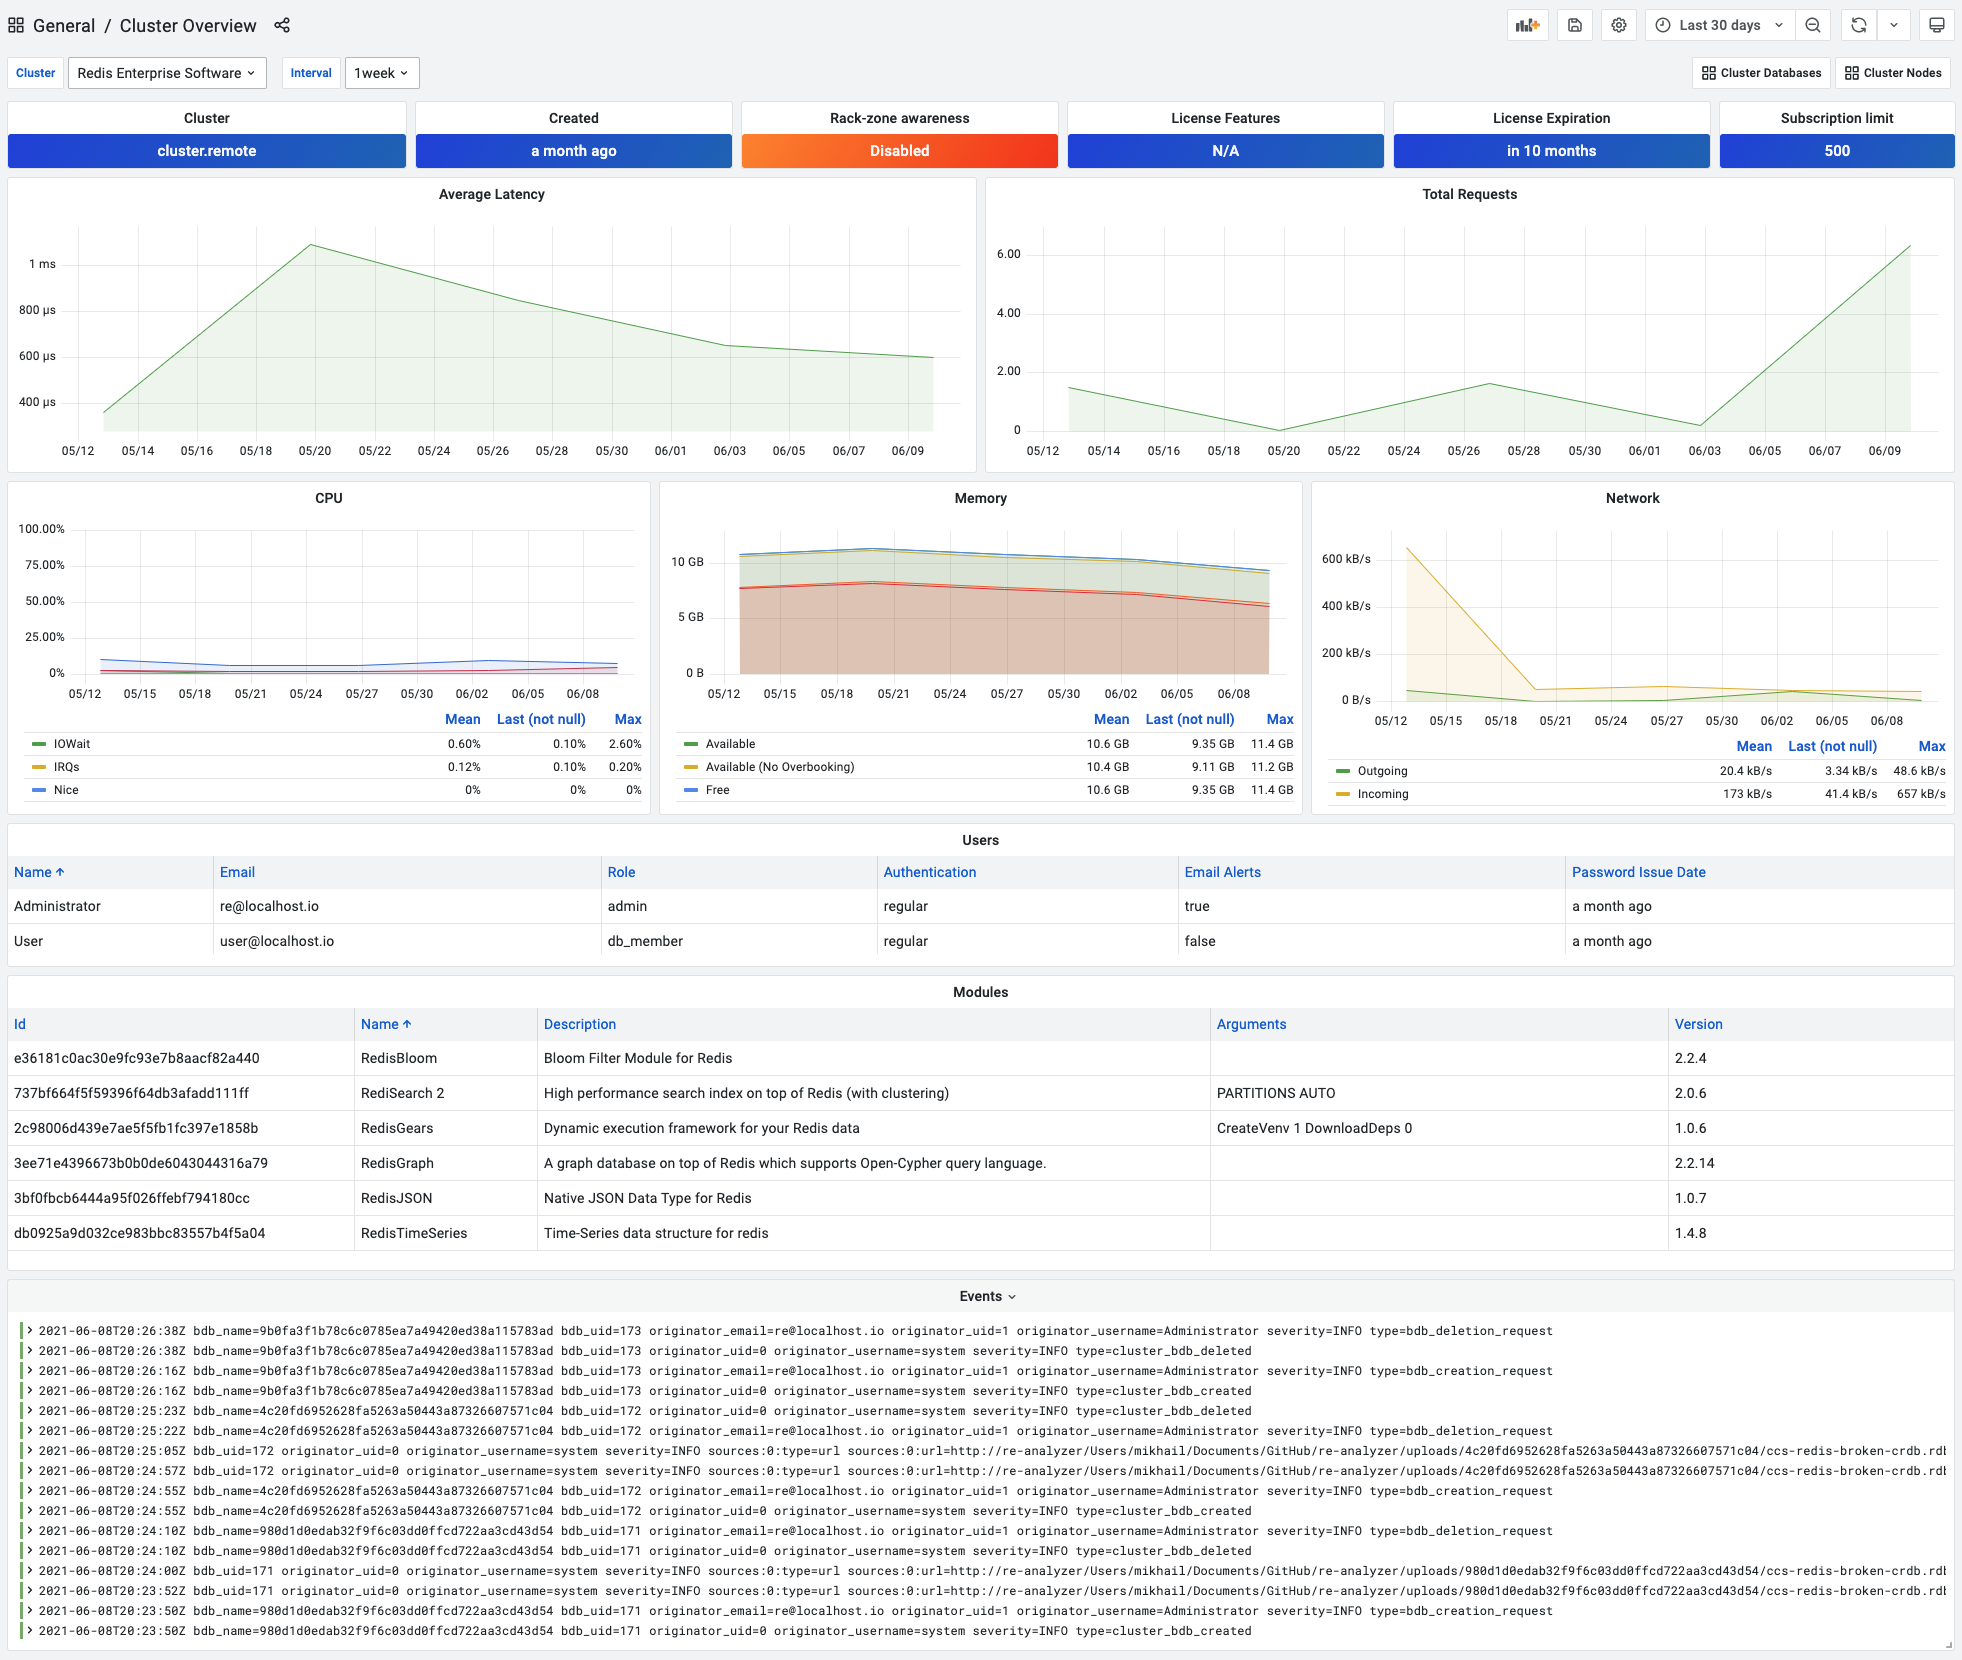
The Redis Explorer is a plugin for Grafana that connects to Redis Enterprise software clusters using REST API. It provides application pages to add Redis Data Sources for managed databases and dashboards to see cluster configuration.
Demo
Demo is available on demo.volkovlabs.io:
Requirements
- Grafana 8.0+ is required for Redis Explorer 2.X.
- Grafana 7.1+ is required for Redis Explorer 1.X.
Does Redis Explorer require anything special configured on the Redis Enterprise?
The Redis Explorer can connect to any Redis Enterprise software cluster version 5.4 and later. No unique configuration is required.
Getting Started
Redis Expolorer can be installed from the Grafana Marketplace or use the grafana-cli tool to install from the command line:
grafana-cli plugins install redis-explorer-app

For Docker instructions and installation without Internet access, follow the Quickstart page.
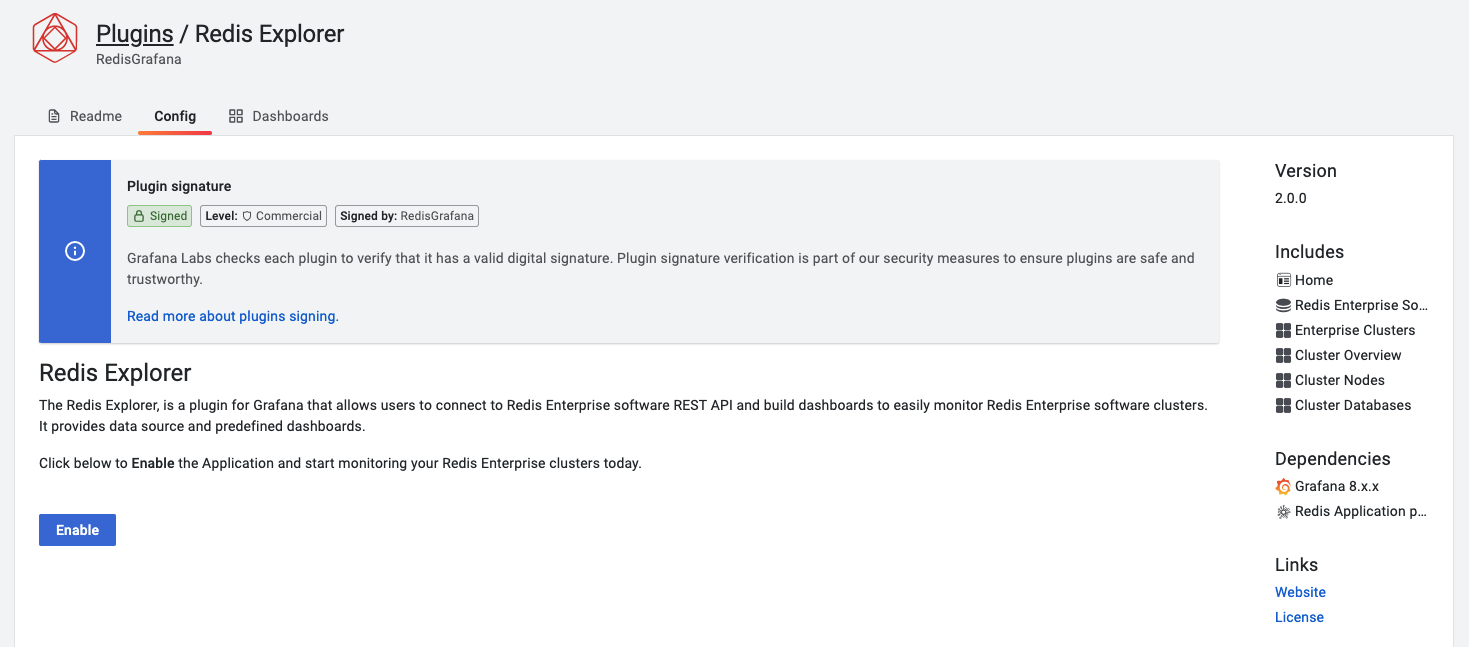
Open Grafana and enable Redis Explorer plugin
Open Grafana in your browser, enable Redis Explorer plugin, and configure Redis Enterprise Software Data Sources.
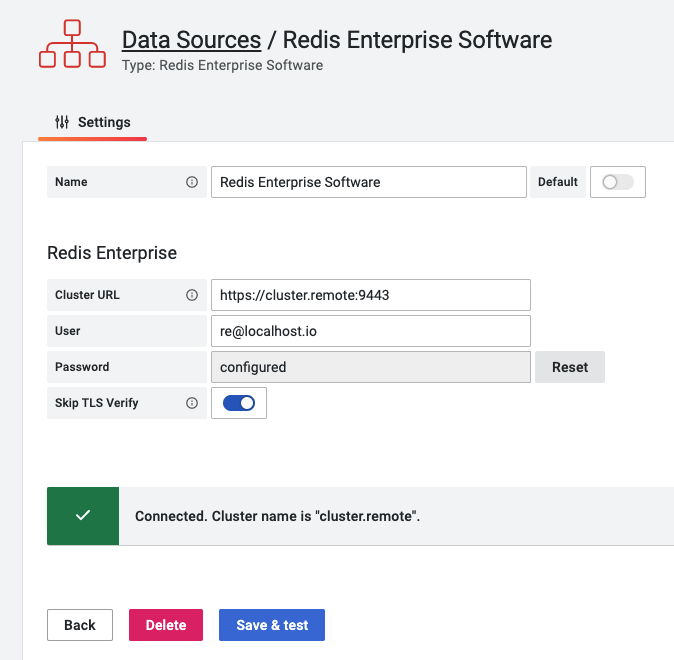
Redis Enterprise Software Data Source
Redis Enterprise Software Data Source is included in the Redis Explorer plugin and connects to Redis Enterprise software clusters using REST API. For detailed information, look at the Configuration page.
Documentation
Please look at the Documentation to learn more about the Redis Explorer plugin, Redis Enterprise Software data source, and provided dashboards.
Development
Developing Redis Explorer plugin page provides instructions on building the application and data source plugins.
Are you interested in the latest features and updates? Start nightly built Docker image for Redis Explorer plugin.
Feedback
We love to hear from users, developers, and the whole community interested in this plugin. These are various ways to get in touch with us:
- Ask a question, request a new feature, and file a bug with GitHub issues.
- Star the repository to show your support.
Contributing
- Fork the repository.
- Find an issue to work on and submit a pull request.
- Could not find an issue? Look for documentation, bugs, typos, and missing features.
License
- Apache License Version 2.0, see LICENSE.