
This plugin has been deprecated and is no longer maintained.
Grafana datasource for NetXMS open source monitoring system
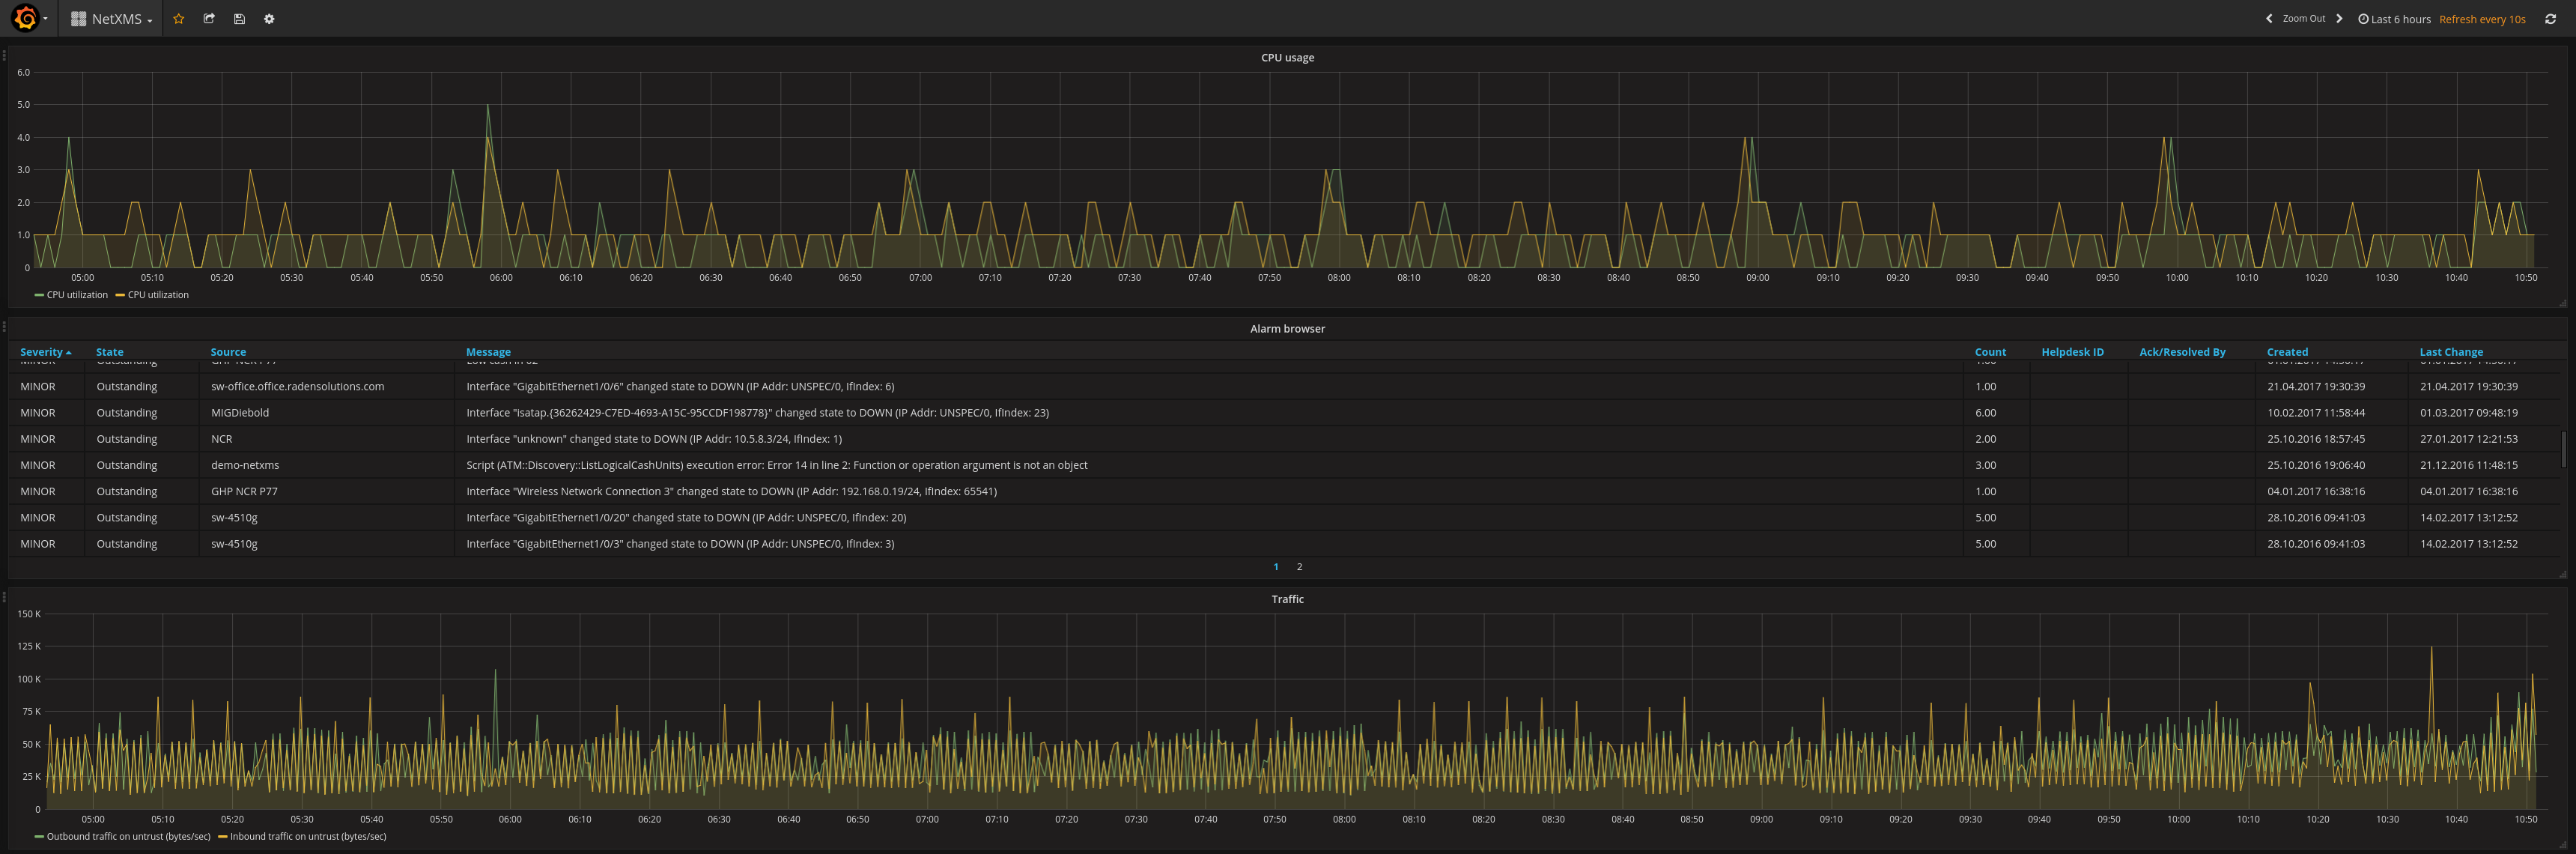
The datasource currently provides the following functionality:
- Visualisation of configured data collection items for objects in graphs and tables
- Listing of active alarms on a general or a per object basis
Installation instructions:
- Deploy netxms-websvc.war to any Java Servlet container of you liking (Jetty9, for example)
- Make sure API is working by requesting
/infopage with your browser
Using grafana-cli:
grafana-cli install radensolutions-netxms-datasource- Restart Grafana server
Manually:
- Clone the repository to your
$GRAFANA_HOME/data/plugins/datasourcesdirectory - Restart Grafana server
Configuration
- Login to your Grafana web interface
- Add the NetXMS datasource in the Data Sources section
- Specify API endpoint
- Select either "Basic Auth" in the "Auth" section or "With Credentials" if "Browser" access is used
Development instructions
- Clone the repository to your
$GRAFANA_HOME/data/plugins/datasourcesdirectory - run
yarnto download and install the required dependencies - run
gruntto update for changes in the source
Grafana Cloud
Connect any plugin in Grafana Cloud.
- 150+ data source integrations
- Grafana Assistant - AI that correlates your data, builds queries, and answers questions
- 10k Prometheus metrics + 50 GB logs, traces, and profiles on the free tier
- ...and more
Insights
- Adoption
Running on 554 active Grafana instances.
- Activity
Last updated 18 Jan 2024.
0 releases in the past year.
- Queries
0 total queries served across all Grafana Cloud instances.
- Version
- 1.2.3
- Developer
- Raden Solutions
Grafana Cloud
Connect any plugin in Grafana Cloud.
- 150+ data source integrations
- Grafana Assistant - AI that correlates your data, builds queries, and answers questions
- 10k Prometheus metrics + 50 GB logs, traces, and profiles on the free tier
- ...and more