Plugins 〉Percona


Percona
About
This app provides a set of dashboards for MySQL performance and system monitoring with Prometheus datasource.
The dashboards rely on alias label in the Prometheus config and depend from the small patch applied on Grafana.
Dashboards
- Cross Server Graphs
- Disk Performance
- Disk Space
- Galera Graphs
- MySQL InnoDB Metrics
- MySQL MyISAM Metrics
- MySQL Overview
- MySQL Performance Schema
- MySQL Query Response Time
- MySQL Replication
- MySQL Table Statistics
- MySQL User Statistics
- Prometheus
- Summary Dashboard
- System Overview
- TokuDB Graphs
- Trends Dashboard
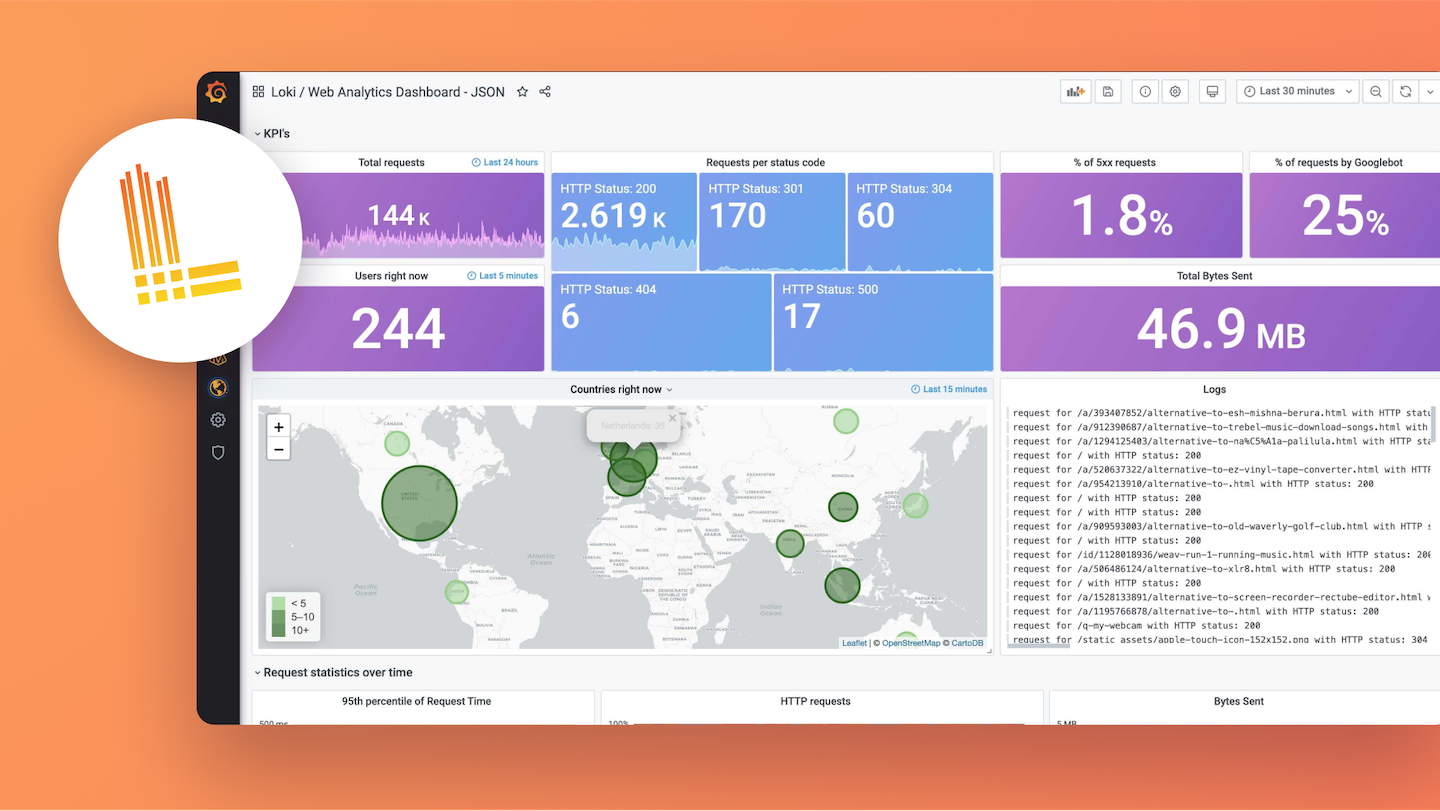
Screenshots


Setup instructions
Import dashboards
Enable the plugin and import the necessary dashboards from plugin's Dashboards tab.
Add Prometheus datasource
The datasource should be named Prometheus so it is automatically picked up by the graphs.
Prometheus configuration
The dashboards use alias label to work with individual hosts.
Ensure you have alias defined for each of your targets.
For example, if you want to monitor 192.168.1.7 the excerpt of the config will be look like this:
scrape_configs:
- job_name: prometheus
target_groups:
- targets: ['localhost:9090']
-
job_name: linux
target_groups:
- targets: [‘192.168.1.7:9100’]
labels:
alias: db1
-
job_name: mysql
target_groups:
- targets: [‘192.168.1.7:9104’]
labels:
alias: db1
Note, adding a new label to the existing Prometheus instance will introduce a mess with the time-series.
So it is recommended to start using alias from scratch.
How you name jobs is not important. However, "Prometheus" dashboard assumes the job name is prometheus.
Also it is assumed that the exporters are run at least with this minimal set of options:
- node_exporter:
-collectors.enabled="diskstats,filesystem,loadavg,meminfo,netdev,stat,time,uname,vmstat" - mysqld_exporter:
-collect.binlog_size=true -collect.info_schema.processlist=true
Apply Grafana patch
It is important to apply the following minor patch on your Grafana installation in order to use the interval template variable to get the good zoomable graphs. The fix is simply to allow variable in Step field of graph editor page. For more information, take a look at PR#3757 and PR#4257.
Run those 2 commands on top of your Grafana installation:
sed -i 's/expr=\(.\)\.replace(\(.\)\.expr,\(.\)\.scopedVars\(.*\)var \(.\)=\(.\)\.interval/expr=\1.replace(\2.expr,\3.scopedVars\4var \5=\1.replace(\6.interval, \3.scopedVars)/' /usr/share/grafana/public/app/plugins/datasource/prometheus/datasource.js
sed -i ’s/,range_input/.replace(/"{/g,"\"").replace(/}"/g,"\""),range_input/; s/step_input:""/step_input:this.target.step/’ /usr/share/grafana/public/app/plugins/datasource/prometheus/query_ctrl.js
Those changes are idemportent and do not break anything. No restart required.
Changelog
v1.0.0
- Initial version.
Grafana Cloud Free
- Free tier: Limited to 3 users
- Paid plans: $55 / user / month above included usage
- Access to all Enterprise Plugins
- Fully managed service (not available to self-manage)
Self-hosted Grafana Enterprise
- Access to all Enterprise plugins
- All Grafana Enterprise features
- Self-manage on your own infrastructure
Install on Grafana Cloud
Plugins can be installed directly from within your Grafana instance or automated using the Cloud API or Terraform.
Learn more about plugin installationMarketplace plugins
This is a paid plugin developed by a marketplace partner. To purchase an entitlement, sign in first, then fill out the contact form.
Get this plugin
This is a paid for plugin developed by a marketplace partner. To purchase entitlement please fill out the contact us form.
What to expect:
- Grafana Labs will reach out to discuss your needs
- Payment will be taken by Grafana Labs
- Once purchased the plugin will be available for you to install (cloud) or a signed version will be provided (on-premise)
Thank you! We will be in touch.
For more information, visit the docs on plugin installation.
Installing on a local Grafana:
For local instances, plugins are installed and updated via a simple CLI command. Plugins are not updated automatically, however you will be notified when updates are available right within your Grafana.
1. Install the Application
Use the grafana-cli tool to install Percona from the commandline:
grafana-cli plugins install The plugin will be installed into your grafana plugins directory; the default is /var/lib/grafana/plugins. More information on the cli tool.
Alternatively, you can manually download the .zip file for your architecture below and unpack it into your grafana plugins directory.
Alternatively, you can manually download the .zip file and unpack it into your grafana plugins directory.
2. Enable it
Next, log into your Grafana instance. Navigate to the Plugins section, found in your Grafana main menu.
Click the Apps tabs in the Plugins section and select the newly installed app.
To enable the app, click the Config tab. Follow the instructions provided with the application and click Enable. The app and any new UI pages are now accessible from within the main menu, as designed by the app creator.
If dashboards have been included with the application, they will attempt to be automatically installed. To view the dashboards, re-import or delete individual dashboards, click the Dashboards tab within the app page.