Plugins 〉Oracle Cloud Infrastructure Metrics


Oracle Cloud Infrastructure Metrics
About OCI Metrics plugin for Grafana
Introduction
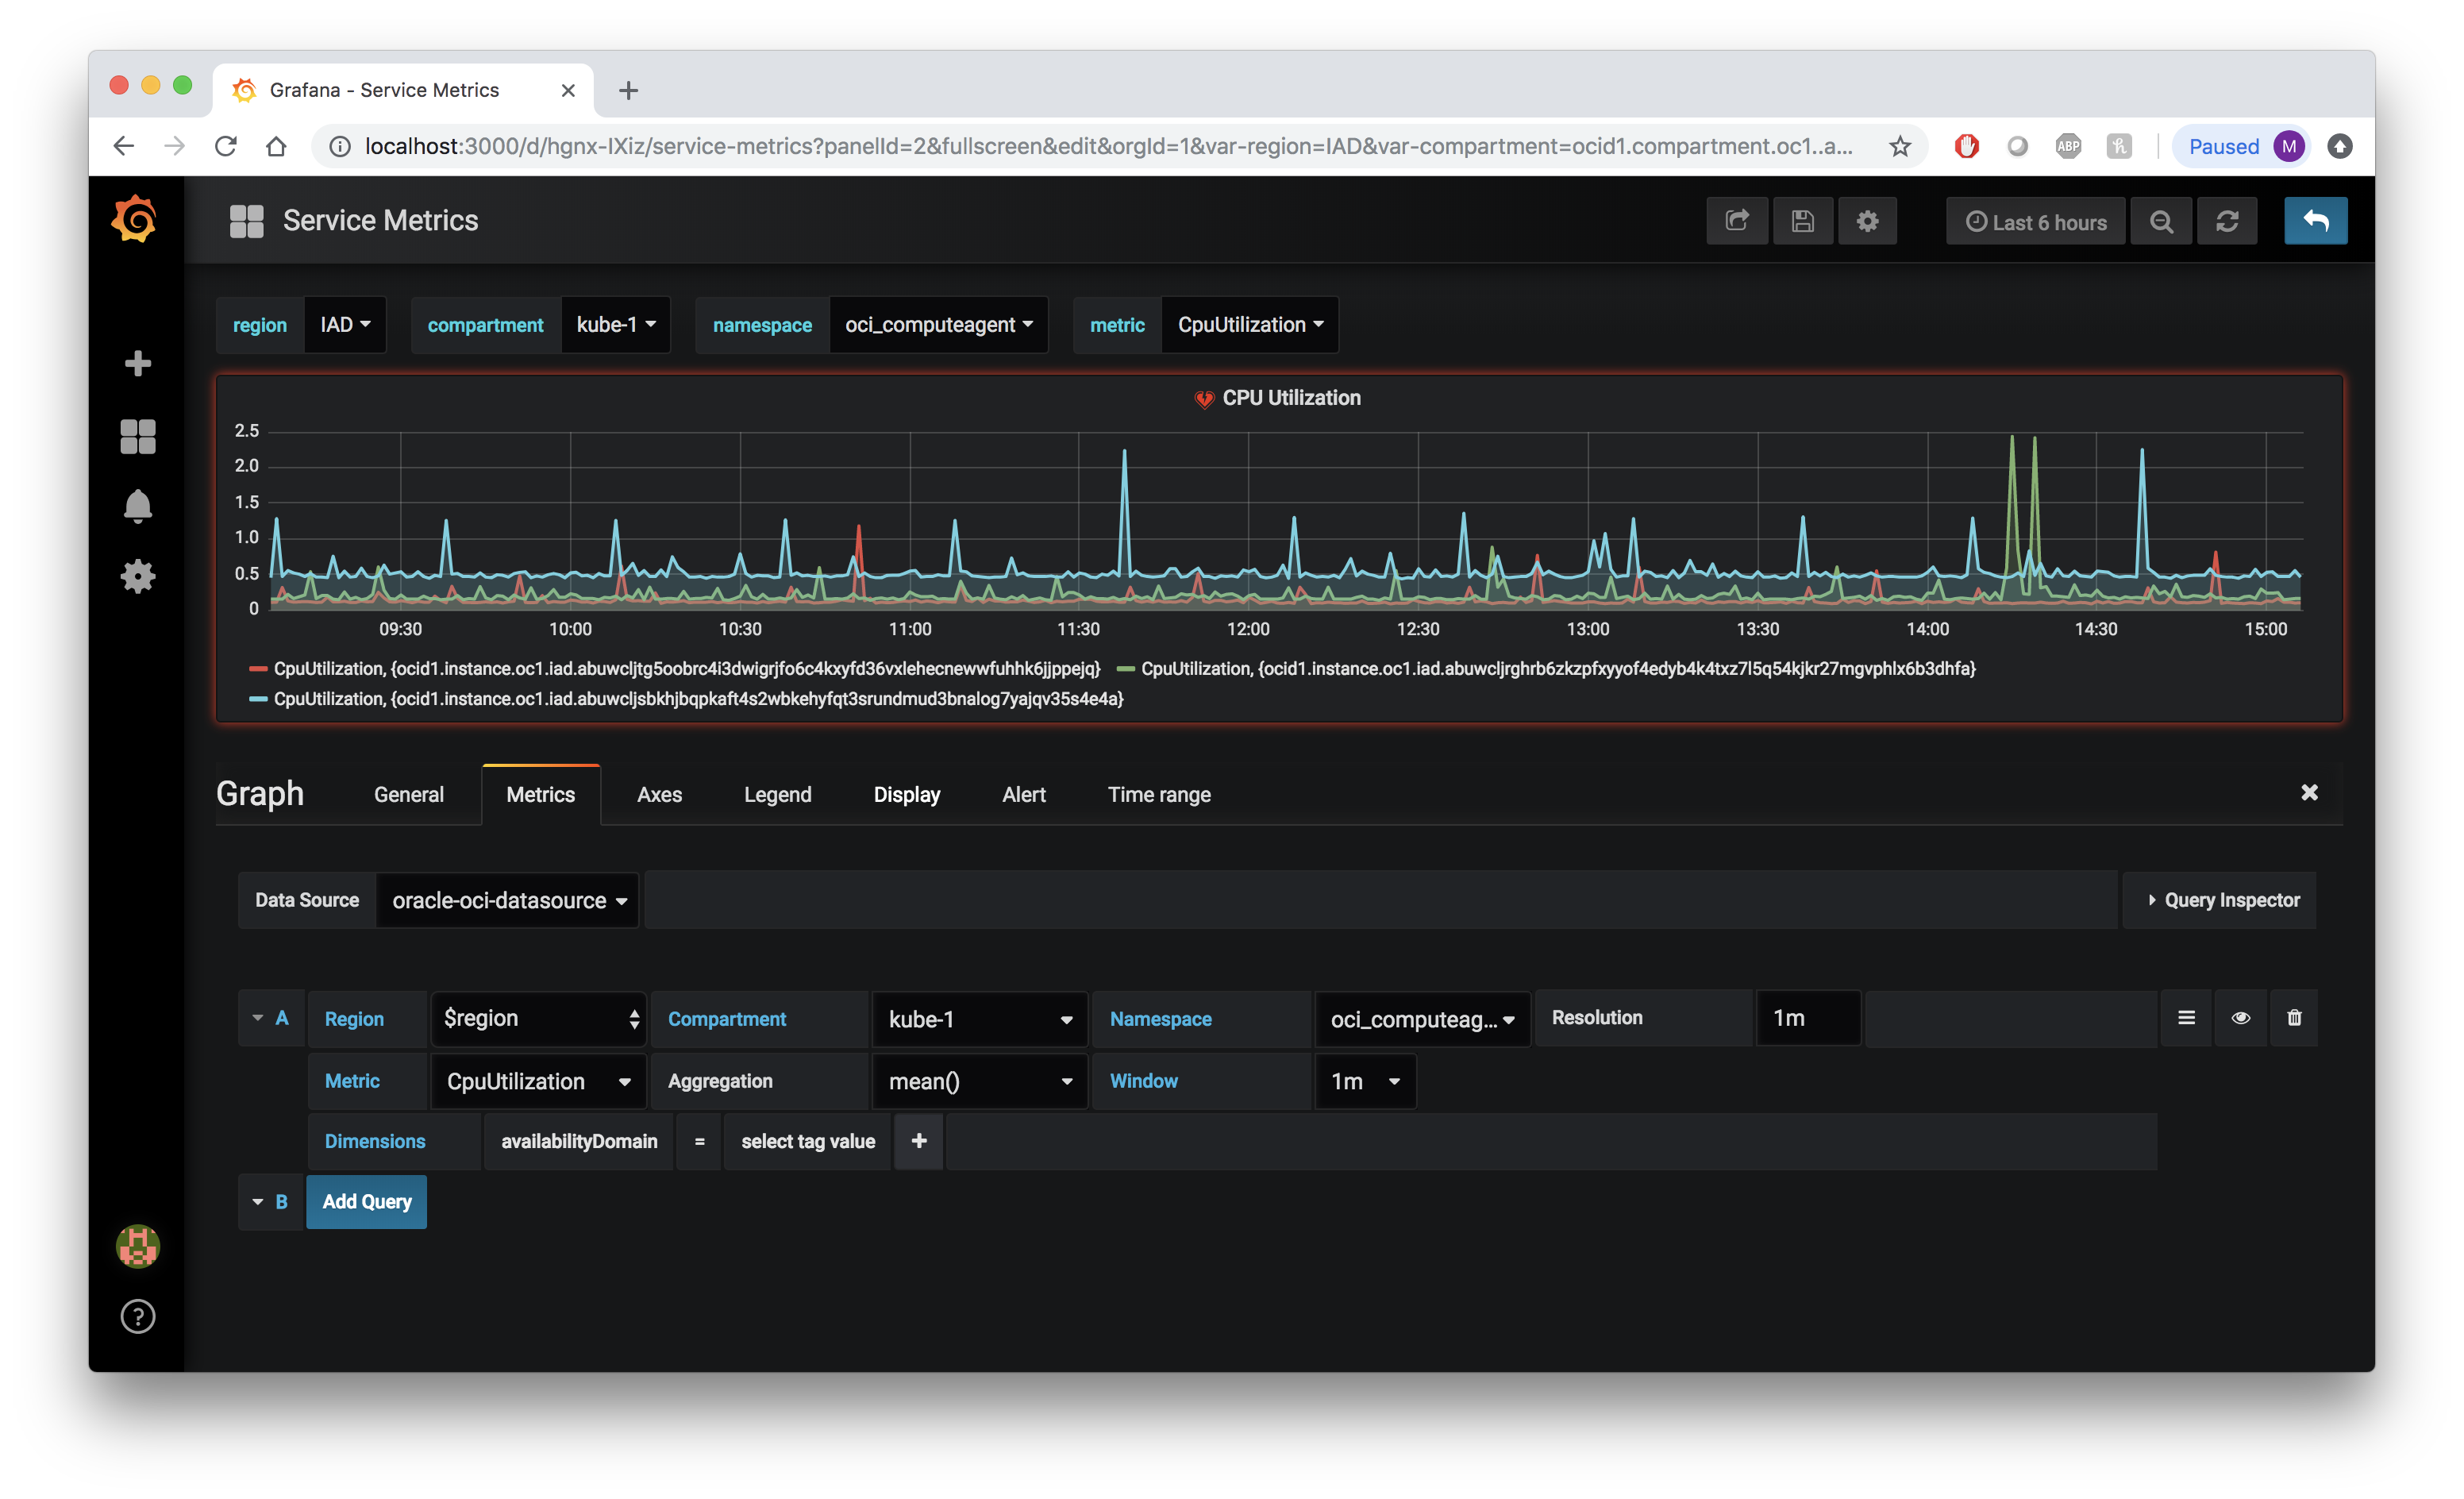
This plugin makes queries to the Oracle Cloud Infrastructure(OCI) Monitoring Service to fetch metrics for your OCI resources or your custom metrics in OCI. And then displays them on Grafana.
If you are running Grafana on a machine instance in Oracle Cloud, use the Instance Principal with a configured Dynamic Group and policy to allow you to read metrics and compartments.
If you are running Grafana anywhere else you'll need to get the necessary provider and resource settings, as described in this section Getting OCI Configuration values
Latest plugin version 5.X.X (available on Grafana Marketplace) is compatible with Grafana 10.
Breaking changes:
- In case you are migrating from a previous version (3.x.x or below) of the OCI Metrics Grafana Plugin and are not using Instance Principals (Environment not set as OCI instance), please refer to the Migration Instructions for Grafana OCI Metrics Data Source Settings (User Principals and Single Tenancy mode only) because you will have to reconfigure the plugin setup
- In case you are migrating from a previous version (4.x.x or below) of the OCI Metrics Grafana Plugin to version 5.x.x and your dashboard is using dimensions in its selectors or as its template variables, please refer to this section to modify your dashboard accordingly to the new dimensions selector.
Oracle Cloud Infrastructure Metrics plugin is datasource with backend type of Grafana plugin. Hereafter referred to as OCI Metrics plugin.
Installation
Please refers to the following compatibility matrix to choose plugin version accordingly to your Grafana installation: Compatibility Matrix
In order to simplify the installation process, we created detailed guides for you to follow.
Install Grafana and the OCI Metrics plugin on a Linux host using this document.
Install Grafana and the OCI Metrics plugin on Grafana Cloud using this document.
Install Grafana and the OCI Metrics plugin on a MacOS host using this document.
Install Grafana and the OCI Metrics plugin on a virtual machine in Oracle Cloud Infrastructure using this document.
Install Grafana and the OCI Metrics plugin on a virtual machine in Oracle Cloud Infrastructure using Terraform using this document.
Install Grafana and the OCI Metrics plugin on Kubernetes in Oracle Cloud Infrastructure using this document
Once you have the OCI Metrics Plugin installed, configure your datasource with your tenancy OCID, default region, and right IAM setup(Dynamic Group or OCI User Auth with local Private key file on Grafana Server node-depending where you're running the Grafana-Oracle Cloud or elsewhere).
We also have documentation for how to use the newly installed and configured plugin in our Using Grafana with OCI Metric Plugin walkthrough.
Note 1
If you're using a version of Grafana that's older than 6.0, you will need to download the zip file for plugin versions <=2.2.4 and install this plugin manually, or chmod the binary that is downloaded to make it executable.
Note 2
The OCI Metrics plugin supports the integration with Grafana Cloud with Data Source Environment configured as local. See this document for additional information.
Debugging
Please make sure that the golang version installed is 1.16 and grafana version installed is 8.x.x
If you want to debug golang backend plugin code, follow the steps below:
Install gops to list running go processes on your machine
Run
gopsand find processId foroci-plugin_darwin_amd64processCopy this processId to the
.vscode/launch.jsonIn your VSCode from 'Debug' menu call 'Start Debugging'
Documentation
Please refer to the docs folder in this repo
Help
Issues and questions about this plugin can be posted as an issue in this GitHub repository
Contributing
This project welcomes contributions from the community. Before submitting a pull request, please review our contribution guide
Security
Please consult the security guide for our responsible security vulnerability disclosure process.
License
Copyright (c) 2024 Oracle and/or its affiliates.
Released under the Universal Permissive License v1.0 as shown at
Grafana Cloud Free
- Free tier: Limited to 3 users
- Paid plans: $55 / user / month above included usage
- Access to all Enterprise Plugins
- Fully managed service (not available to self-manage)
Self-hosted Grafana Enterprise
- Access to all Enterprise plugins
- All Grafana Enterprise features
- Self-manage on your own infrastructure
Install on Grafana Cloud
Plugins can be installed directly from within your Grafana instance or automated using the Cloud API or Terraform.
Learn more about plugin installationMarketplace plugins
This is a paid plugin developed by a marketplace partner. To purchase an entitlement, sign in first, then fill out the contact form.
Get this plugin
This is a paid for plugin developed by a marketplace partner. To purchase entitlement please fill out the contact us form.
What to expect:
- Grafana Labs will reach out to discuss your needs
- Payment will be taken by Grafana Labs
- Once purchased the plugin will be available for you to install (cloud) or a signed version will be provided (on-premise)
Thank you! We will be in touch.
For more information, visit the docs on plugin installation.
Installing on a local Grafana:
For local instances, plugins are installed and updated via a simple CLI command. Plugins are not updated automatically, however you will be notified when updates are available right within your Grafana.
1. Install the Data Source
Use the grafana-cli tool to install Oracle Cloud Infrastructure Metrics from the commandline:
grafana-cli plugins install The plugin will be installed into your grafana plugins directory; the default is /var/lib/grafana/plugins. More information on the cli tool.
Alternatively, you can manually download the .zip file for your architecture below and unpack it into your grafana plugins directory.
Alternatively, you can manually download the .zip file and unpack it into your grafana plugins directory.
2. Configure the Data Source
Accessed from the Grafana main menu, newly installed data sources can be added immediately within the Data Sources section.
Next, click the Add data source button in the upper right. The data source will be available for selection in the Type select box.
To see a list of installed data sources, click the Plugins item in the main menu. Both core data sources and installed data sources will appear.
<a name="v6.5.6"></a>
Bug fix release (v6.5.6) - 08 Jul 2026
This release includes:
- Fixed compartment pagination so the initial OCI request omits the page token and subsequent requests use the token returned by OCI.
- Added one bounded retry when OCI rejects a pagination token, without caching partial compartment results.
[Changes][v6.5.6]
Security Maintenance release (v6.5.5) - 24 Jun 2026
This release includes:
- This release includes dependency remediation for OSV, Dependabot, and govulncheck security findings
- Security fix: upgraded
go.opentelemetry.io/otel/sdkfromv1.40.0tov1.43.0to remediate CVE-2026-39883. - Security fix: removed unused
@babel/preset-envdependency to eliminate the vulnerable@babel/plugin-transform-modules-systemjspath flagged for CVE-2026-44728. - Security fix: bumped
fast-urito4.0.0to remediate CVE-2026-6321 and CVE-2026-6322. - Security fix: bumped
form-datato4.0.6to remediate CVE-2026-12143. - Security fix: bumped
wsto8.21.0to remediate CVE-2026-48779. - Security fix: upgraded
github.com/grafana/grafana-plugin-sdk-gofromv0.290.1tov0.292.1. - Security fix: upgraded
golang.org/x/cryptotov0.52.0to remediate govulncheck findings GO-2026-5005, GO-2026-5006, GO-2026-5013, GO-2026-5014, GO-2026-5015, GO-2026-5016, GO-2026-5017, GO-2026-5018, GO-2026-5019, GO-2026-5020, GO-2026-5021, GO-2026-5023, and GO-2026-5033. - Security fix: added yarn resolutions for additional OSV/Dependabot npm findings:
@babel/core7.29.7,@opentelemetry/core2.8.0,@protobufjs/utf81.1.1,@tootallnate/once2.0.1,diff5.2.2,dompurify3.4.11,immutable4.3.8,js-cookie3.0.7,js-yaml4.2.0,lodash4.18.1,nanoid3.3.8,postcss8.5.10,prismjs1.30.0,protobufjs7.6.3,protocol-buffers-schema3.6.1,qs6.15.2,uplot1.6.31, anduuid11.1.1. - Tooling: bumped
typescriptto5.2.2and fixed theConfigEditorprops type soyarn typecheckpasses after the dependency updates.
[Changes][v6.5.5]
<a name="v6.5.4"></a>
Security Maintenance release (v6.5.4) - 05 May 2026
This release includes:
- Security fix: prevent credential exposure and SSRF via the region parameter
- Security fix: resolve infinite loop DoS in OCILoadSettings when all 6 profiles are configured
- Security fix: upgrade picomatch and serialize-javascript to address new advisories
- Backend logging: use correct levels and structured key-value format
[Changes][v6.5.4]
<a name="v6.5.3"></a>
Bug fix and security release (v6.5.3) - 01 Apr 2026
This release includes:
- Bug fix for issue #328: Explorer queries now use the selected region instead of always using the default/home region
- Added per-region client pool for thread-safe, concurrent multi-region support
- Fixed ALL_REGION aggregation to correctly query all subscribed regions
- Added sovereign cloud region discovery via AddRegionSchemaForPlc for DRCC/Alloy support
- Upgraded OCI Go SDK from v65.81.3 to v65.105.0
- Upgraded grafana-plugin-sdk-go from v0.250.0 to v0.290.1 to resolve CVE-2026-33186 (gRPC authorization bypass) and CVE-2026-24051 (OpenTelemetry SDK path hijacking)
- Bumped google.golang.org/grpc to v1.79.3 (CVE-2026-33186 fix)
- Added yarn resolutions for JS dev dependency vulnerabilities (form-data, flatted, minimatch, serialize-javascript)
- Added dev environment for multi-version Grafana plugin testing (v7.5, v9, v10, v11, v12)
<a name="v6.5.2"></a>
Security Maintenance release (v6.5.2) - 28 Feb 2025
This release includes:
- security patches
[Changes][v6.5.2]
<a name="v6.5.1"></a>
Security Maintenance release (v6.5.1) - 28 Feb 2025
This release includes:
- Bug fix for issue #311
- Bug fix for issue #309
[Changes][v6.5.1]
<a name="v6.5.0"></a>
Support for DRCC/Alloy Regions (v6.5.0) - 05 Feb 2025
This release includes:
- Support for DRCC/Alloy Regions
- Updated version of OCI Golang libraries to v65.81.3
- Some bug fixes
- Support for Custom Region
[Changes][v6.5.0]
<a name="v6.0.3"></a>
Security Maintenance release (v6.0.3) - 26 Nov 2024
This release includes:
- Implement a retry function for SummarizeMetrics operations
<a name="v6.0.2"></a>
Security Maintenance release (v6.0.2) - 14 Oct 2024
This release includes:
- security patches
- Added new regions
<a name="v6.0.1"></a>
Security Maintenance release (v6.0.1) - 03 Oct 2024
This release includes:
- security patches
<a name="v6.0.0"></a>
Security Maintenance release (v6.0.0) - 16 Sep 2024
This release includes:
- security patches
- React 18 upgrades
- Support for Grafana 11
- new regions added
- golang and typescript libraries updates
<a name="v5.5.1"></a>
Security Maintenance release (v5.5.1) - 03 Jul 2024
This release includes:
- few security patches
- bug fix in multiple tenancy test function
<a name="v5.5.0"></a>
Alert enabled and Cross Tenancy support (v5.5.0) - 15 May 2024
This release includes:
- Alert support
- Cross Tenancy Support in instance principal mode
- bug fixes
- security fixes
<a name="v5.5.0-beta-unsigned"></a>
Beta release which includes alerting support (v5.5.0-beta-unsigned) - 24 Apr 2024
************* WARNING ***********
This is a BETA release unsigned. It means is still not final, not ready for production and not signed. You must enable following option in grafana.ini in order to use this version: app_mode = development This version is NOT available in the Grafana catalogue yet, you need to manually install the plugin unzipping the binaries in your grafana plugin directory.
This beta includes alerting function.
<a name="v5.2.0"></a>
Multi region support and interval enhanced (v5.2.0) - 16 Apr 2024
This release includes:
- Multi Region support
- use of interval as template var
- Auto interval setting
- security fix in package babel-traverse, vulnerable to CVE-2023-45133
- enhanced error handling
- improved performances on queries
<a name="v5.1.1"></a>
Regex fix and Sovereign cloud support (v5.1.1) - 08 Mar 2024
Implements the following:
- Regex fix when using Compartments in Template vars
- Sovereign Cloud Support
- Explore issue when using Grafana version above v10.1
<a name="v5.1.0"></a>
Compartment regex fix and added new Sovereign regions (v5.1.0) - 07 Mar 2024
- Compartment regex fix.
- Added new Sovereign regions
<a name="v5.0.4"></a>
Added new regions for Data-source configuration (v5.0.4) - 20 Feb 2024
- Added new missing regions in Datasource Configuration
- Fixed a small bug in data source configuration page(src/ConfigEditor.tsx)
<a name="v5.0.3"></a>
Improved custom label management (v5.0.3) - 18 Jan 2024
This maintenance release includes:
Fix list of dimensions returned values from oci API in case of raw queries Fix sorting bug in case custom labels are used for non-indexed dimensions (for example for oci_autonomous_database)
<a name="v5.0.2"></a>
Raw query template vars (v5.0.2) - 10 Jan 2024
Raw query template vars
<a name="v5.0.1"></a>
Raw Mode and Custom metrics labeling (v5.0.1) - 09 Jan 2024
- Support for labeling on some custom metrics
- Support for Raw query mode
- Bug fixes and security fixes
<a name="v5.0.0"></a>
Grafana 10 support (v5.0.0) - 11 Oct 2023
- FE completely rewritten in React/Typescript
- Compatibility with Grafana 10
- Caching of region, tenancy, compartments, dimensions queries
- many performance improvements
- new Grafana API
<a name="v4.0.1"></a>
Upgrade nodejs dependencies and fix minor security bugs (v4.0.1) - 11 Apr 2023
- Upgraded nodejs dependencies
- Upgraded net golang libraries
<a name="v4.0.0"></a>
Multi-tenancy support and Secure JSON for OCI (v4.0.0) - 07 Mar 2023
This release features
- Multi-tenancy support
- Secure JSON secrets for OCI Configuration
- Added support for San Jose region
<a name="v3.0.6"></a>
Region list sort, Customization of labels, ARM64 support, Namespace drop-down field bug fix and vulnerability patches (v3.0.6) - 24 Oct 2022
- Customization of Graph labels (https://github.com/oracle/oci-grafana-metrics/pull/131)
- OCI region list sorted in alphabetical order (https://github.com/oracle/oci-grafana-metrics/pull/132)
- Updated GoLang and Javascript libraries, vulnerability patches (https://github.com/oracle/oci-grafana-metrics/pull/133, https://github.com/oracle/oci-grafana-metrics/pull/134, https://github.com/oracle/oci-grafana-metrics/pull/136, https://github.com/oracle/oci-grafana-metrics/pull/137, https://github.com/oracle/oci-grafana-metrics/pull/138, https://github.com/oracle/oci-grafana-metrics/pull/139, https://github.com/oracle/oci-grafana-metrics/pull/140)
- Metrics Namespace drop-down field bug fix (https://github.com/oracle/oci-grafana-metrics/pull/135)
- ARM64 support (https://github.com/oracle/oci-grafana-metrics/pull/129)
<a name="v3.0.5"></a>
v3.0.5 - Added new regions - 16 Jun 2022
New regions added:
- Singapore
- Paris
- Queretaro
Update Grunt version. Update Linux readme.
<a name="v3.0.4"></a>
Minor patch (v3.0.4) - 16 Mar 2022
Update build files, plugin.json
<a name="v3.0.3"></a>
Bugfix for template variables (v3.0.3) - 11 Feb 2022
Fixes issue with multiple data sources and template variables.
<a name="v3.0.2"></a>
Grafana 8 hotfix support (v3.0.2) - 10 Feb 2022
Stopgap solution for Grafana 8 support which may not be fully polished. Full support will be released later.
<a name="v2.2.4"></a>
UK Gov support added and dev changes (v2.2.4) - 09 Aug 2021
- Added support for uk gov regions
uk-gov-london-1 , uk-gov-cardiff-1
Dev changes :
- Removed toml file and replaced it with mod
- Added some for installation and signing.
For oracle grafana developers In the next release : Append the following to the build script zip -r oci-grafana-metrics-<VERSION> ./dist
<a name="v2.2.3"></a>
Missing metrics fixed (v2.2.3) - 22 Jan 2021
In test phase, please don't use in production
- Now, all the metrics are being received.
- The metrics request is 20x faster now.
- Signed the plugin and added to tar file.
<a name="v2.2.2"></a>
Fixed documentation w.r.t resource group (v2.2.2) - 11 Jan 2021
- Fixed documentation with resource group in each query
<a name="v.2.2.1"></a>
Added support for dubai, santiago and cadiff (v.2.2.1) - 22 Dec 2020
This release adds support to new regions such as santiago, cardiff and dubai
<a name="v2.2"></a>
ap-chiyoda-1 support added (v2.2) - 08 Dec 2020
- Supports calling Oracle Cloud Infrastructure services in the ap-chiyoda-1 region
<a name="2.0.2"></a>
Metrics plugin for grafana support (2.0.2) - 05 Oct 2020
Please download only the plugin file
This is not for all users
Please generate the manifest file and send us back in email
The version has been updated to 2.0.0 in plugin.json
<a name="v2.0.1"></a>
Logging-plugin-zip (v2.0.1) - 05 Oct 2020
- Not for all all users
- This is not associated with the current code
- Download only plugin.tar and other
- Only for grafana support
<a name="v2.0.0"></a>
v2.0.0 - 28 Sep 2020
Updated name and id of the plugin.
Please remove the existing plugin and install this version
There is no functional change.
<a name="v1.1.2"></a>
Support Grafana 7 (v1.1.2) - 07 Jul 2020
- Update docs for Grafana 7
- Expand the default region list.
- Fix resolution Input
<a name="v1.1.1"></a>
List metrics api call fix (v1.1.1) - 04 Jun 2020
- Now, the number of list metrics call has been set to a maximum of 20 pages
- The limit is configurable
<a name="v1.1.0"></a>
Support added for variables and auto in window & resolution (v1.1.0) - 06 Apr 2020
New Features
- Support added for variables and auto in window & resolution
Minor bug fixes
- Fixed variable duplication in dropdowns
Documentation
- Instructions added for using variables and auto-config in window and resolution of drop down
<a name="V1.0.9"></a>
Added a region option to getCompartment method (V1.0.9) - 12 Mar 2020
When OCI tenancy is provision with a single region, say 'us-phoenix-1' (home tenancy) and the datasource setting with local has the default regions as 'us-ausburn-1' (in the ~/.oci/config file), the getCompartment does not return the compartment list. The reason being the OCI tenancy has only one tenancy as home and that is not the 'us-phoenix-1' tenancy.
The fix is to set region to the home regions of the OCI tenancy, while making the getCompartment call.
Thanks Jayesh Patel
<a name="V1.0.8"></a>
Support Resource Group (V1.0.8) - 10 Mar 2020
User will be able to use Resource Group. By Default: No Resource Group
<a name="V1.0.7"></a>
V1.0.7 - 21 Feb 2020
Fix populated Metric Fields based on the selected region.
<a name="V1.0.6"></a>
Support hard coded values in template variables (V1.0.6) - 23 Jan 2020
- Support hard coded values in template variables
- Fix bug with filtering compartments by regex in template variable editor
<a name="V1.0.5"></a>
Manual query support. New template variables for dimensions. (V1.0.5) - 25 Nov 2019
- New template variables were added:
dimensions()which show all possible dimension keys for selected region, compartment, namespace and metricdimensionOptions()which show all possible dimension values for selected region, compartment, namespace, metric and dimension key.
Dimension value variable can be used as multi-value. Separate queries are generated for each dimension value out of multi-select (but no more than 20 queries)
Custom query is supported. User can type MQL expression manually which will be passed to telemetry instead of selected on the UI metric and dimensions.
Custom template variables were added to the list of dimension value options. Duplicate options are removed.
Options for regions and compartments are cached while query editor is open. Dimension options are cached for the selected region - compartment - namespace - metric.
<a name="V1.0.4"></a>
Fix $namespace and $metric variables (V1.0.4) - 03 Oct 2019
$namespace
In the previous version, the list of namespaces was hardcoded for the $namespace variable.
Today the list of namespaces depends on region and compartment.
$metric
In the previous version, the $metric variable depends on the home region, $compartment and hardcoded $namespace.
Today $metric depends on $region, $compartment and $namespace.
<a name="V1.0.3"></a>
V1.0.3 - 25 Sep 2019
Fix issue: Metric name rule creation updated
<a name="v1.0.2"></a>
v1.0.2 - 27 Mar 2019
- Shows subcompartments and removes inactive compartments from that list
- Changes Metric names when rendering on the screen, uses a human readable name for the resource if one is present
- Shortens ocids to first three and last six characters to save screen real estate
<a name="v1.0.1"></a>
v1.0.1 - 08 Mar 2019
Pulls in regions dynamically Adds more documentation
<!-- Generated by https://github.com/rhysd/changelog-from-release v3.7.2 -->