Plugins 〉Oracle Cloud Infrastructure Logs


Oracle Cloud Infrastructure Logs
Oracle Cloud Infrastructure Logging Data Source
Introduction
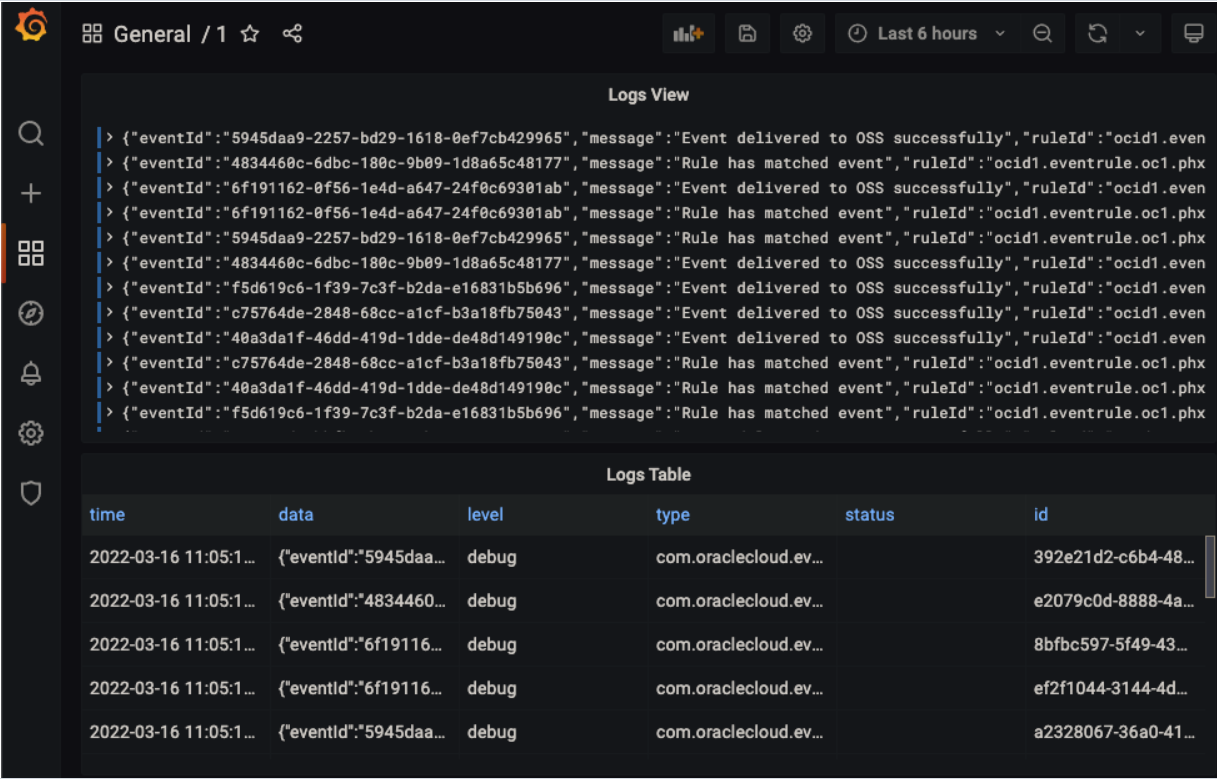
Grafana is a popular technology that makes it easy to visualize logs and metrics. The OCI Logging Grafana Plugin can be used to extend Grafana by adding Oracle Cloud Infrastructure Logging as a data source in Grafana.
The plugin allows you to retrieve logs related to a number of resources on Oracle Cloud: Compute, Networking, Storage, custom logs from your application, and audit logs generated by Oracle Cloud services. Once these logs are in Grafana, they can be analyzed along with metrics, giving you a single pane of glass for your application monitoring needs.
Latest plugin version 4.X.X (available on Grafana Marketplace) is compatible with Grafana 10.
Breaking change! In case you are migrating from a previous version (2.x.x or below) of the OCI Logging Grafana Plugin and are not using Instance Principals (Authentication Provider not set as OCI instance), please refer to the Migration Instructions for Grafana OCI Logging Data Source Settings (User Principals and Single Tenancy mode only) because you will have to reconfigure the plugin setup.
For custom logs from your application, see Custom Logging on OCI.
Prerequisites
We will discuss two different Grafana IAM configurations that need to be in place, for Grafana to fetch the logs from Oracle Cloud Logging Service.
For local/dev box environment and Grafana Cloud
Installation
Please refers to the following compatibility matrix to choose plugin version accordingly to your Grafana installation: Compatibility Matrix
In order to simplify the installation process, we created detailed guides for you to follow.
Depending on your installation scenario you can use the following guides:
Install Grafana and the OCI Logs plugin on a Linux host using this document.
Install Grafana and the OCI Logs plugin on Grafana Cloud using this document.
Install Grafana and the OCI Logs plugin on a MacOS host using this document.
Configure OCI Identity Policies
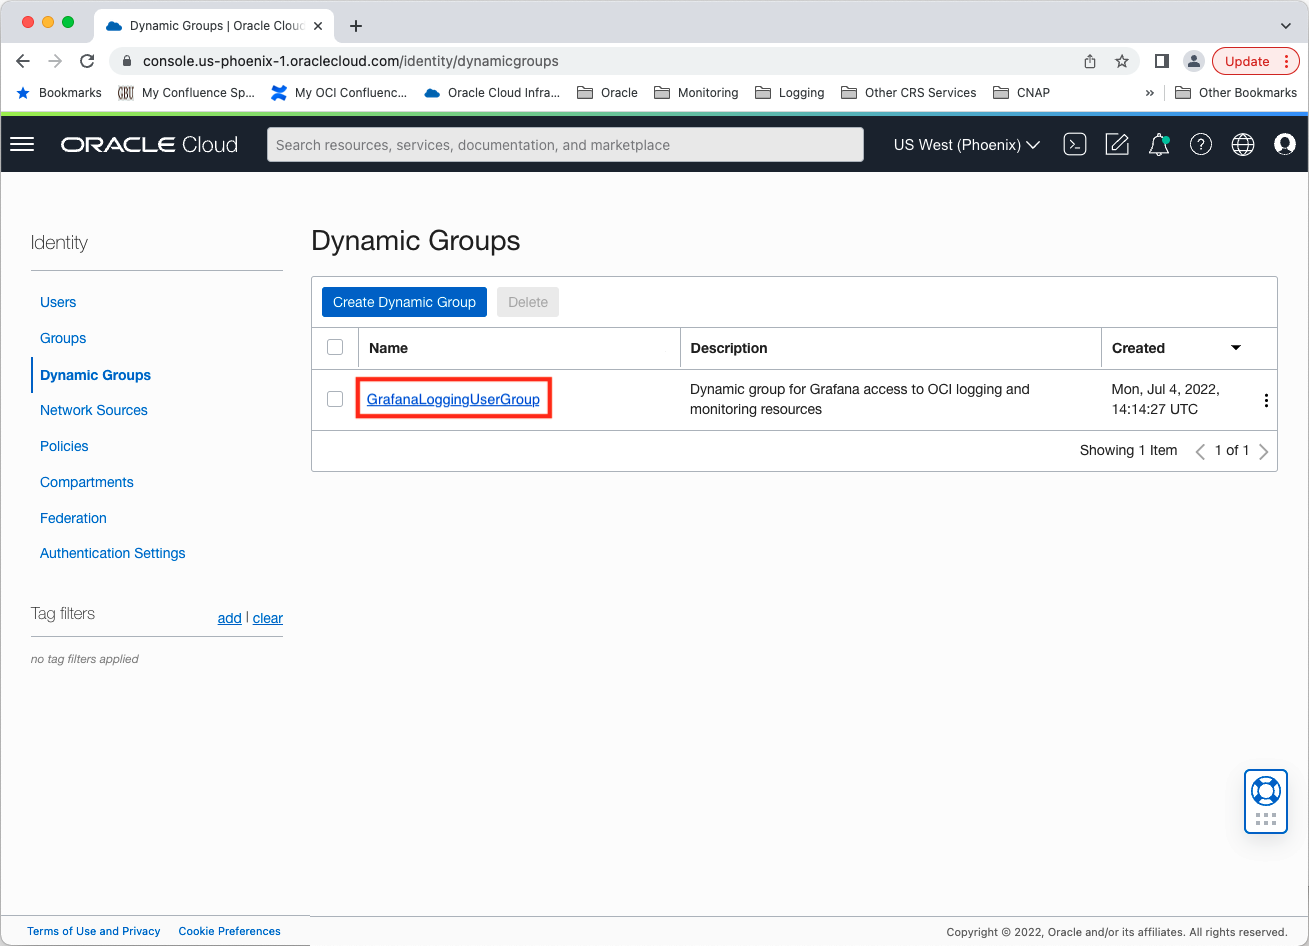
In the OCI console under Identity > Groups click Create Group and create a new group called GrafanaLoggingUserGroup. Add the user configured in the OCI CLI to the newly-created group.
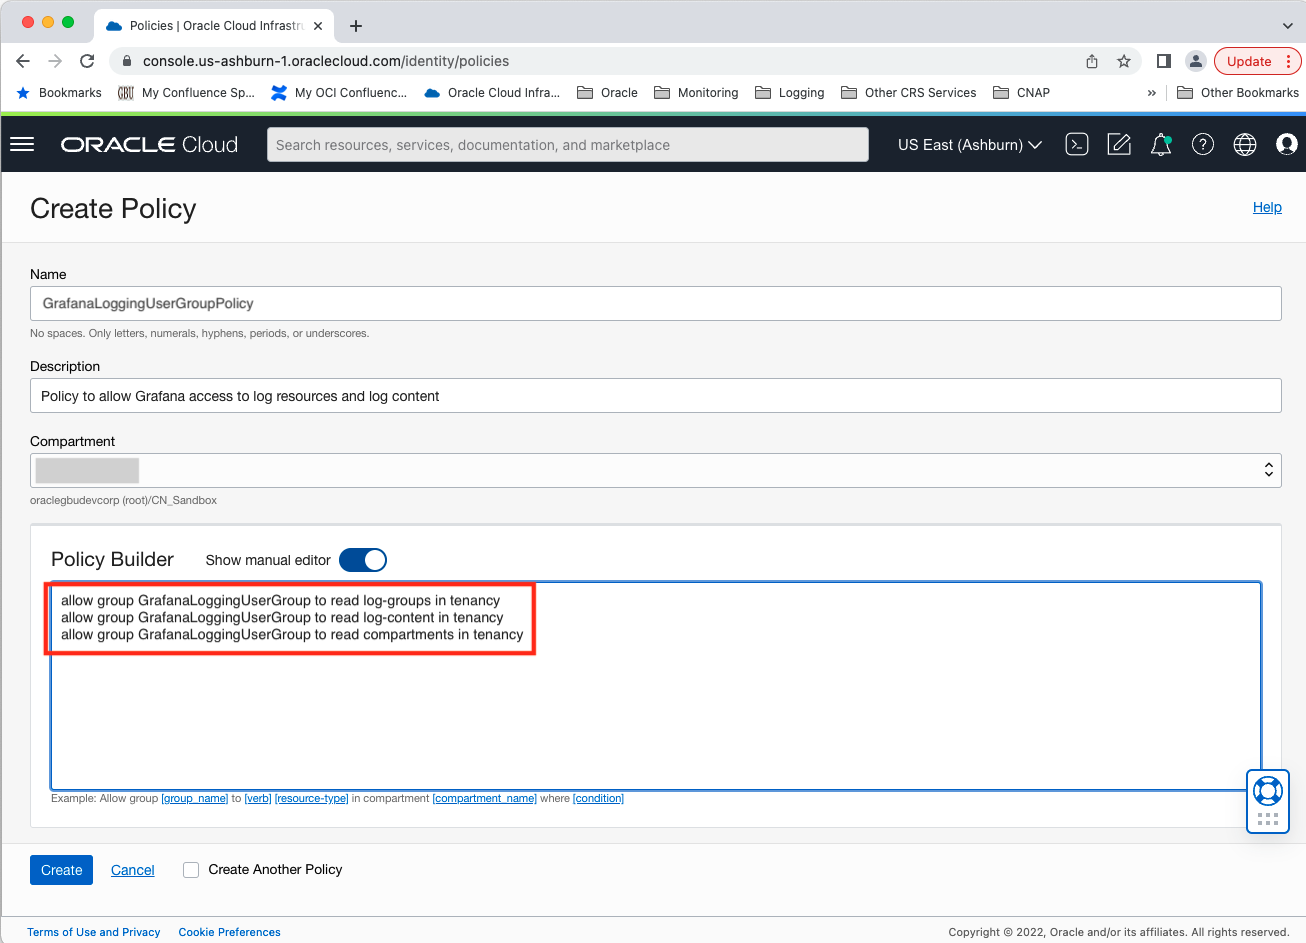
Under the Policy tab switch to the root compartment and click Create Policy. Create a policy allowing the group to read tenancy log groups and log content. Add the following policy statements:
allow group GrafanaLoggingUserGroup to read log-groups in tenancyallow group GrafanaLoggingUserGroup to read log-content in tenancyallow group GrafanaLoggingUserGroup to read compartments in tenancy
For compute-instance/VM on Oracle Cloud Infrastructure
Create a Dynamic Group for your instance
Provision an Oracle Linux virtual machine in OCI connected to a
Virtual Cloud Network with access to the public internet. If you do not
already have access to a Virtual Cloud Network with access to the public
internet you can navigate to Virtual Cloud Networks under Networking and
click Create Virtual Cloud Network. Choosing the CREATE VIRTUAL CLOUD NETWORK PLUS RELATED RESOURCES option will result in a
VCN with an Internet Routing Gateway and Route Tables configured for access to
the public internet. Three subnets will be created: one in each availability
domain in the region.
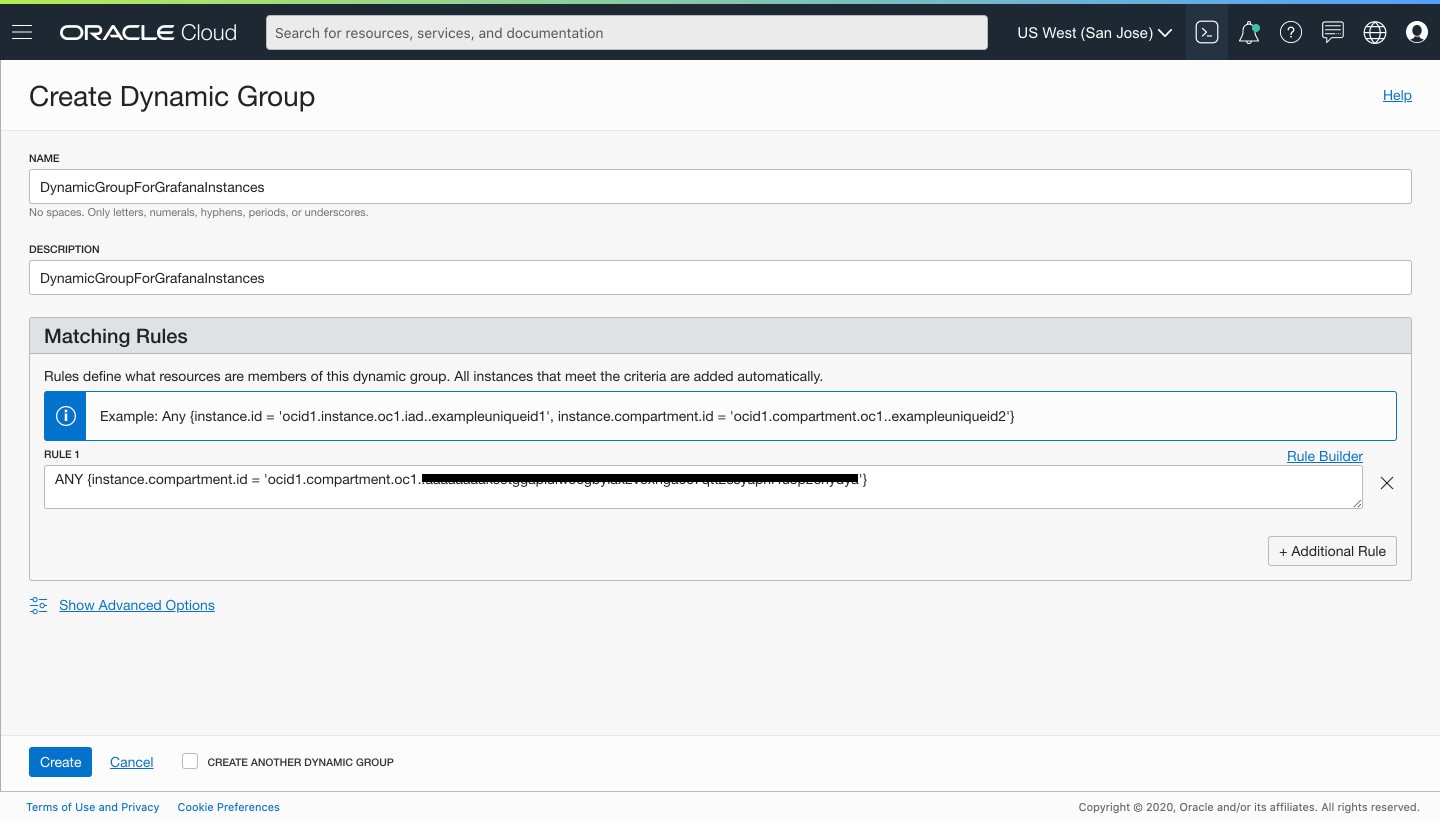
After creating your VM, the next step is to create a dynamic group used to group virtual machine or bare metal compute instances as “principals” (similar to user groups).
You can define the dynamic group similarly to below, where your instance is part
of the compartment given in the definition of the dynamic group.
Create an IAM policy for Dynamic Group for your instance
Next, create a policy named “grafana_policy” in the root compartment of your tenancy to permit instances in the dynamic group to make API calls against Oracle Cloud Infrastructure services. Add the following policy statements:
allow dynamicgroup DynamicGroupForGrafanaInstances to read log-groups in tenancyallow dynamicgroup DynamicGroupForGrafanaInstances to read log-content in tenancyallow dynamicgroup DynamicGroupForGrafanaInstances to read compartments in tenancy

Installation
Depending on your installation scenario you can use the following guides:
Install Grafana and the OCI Logs plugin on a virtual machine in Oracle Cloud Infrastructure using this document.
Install Grafana and the OCI Logs plugin on a virtual machine in Oracle Cloud Infrastructure using Terraform using this document.
Install Grafana and the OCI Logs plugin on Kubernetes in Oracle Cloud Infrastructure using this document
Note 1
The OCI Logs plugin supports the integration with Grafana Cloud with Data Source Authentication Provider configured as local. See this document for additional information.
Documentation
Please refer to the docs folder in this GitHub repository for more information on installing and using the OCI Logging data source.
Local Validation
The repository includes a local development harness under dev/ for
validating plugin load, datasource health, and real OCI Logging queries across
multiple Grafana versions. See dev/README.md for setup,
Instance Principal tunnel usage, expected results, and OCI CLI comparison steps.
Help
Issues and questions about this plugin can be posted as an issue in this GitHub repository.
Contributing
This project welcomes contributions from the community. Before submitting a pull request, please review our contribution guide
Security
Please consult the security guide for our responsible security vulnerability disclosure process.
License
Copyright (c) 2023 Oracle and/or its affiliates.
Released under the Universal Permissive License v1.0 as shown at https://oss.oracle.com/licenses/upl/.
Grafana Cloud Free
- Free tier: Limited to 3 users
- Paid plans: $55 / user / month above included usage
- Access to all Enterprise Plugins
- Fully managed service (not available to self-manage)
Self-hosted Grafana Enterprise
- Access to all Enterprise plugins
- All Grafana Enterprise features
- Self-manage on your own infrastructure
Install on Grafana Cloud
Plugins can be installed directly from within your Grafana instance or automated using the Cloud API or Terraform.
Learn more about plugin installationMarketplace plugins
This is a paid plugin developed by a marketplace partner. To purchase an entitlement, sign in first, then fill out the contact form.
Get this plugin
This is a paid for plugin developed by a marketplace partner. To purchase entitlement please fill out the contact us form.
What to expect:
- Grafana Labs will reach out to discuss your needs
- Payment will be taken by Grafana Labs
- Once purchased the plugin will be available for you to install (cloud) or a signed version will be provided (on-premise)
Thank you! We will be in touch.
For more information, visit the docs on plugin installation.
Installing on a local Grafana:
For local instances, plugins are installed and updated via a simple CLI command. Plugins are not updated automatically, however you will be notified when updates are available right within your Grafana.
1. Install the Data Source
Use the grafana-cli tool to install Oracle Cloud Infrastructure Logs from the commandline:
grafana-cli plugins install The plugin will be installed into your grafana plugins directory; the default is /var/lib/grafana/plugins. More information on the cli tool.
Alternatively, you can manually download the .zip file for your architecture below and unpack it into your grafana plugins directory.
Alternatively, you can manually download the .zip file and unpack it into your grafana plugins directory.
2. Configure the Data Source
Accessed from the Grafana main menu, newly installed data sources can be added immediately within the Data Sources section.
Next, click the Add data source button in the upper right. The data source will be available for selection in the Type select box.
To see a list of installed data sources, click the Plugins item in the main menu. Both core data sources and installed data sources will appear.
<a name="v5.0.4"></a>
Security Maintenance release (v5.0.4) - 15 May 2026
This release includes:
- vulnerability fixes and security patches
- Local OCI Logging plugin validation harness for Grafana version coverage
<a name="v5.0.3"></a>
Security Maintenance release (v5.0.3) - 16 Jul 2025
This release includes:
- security patches
[Changes][v5.0.3]
<a name="v5.0.2"></a>
Security Maintenance release (v5.0.2) - 26 Nov 2024
This release includes:
- Bug fix for github issue 117
- Bump cross-spawn from 7.0.3 to 7.0.6
<a name="v5.0.1"></a>
Security Maintenance release (v5.0.1) - 14 Oct 2024
This release includes:
- security patches
- Added new regions
<a name="v5.0.0"></a>
Grafana 11 support and free query template vars (v5.0.0) - 03 Sep 2024
This release includes:
- Grafana 11 Support, drop support for Grafana 8.x
- React 18 library upgraded
- Support for free query template variable
- Enhanced debug logs
- Libraries upgrades and minor bug and security fixes
<a name="v4.0.2"></a>
Sovereign cloud support and minor fixes (v4.0.2) - 28 Mar 2024
This release includes:
- Sovereign cloud Support
- Bug fix in Explore function
- Grafana and OCI SDK libraries upgrades
<a name="v4.0.1"></a>
Added new regions to the oci datasource plugin (v4.0.1) - 20 Feb 2024
<a name="v4.0.0"></a>
Grafana 10 support (v4.0.0) - 31 Oct 2023
- FE completely rewritten in React/Typescript
- Compatibility with Grafana 10
- Caching of region, tenancy, compartments, dimensions queries
- many performance improvements
- new Grafana API
<a name="v3.0.0"></a>
Multi-tenancy support and Secure JSON for OCI (v3.0.0) - 27 Mar 2023
This release features
- Multi-tenancy support
- Secure JSON secrets for OCI Configuration
- Added support for San Jose region
<a name="v2.0.3"></a>
Region list sort and vulnerability patches (v2.0.3) - 24 Oct 2022
- Region list sort (https://github.com/oracle/oci-grafana-logs/pull/42)
- Vulnerability patches (https://github.com/oracle/oci-grafana-logs/pull/43, https://github.com/oracle/oci-grafana-logs/pull/44, https://github.com/oracle/oci-grafana-logs/pull/46, https://github.com/oracle/oci-grafana-logs/pull/48)
<a name="v2.0.2"></a>
Feature Enhancements/Bug Fixes/ARM Support (v2.0.2) - 31 Aug 2022
- Documentations updates for OCI Grafana Logs PR #39
- Support of OCI-Logging rounddown function PR #38
- Pagination support and log search improvements PR #32 PR #24
- Bug fixes around numeric math PR #35 PR #37
- Logs Presentation improvements PR #26
<a name="v2.0.1"></a>
Minor update (v2.0.1) - 16 Mar 2022
Update plugin.json, update screenshots
<a name="v2.0.0"></a>
Grafana 8 support (v2.0.0) - 25 Feb 2022
- Support for Grafana 8, will not work in Grafana 7.
- Search query queries triggers fixed.
- Test data source will always succeed, will be revamped in the future.
- Fix for table view
<a name="v1.1.3-beta"></a>
Test package or PR 4 (v1.1.3-beta) - 04 Feb 2021
- Details will be updated once PR4 is released.
<!-- Generated by https://github.com/rhysd/changelog-from-release v3.7.2 -->