
Cal-HeatMap Panel Plugin for Grafana
Caution: This plugin is still unstable.
This plugin provides calendar with heatmap, like GitHub contribution calendar.
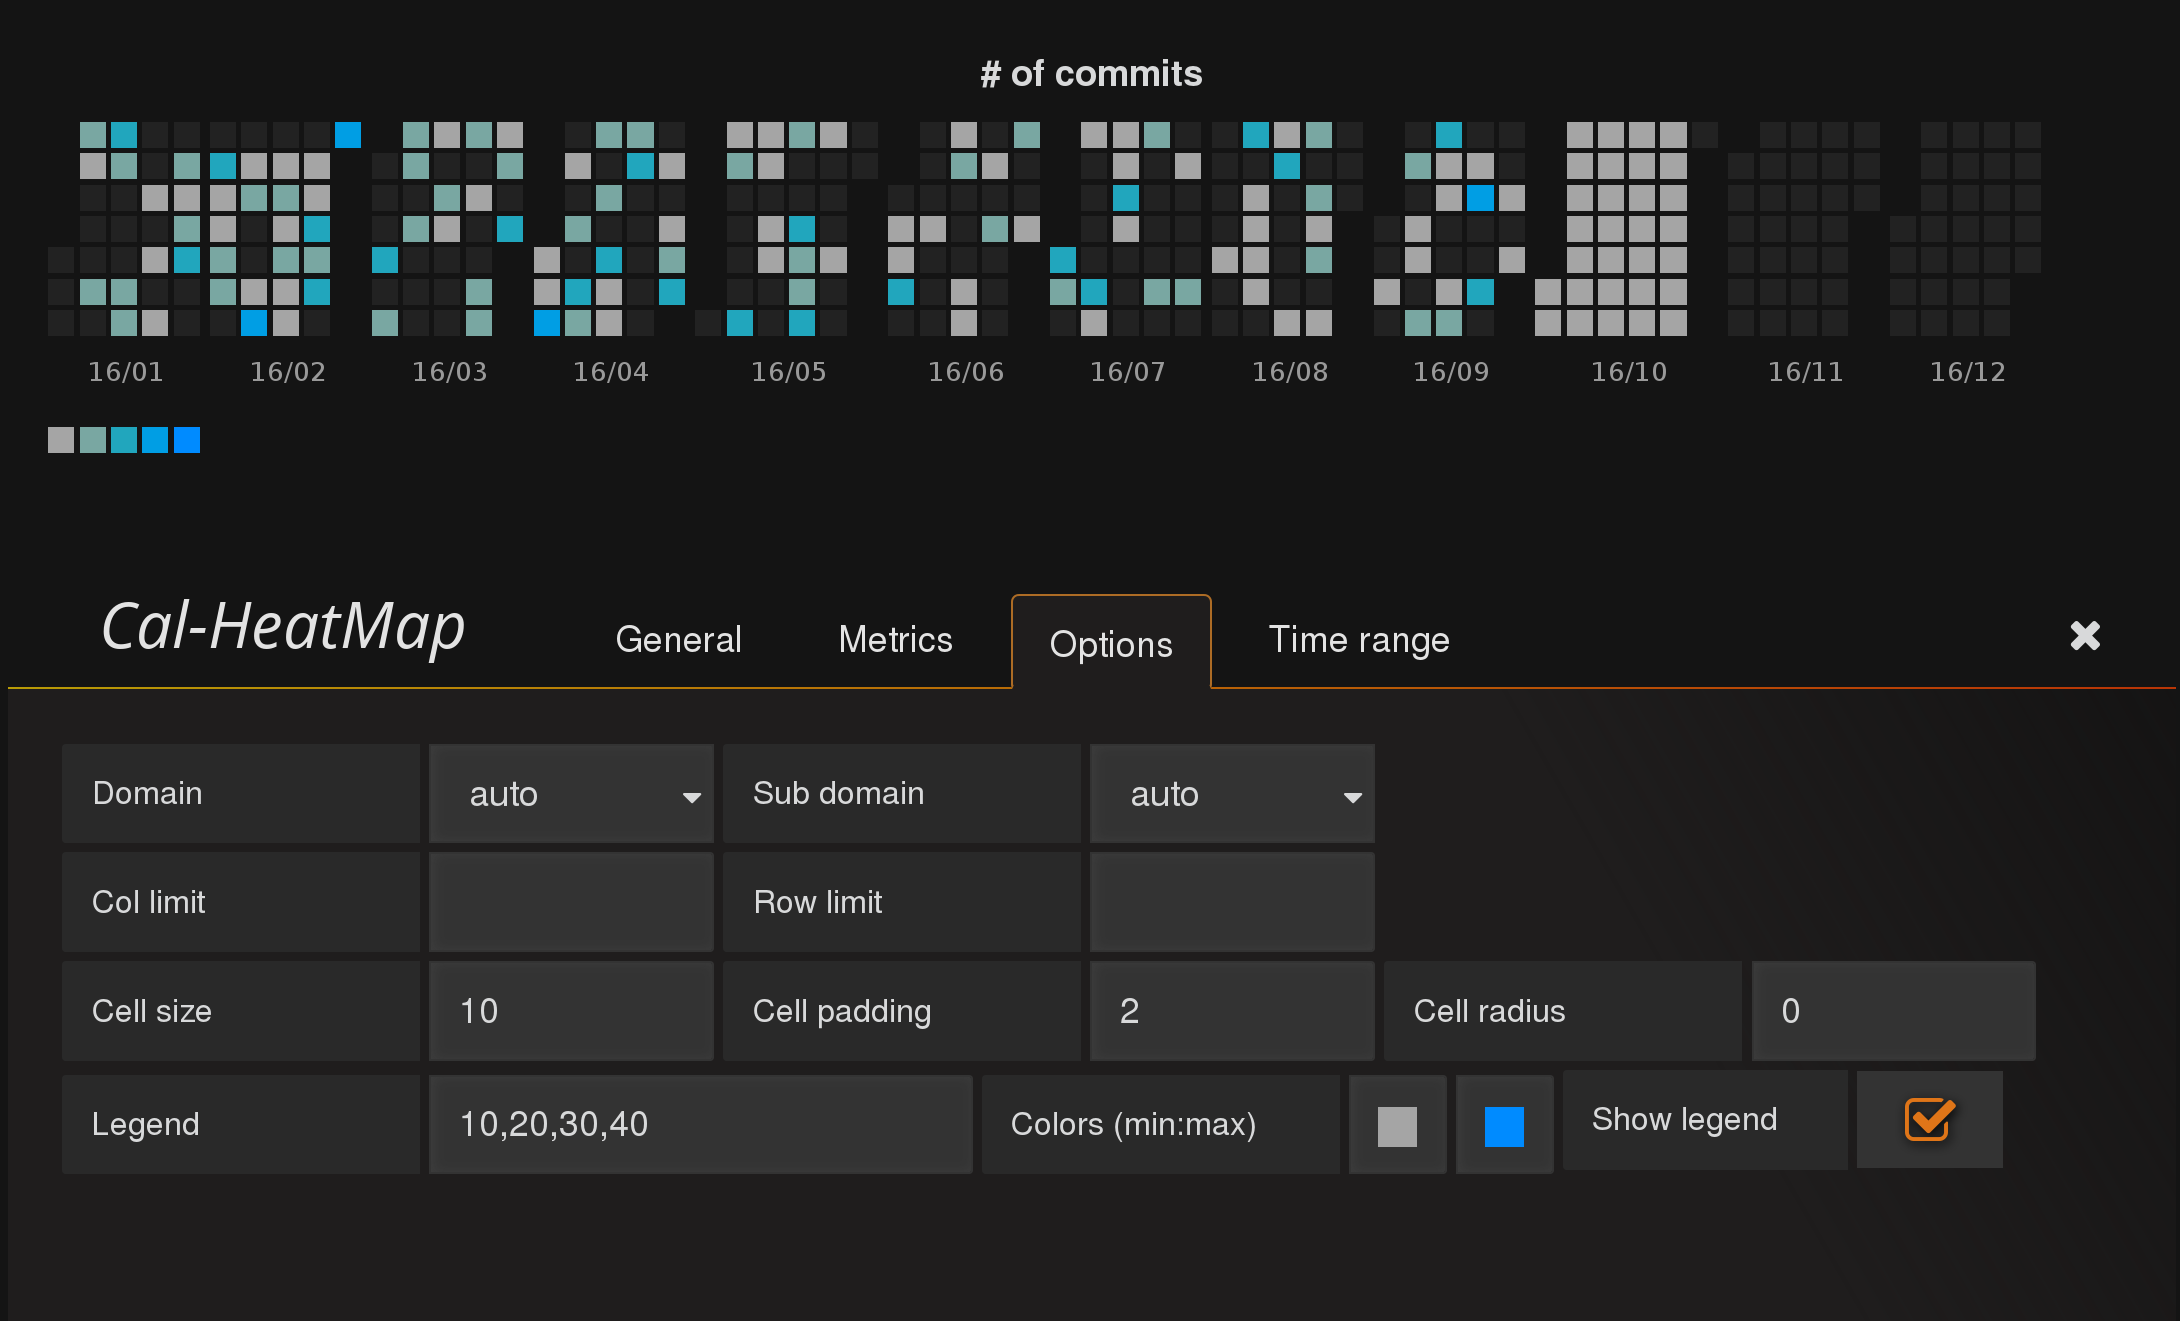
How to use
This plugin receives single time series data, such as the number of commits per hour, or temperature data. The data is passed to Cal-heatmap javascript module to draw a calendar heatmap. Currently only the first metric is displayed, and the others are ignored.
To visualize numerical series data like temperature recorded each minutes, you may need to specify domain and interval appropriately. For example, to plot the data for each hour (y-axis) and for each day (x-axis), you need to choose "day" as the domain in Option tab, and group metrics by 1 hour interval. Otherwise, the temprature in the same group might be summed up.

Options
Colors, domains, subdomains, cell sizes etc. can be configured.
Please check the official reference for Cal-heatmap for details.
Note about cal-heatmap
cal-heatmap.js in this repositry is modified from original source so that it can be loaded using "import" clause (code for AMD loader was removed).
- Version
- 0.0.4
- Developer
- neocat
- Last Updated
- January 19, 2024