Plugins 〉Haystack


Haystack
Haystack Data Source Plugin
This is a Grafana data source plugin that supports direct communication with a Project Haystack API Server. It handles authentication and supports standard Haystack API operations as well as custom Axon execution.
Some popular servers with Haystack APIs are:
Usage
Create a Data Source
Follow the Grafana instructions to create a new Haystack datasource. Next, fill in the required information:
- The name of the data source.
- The root Haystack API URL. The URLs for some popular Haystack servers are listed below:
- SkySpark:
http://<host>/api/<proj>/ - Haxall:
http://<host>/api/ - NHaystack:
http://<host>/<name_of_nhaystack_service>/
- SkySpark:
- The username and password. It is best practice to create a dedicated user for the Grafana integration.
Once complete, select Save & Test. If you get a green check mark, the connection was successful!
Query Data
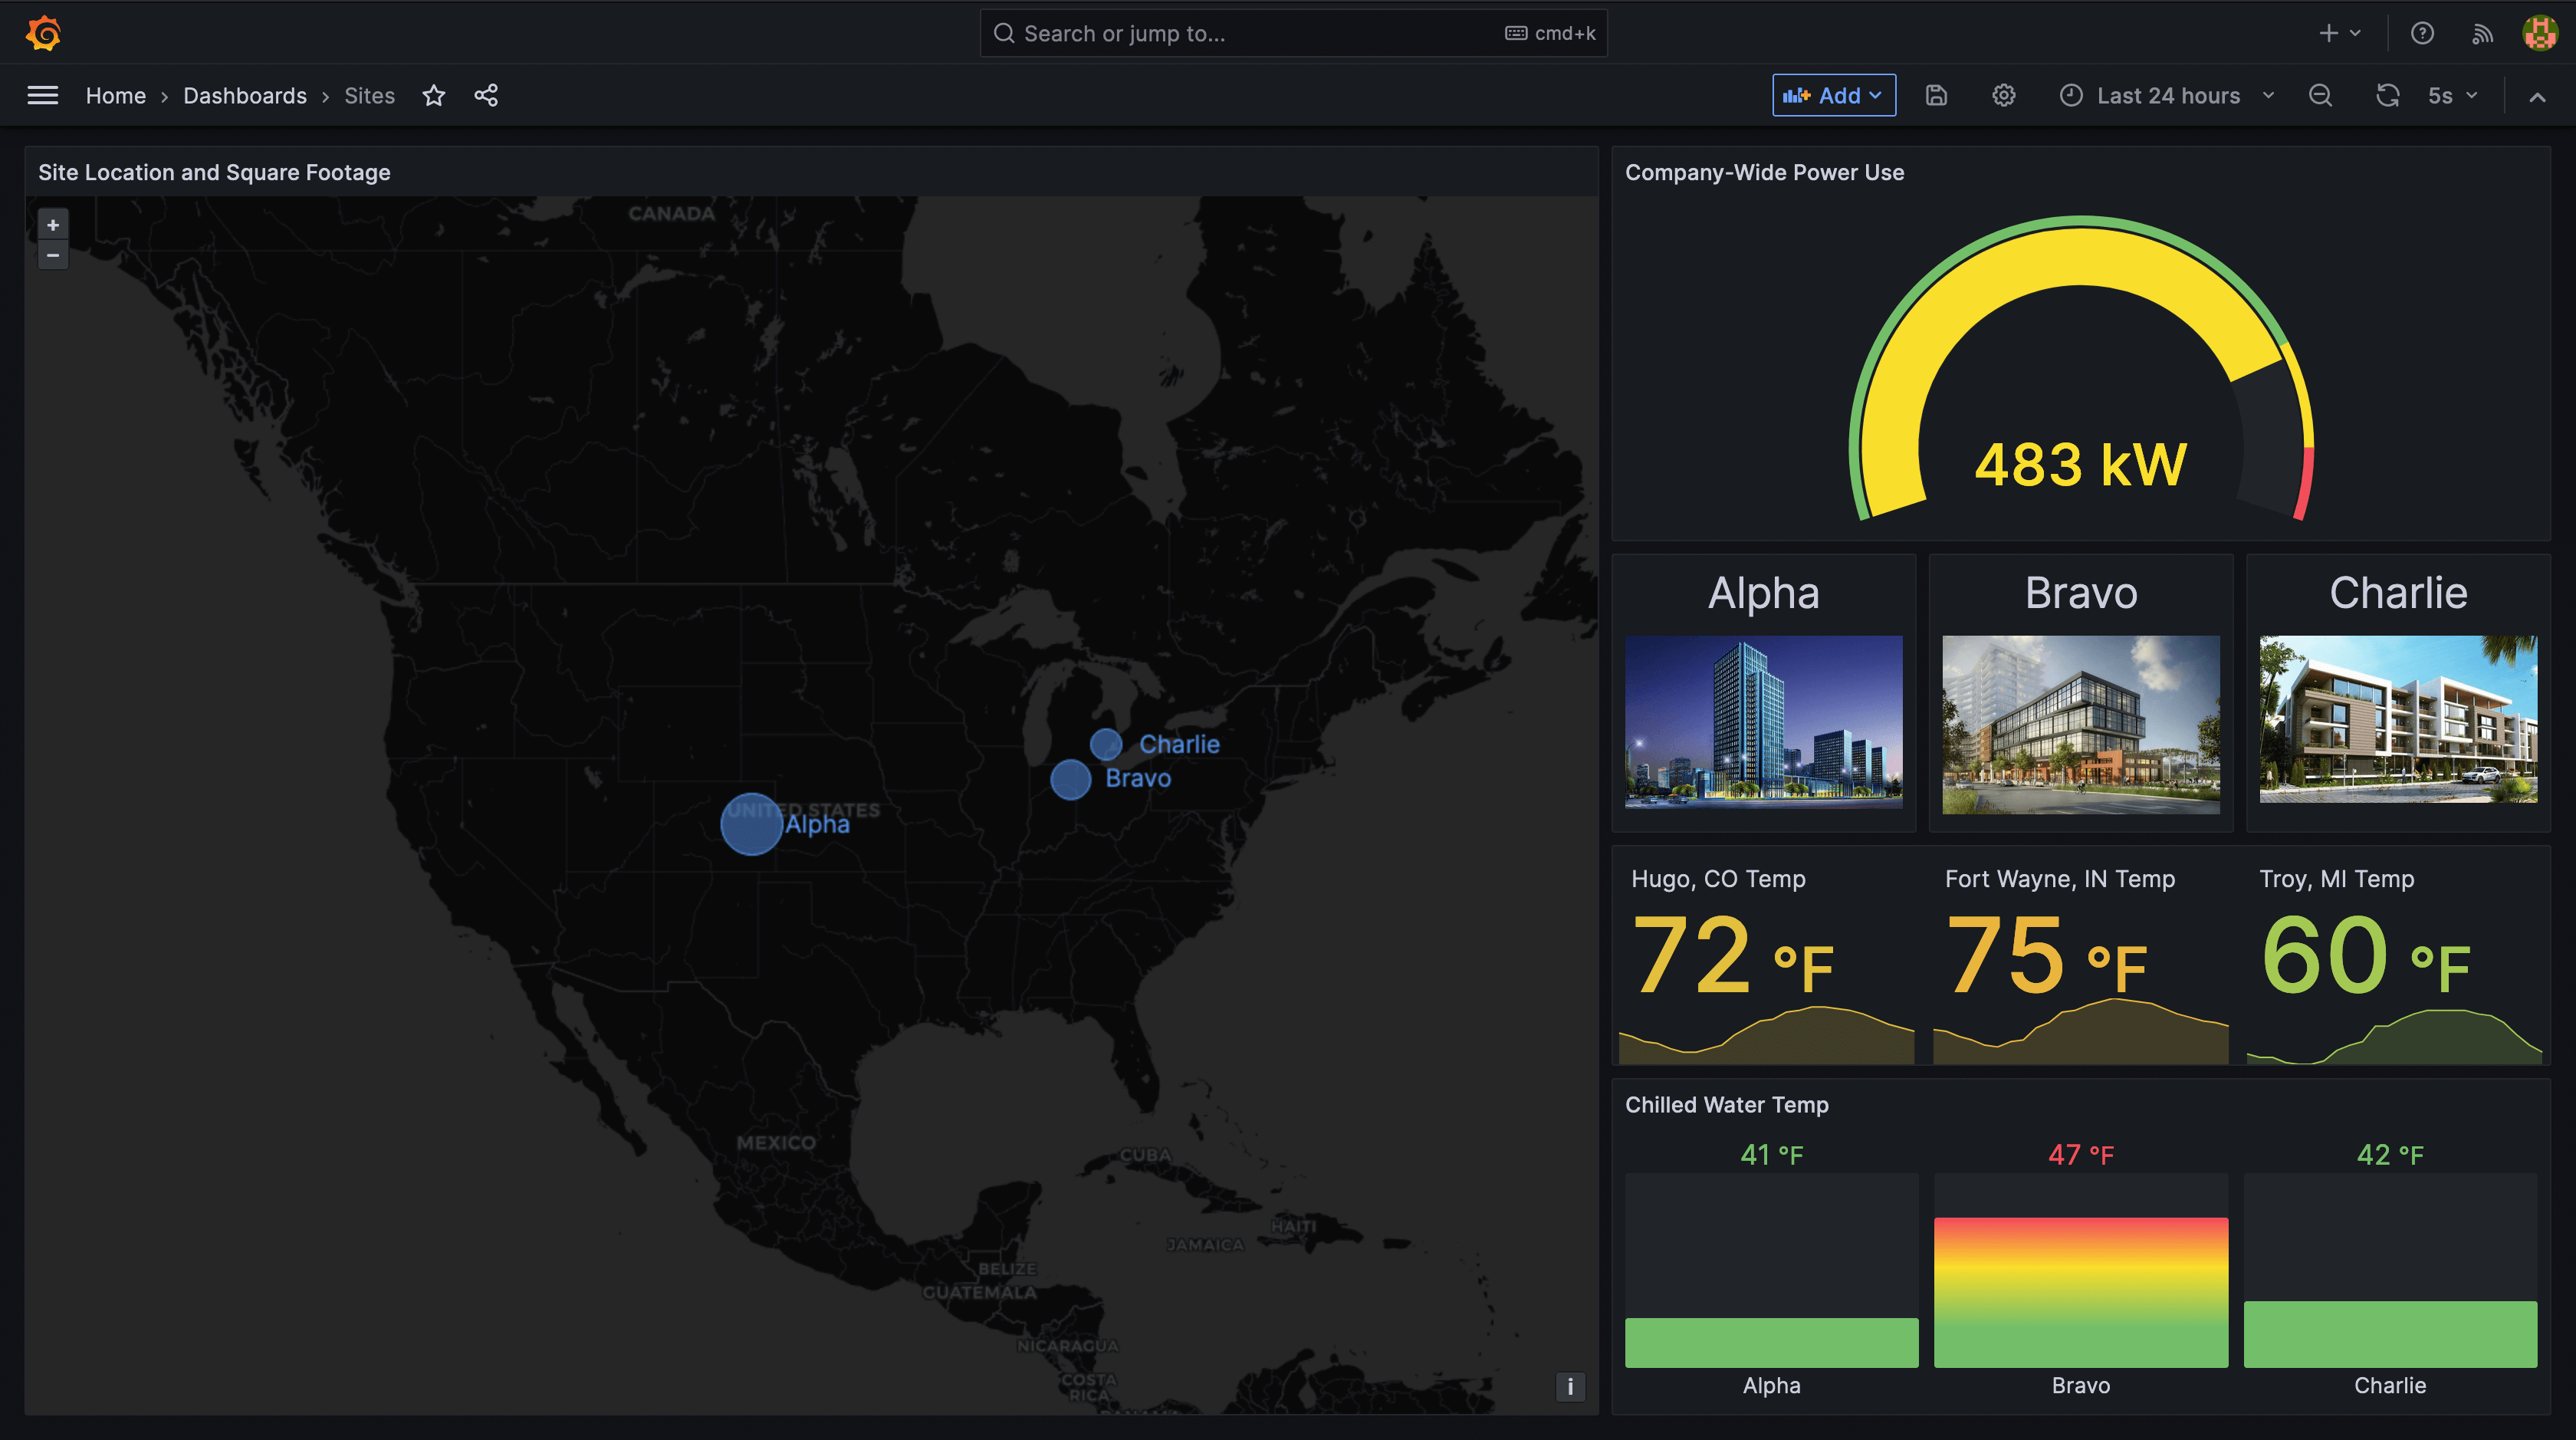
To query data from the data source, create a dashboard and add a new panel.
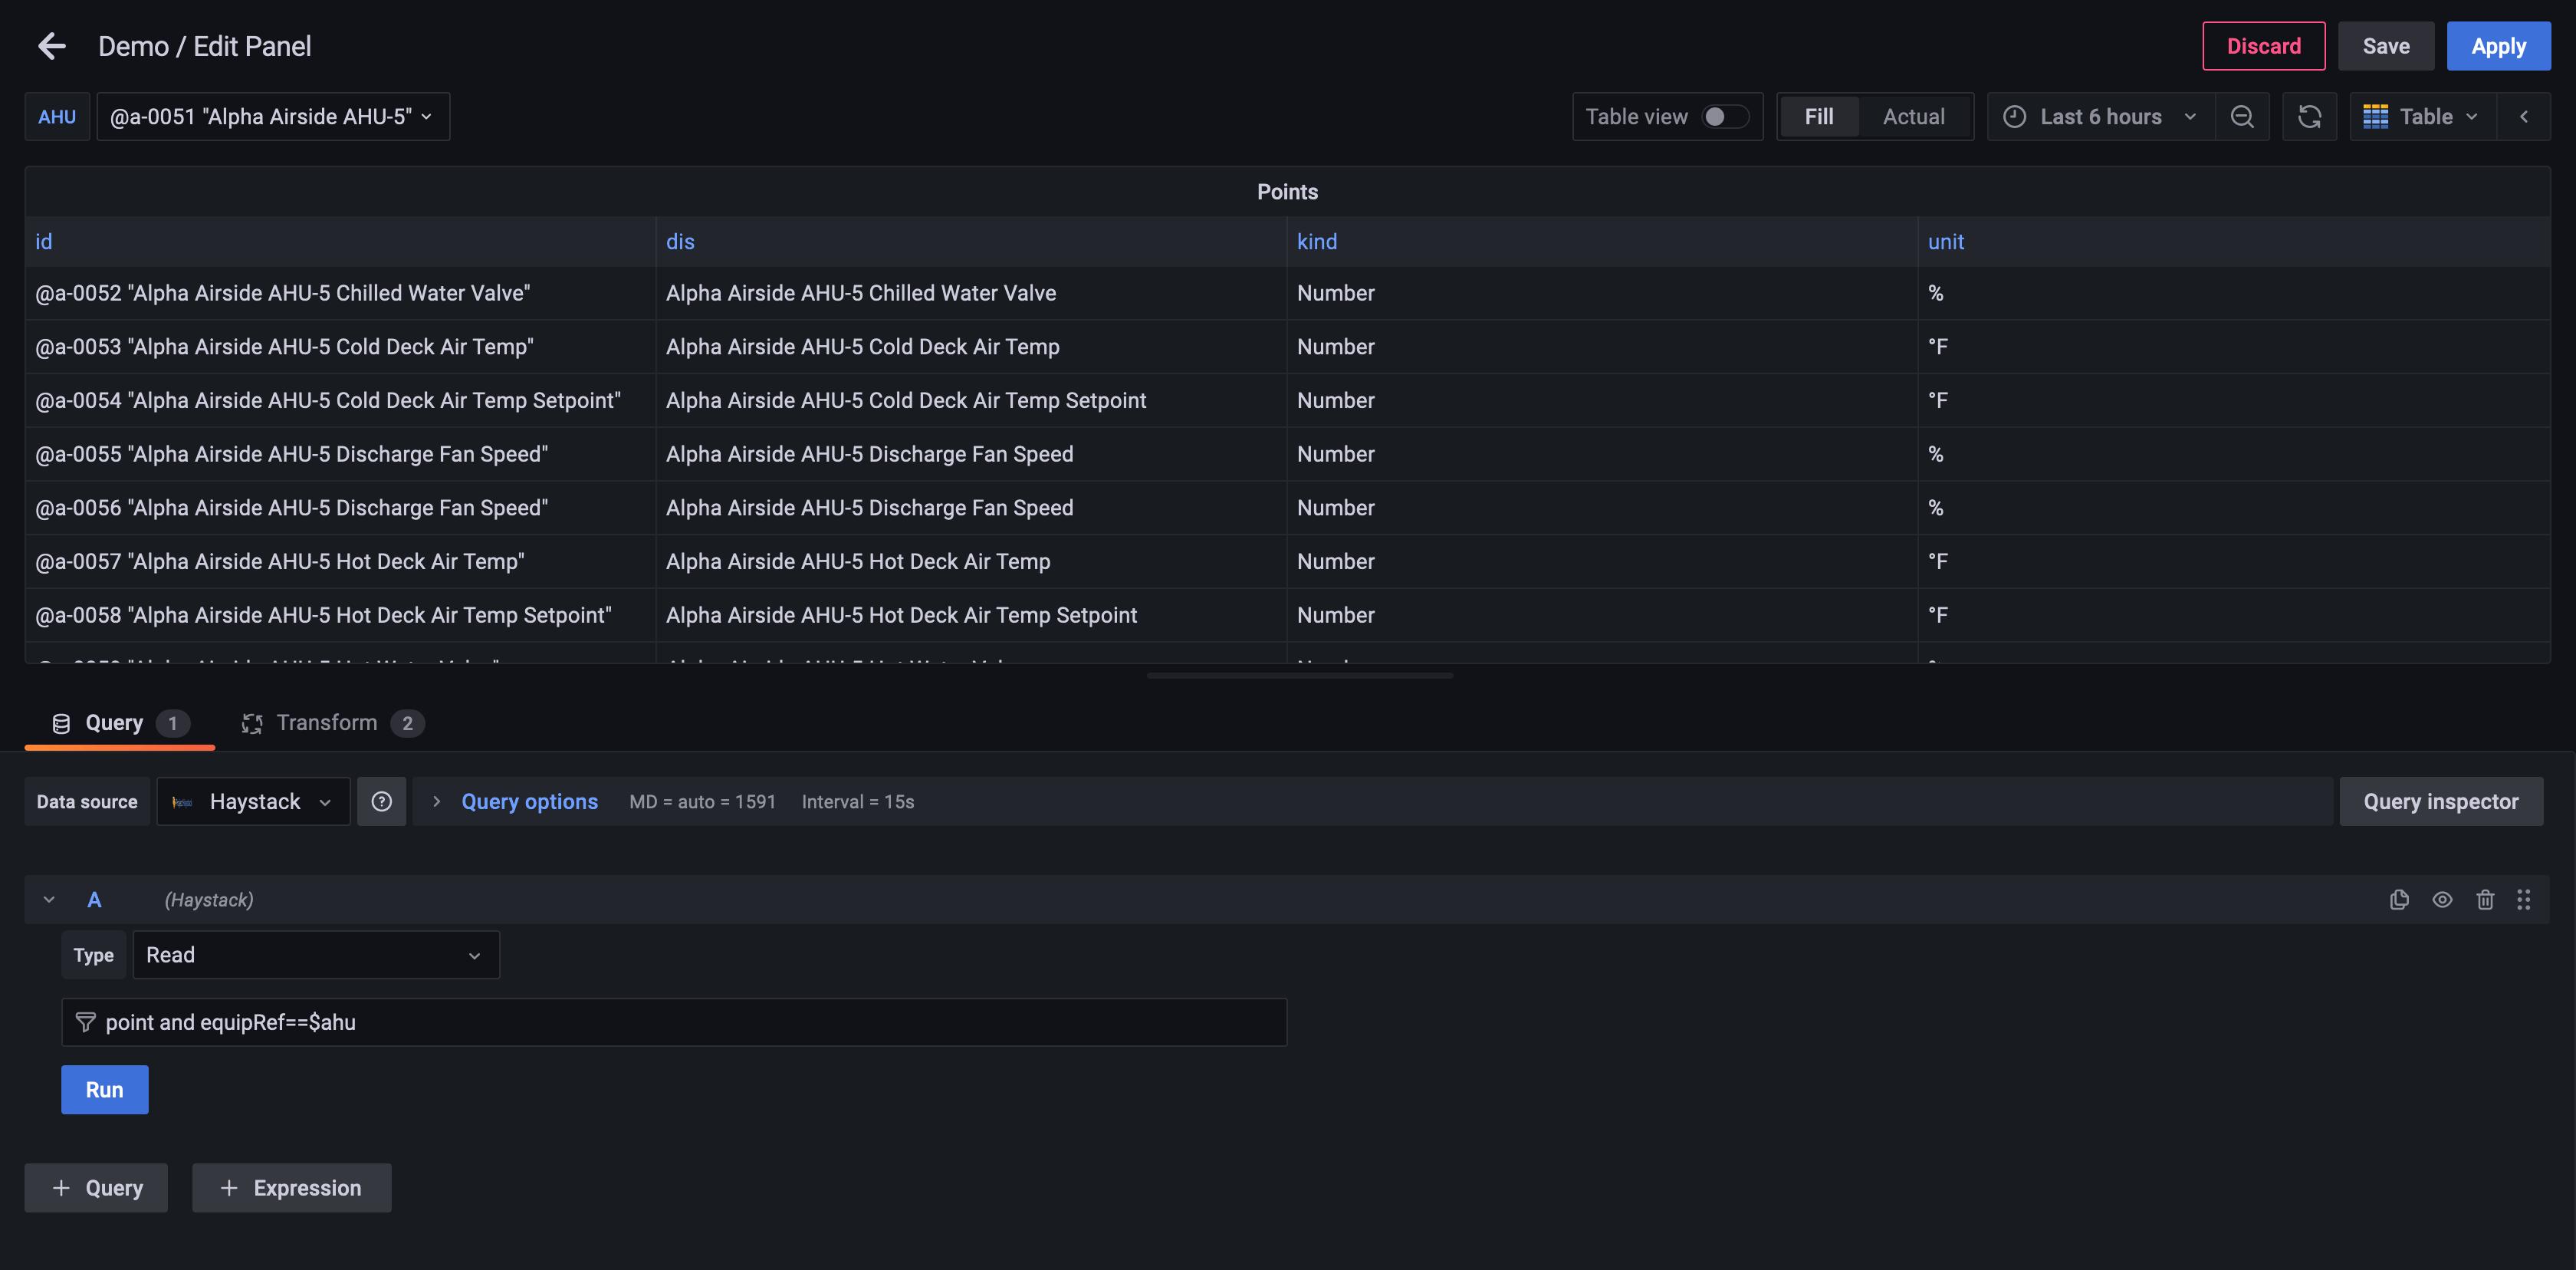
Select your Haystack data source in the Data Sources menu. Next, select the type of Haystack query that should be performed (only queries supported by your data source are shown):
- Eval: Evaluate a free-form Axon expression. Note: Not all Haystack servers support this functionality
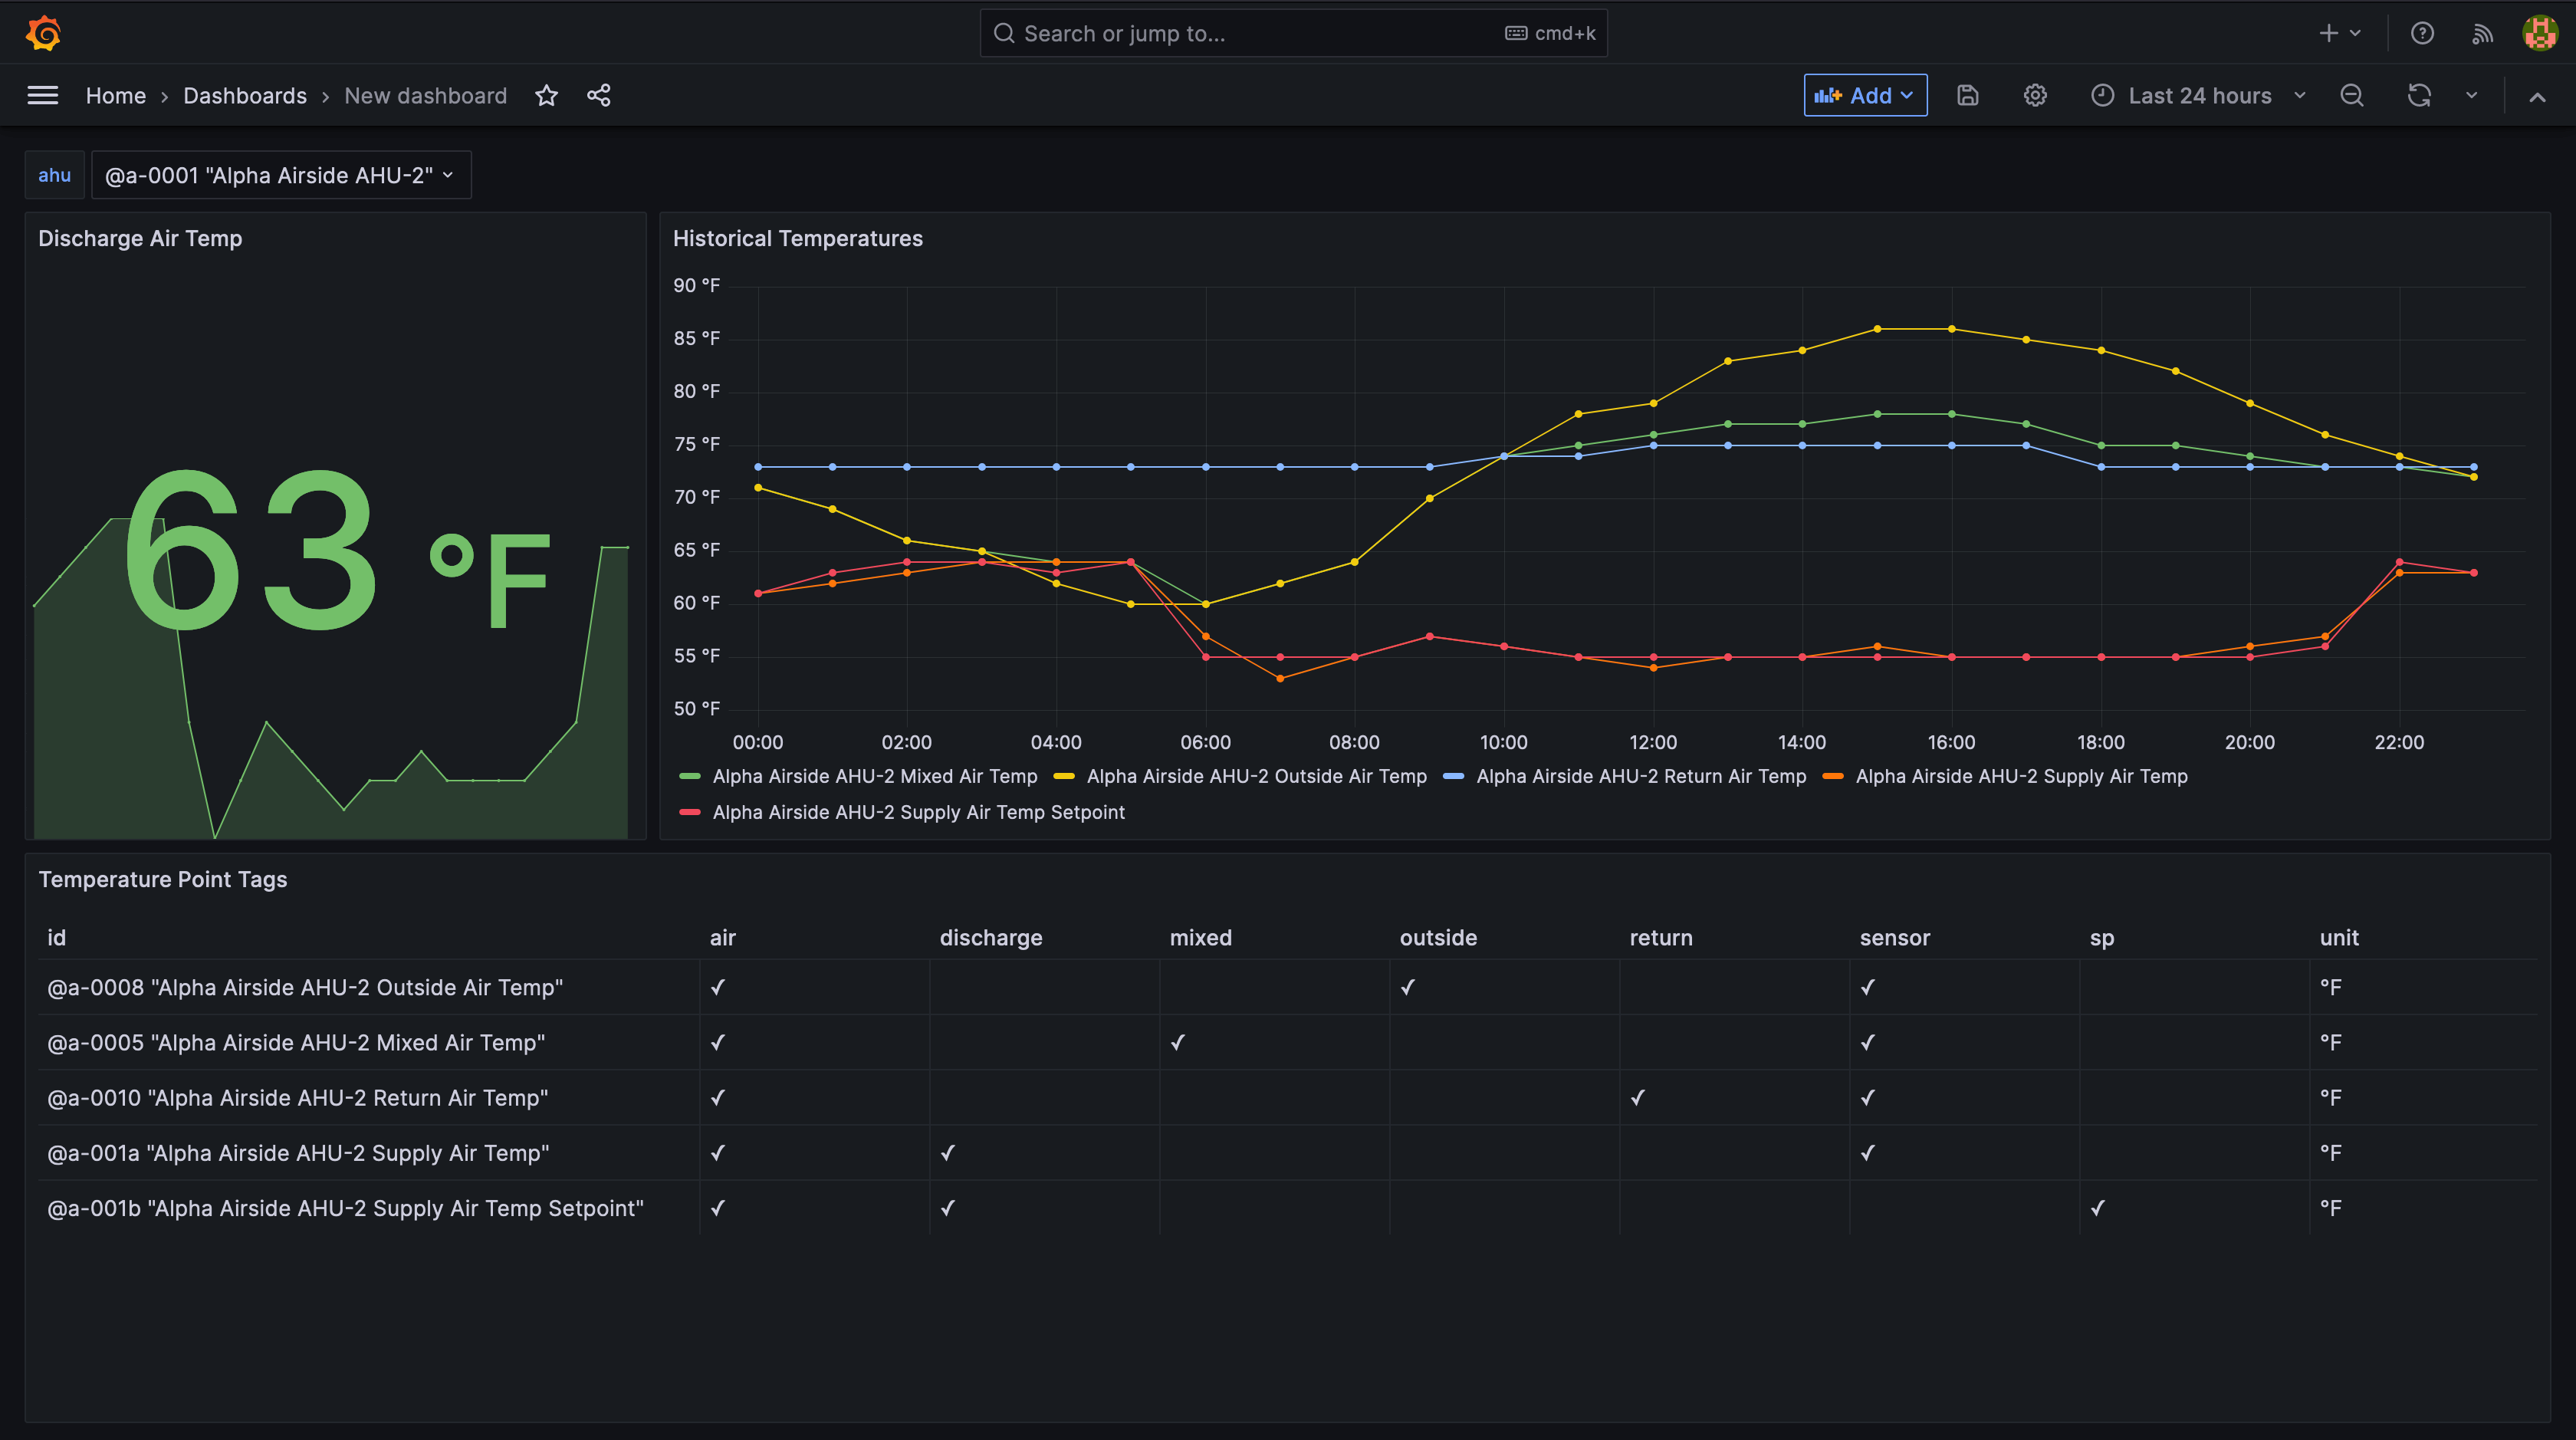
- HisRead: Display the history of a single point over the selected time range.
- HisRead via filter: Read multiple points using a filter, and display their histories over the selected time range.
- Read: Display the records matching a filter. Since this is not timeseries data, it is best viewed in Grafana's "Table" view.
Variable Usage
Grafana variables can be injected into Haystack queries
using the ordinary syntax,
e.g. $varName.
We also support a few special variables from the selected time-range:
$__timeRange_start: DateTime start of the selected Grafana time range$__timeRange_end: DateTime end of the selected Grafana time range$__maxDataPoints: Number representing the pixel width of Grafana's display panel.$__interval: Number representing Grafana's recommended data interval. This is the duration of the time range, divided by the number of pixels, delivered in units of minutes.
To use them, simply enter the value in the input string. Below is an example of using the variables in an Eval query:
> read(temp).hisRead($__timeRange_start..$__timeRange_end).hisInterpolate()
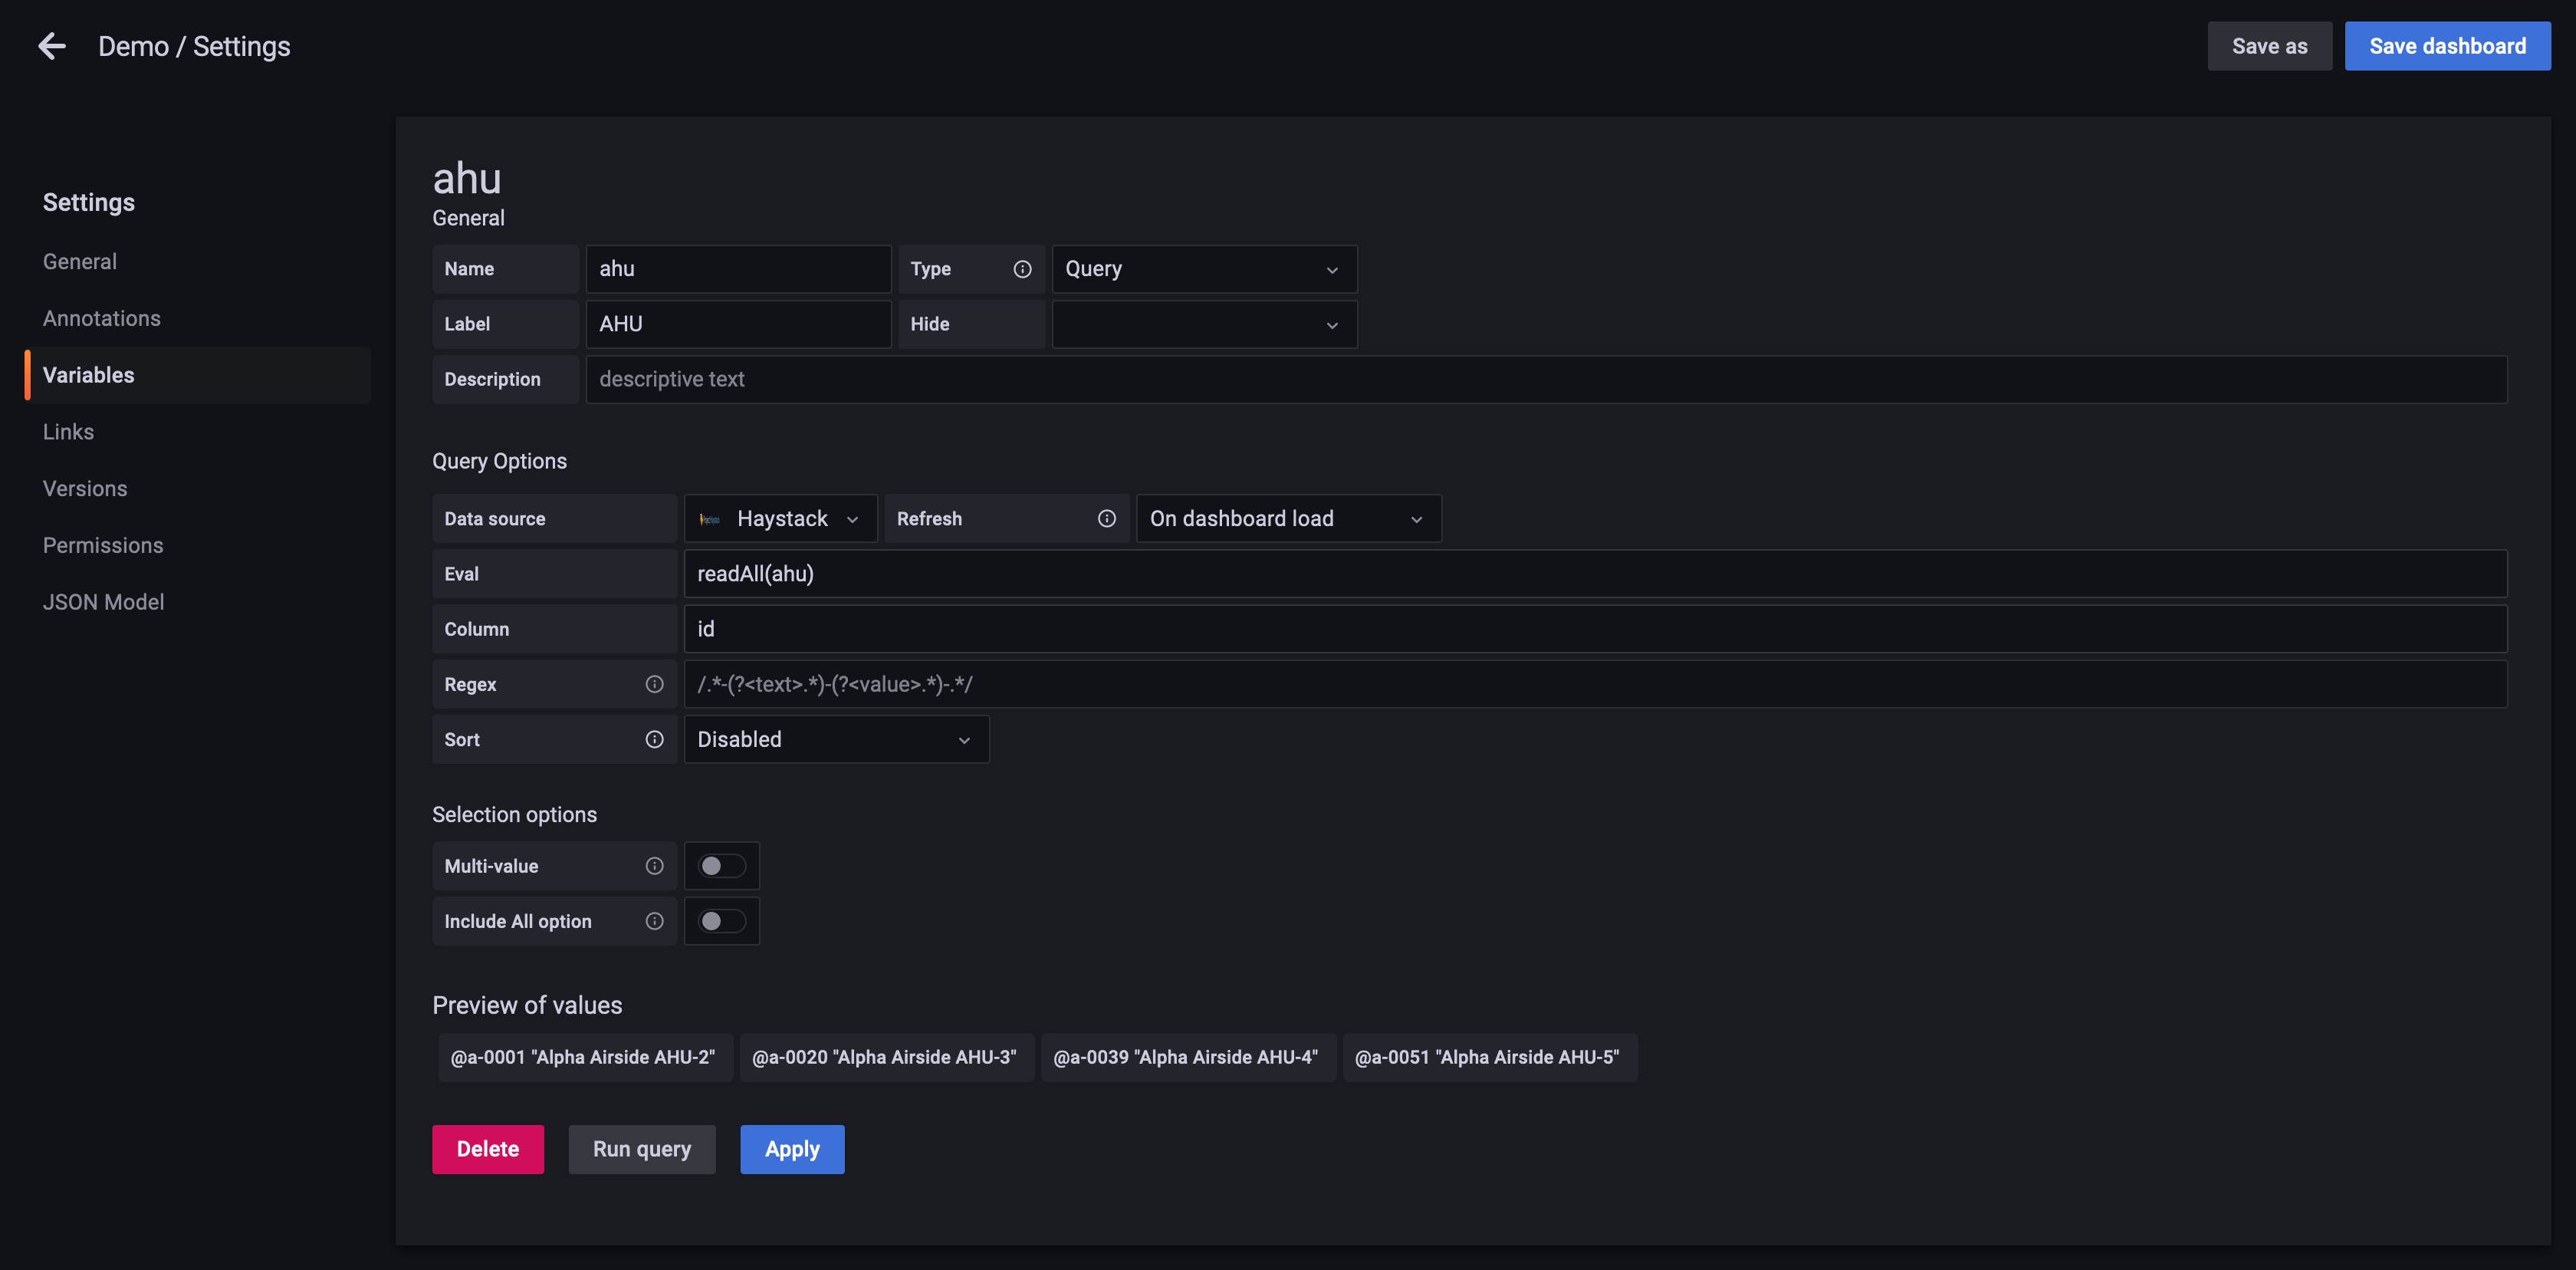
Query Variables
You can use the Haystack connector to source new variables. Create a query and then enter the name of the column that
contains the variable values. If no column is specified, id is used if present. Otherwise, the first column is used.
The value injected by the variable exactly matches the displayed value, with the exception of Ref types. Instead, Ref
types display the "display" portion and inject only the "ID" portion (i.e. @abc "Site A" will be displayed as Site A
and provide @abc when injected). Multiple-select values are combined with commas, (red,blue), but this may be
customized using the advanced variable format options.
Alerting
Standard grafana alerting is supported by this data source.
Haystack Server Configuration
NHaystack
Follow the setup instructions in the nhaystack README.
Currently only Basic Auth connectivity to nhaystack is supported. Basic auth should only be enabled when Niagara web traffic is encrypted using HTTPS.
To add basic auth support, click and drag baja/AuthenticationSchemes/WebServicesSchemes/HTTPBasicScheme from the Palette to Config/AuthenticationService/AuthenticationSchemes/ in the Nav pane. Then go to Config/UserService/ in the Nav pane, create a user, and set the Authentication Scheme Name slot to HTTPBasicScheme. The user must also have an Admin role in order to access nhaystack endpoints.
The root Haystack API URL is dependent on the name given to the nhaystack service: http://<host>/<name_of_nhaystack_service>/. This service name defaults to haystack, so unless renamed the URL is http://<host>/haystack/.
Support
You can view the code, contribute, or request support on this project's GitHub repo
Grafana Cloud Free
- Free tier: Limited to 3 users
- Paid plans: $55 / user / month above included usage
- Access to all Enterprise Plugins
- Fully managed service (not available to self-manage)
Self-hosted Grafana Enterprise
- Access to all Enterprise plugins
- All Grafana Enterprise features
- Self-manage on your own infrastructure
Install on Grafana Cloud
Plugins can be installed directly from within your Grafana instance or automated using the Cloud API or Terraform.
Learn more about plugin installationMarketplace plugins
This is a paid plugin developed by a marketplace partner. To purchase an entitlement, sign in first, then fill out the contact form.
Get this plugin
This is a paid for plugin developed by a marketplace partner. To purchase entitlement please fill out the contact us form.
What to expect:
- Grafana Labs will reach out to discuss your needs
- Payment will be taken by Grafana Labs
- Once purchased the plugin will be available for you to install (cloud) or a signed version will be provided (on-premise)
Thank you! We will be in touch.
For more information, visit the docs on plugin installation.
Installing on a local Grafana:
For local instances, plugins are installed and updated via a simple CLI command. Plugins are not updated automatically, however you will be notified when updates are available right within your Grafana.
1. Install the Data Source
Use the grafana-cli tool to install Haystack from the commandline:
grafana-cli plugins install The plugin will be installed into your grafana plugins directory; the default is /var/lib/grafana/plugins. More information on the cli tool.
Alternatively, you can manually download the .zip file for your architecture below and unpack it into your grafana plugins directory.
Alternatively, you can manually download the .zip file and unpack it into your grafana plugins directory.
2. Configure the Data Source
Accessed from the Grafana main menu, newly installed data sources can be added immediately within the Data Sources section.
Next, click the Add data source button in the upper right. The data source will be available for selection in the Type select box.
To see a list of installed data sources, click the Plugins item in the main menu. Both core data sources and installed data sources will appear.
Changelog
0.0.28
- Haystack HTTP client inherits Grafana proxy settings, request timeouts, and tracing.
0.0.26
- Bump dependencies to address CVEs.
0.0.25
- Adds switch to disable TLS verification.
0.0.24
0.0.23
0.0.22
- Correctly sets minimum Grafana version to v11.0.0
- Fixes persistence issues with input queries
- Restores support for variable 'definition' display strings
0.0.21
- Documentation updates
0.0.20
- Removes 'Run' button from query editor
- Removes reliance on deprecated features
- Bumps dependences to latest versions
0.0.19
- Adds 'display column' support to variables
- Adds placeholders to variable column inputs to explain behavior
0.0.17
- Ref variables do not include id in display
- Variables use
idcolumn if unspecified
0.0.16
- Adds full nhaystack support with basic authentication
- Improves display name detection
- Changes default query type to
readto better support non-Axon environments - Loosens basic auth server header requirements
0.0.15
Fixes haystack v0.1.12 upgrade.
0.0.14
Upgrades to haystack v0.1.12 to add basic auth client support.
0.0.12
Sets Grafana field display name to column meta ID display name, if present.
0.0.11
Minor documentation updates
0.0.10
- Adds a
HisRead with Filterquery type that allows filtering and performing multiple hisReads in one step. - Improves unit detection of historical data.
- Fixes HisRead legend and DataFrame name to reflect the name of the point.
0.0.9
Adds login/retry on a 403 response. This ensures that visualizations are still functional after long periods of inactivity.
0.0.6
Initial release.