
Plugins 〉Monitoring Art


The Monitoring Art plugin has been deprecated and is no longer maintained.
Monitoring Art

Grafana Monitoring Art Datasource
Please add your GitHub star ★, it will encourage us to publish more Monitoring Art dashboards.
Add some art into your Grafana. Real metrics. No dependency, no waiting for data collection. Just install, import dashboard(s) and enjoy it immediately. Visit plugin presentation microsite www.monitoringart.com and public snapshot of Monitoring Art.
Instalation
Use the grafana-cli tool to install Monitoring Art from the commandline:
grafana-cli plugins install grafana-monitoring-art
The plugin will be installed into your grafana plugins directory; the default is
/var/lib/grafana/plugins.
Note: Grafana 3.0 or greater is required to install and use plugins.
Configuration
No configuration. Just add the datasource and then import dashboard(s).

How is it possible
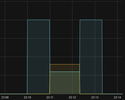
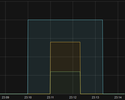
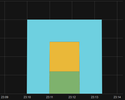
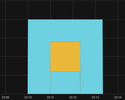
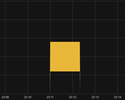
Get right metric values. Build stacked graph, tweak colors and metric order/lines filling. For example how to visualize the square:
Do you want Monitoring Art with your logo? Not a problem. Contact author and buy your customized Monitoring Art.
Contribution
Feel free to create pull request to improve datasource/datasets quality - source GitHub repo.
Author
Devops Monitoring Expert, who loves monitoring systems, which start with letter Z. Those are Zabbix and Zenoss.
Professional devops / monitoring services:
![]()
Grafana Cloud Free
- Free tier: Limited to 3 users
- Paid plans: $55 / user / month above included usage
- Access to all Enterprise Plugins
- Fully managed service (not available to self-manage)
Self-hosted Grafana Enterprise
- Access to all Enterprise plugins
- All Grafana Enterprise features
- Self-manage on your own infrastructure
Installing Monitoring Art on Grafana Cloud:
Installing plugins on a Grafana Cloud instance is a one-click install; same with updates. Cool, right?
Note that it could take up to 1 minute to see the plugin show up in your Grafana.
Installing plugins on a Grafana Cloud instance is a one-click install; same with updates. Cool, right?
Note that it could take up to 1 minute to see the plugin show up in your Grafana.
Installing plugins on a Grafana Cloud instance is a one-click install; same with updates. Cool, right?
Note that it could take up to 1 minute to see the plugin show up in your Grafana.
Installing plugins on a Grafana Cloud instance is a one-click install; same with updates. Cool, right?
Note that it could take up to 1 minute to see the plugin show up in your Grafana.
Installing plugins on a Grafana Cloud instance is a one-click install; same with updates. Cool, right?
Note that it could take up to 1 minute to see the plugin show up in your Grafana.
Installing plugins on a Grafana Cloud instance is a one-click install; same with updates. Cool, right?
Note that it could take up to 1 minute to see the plugin show up in your Grafana.
Installing plugins on a Grafana Cloud instance is a one-click install; same with updates. Cool, right?
Note that it could take up to 1 minute to see the plugin show up in your Grafana.
For more information, visit the docs on plugin installation.
Installing on a local Grafana:
For local instances, plugins are installed and updated via a simple CLI command. Plugins are not updated automatically, however you will be notified when updates are available right within your Grafana.
1. Install the Data Source
Use the grafana-cli tool to install Monitoring Art from the commandline:
grafana-cli plugins install The plugin will be installed into your grafana plugins directory; the default is /var/lib/grafana/plugins. More information on the cli tool.
Alternatively, you can manually download the .zip file for your architecture below and unpack it into your grafana plugins directory.
Alternatively, you can manually download the .zip file and unpack it into your grafana plugins directory.
2. Configure the Data Source
Accessed from the Grafana main menu, newly installed data sources can be added immediately within the Data Sources section.
Next, click the Add data source button in the upper right. The data source will be available for selection in the Type select box.
To see a list of installed data sources, click the Plugins item in the main menu. Both core data sources and installed data sources will appear.