Plugins 〉Funnel


Funnel
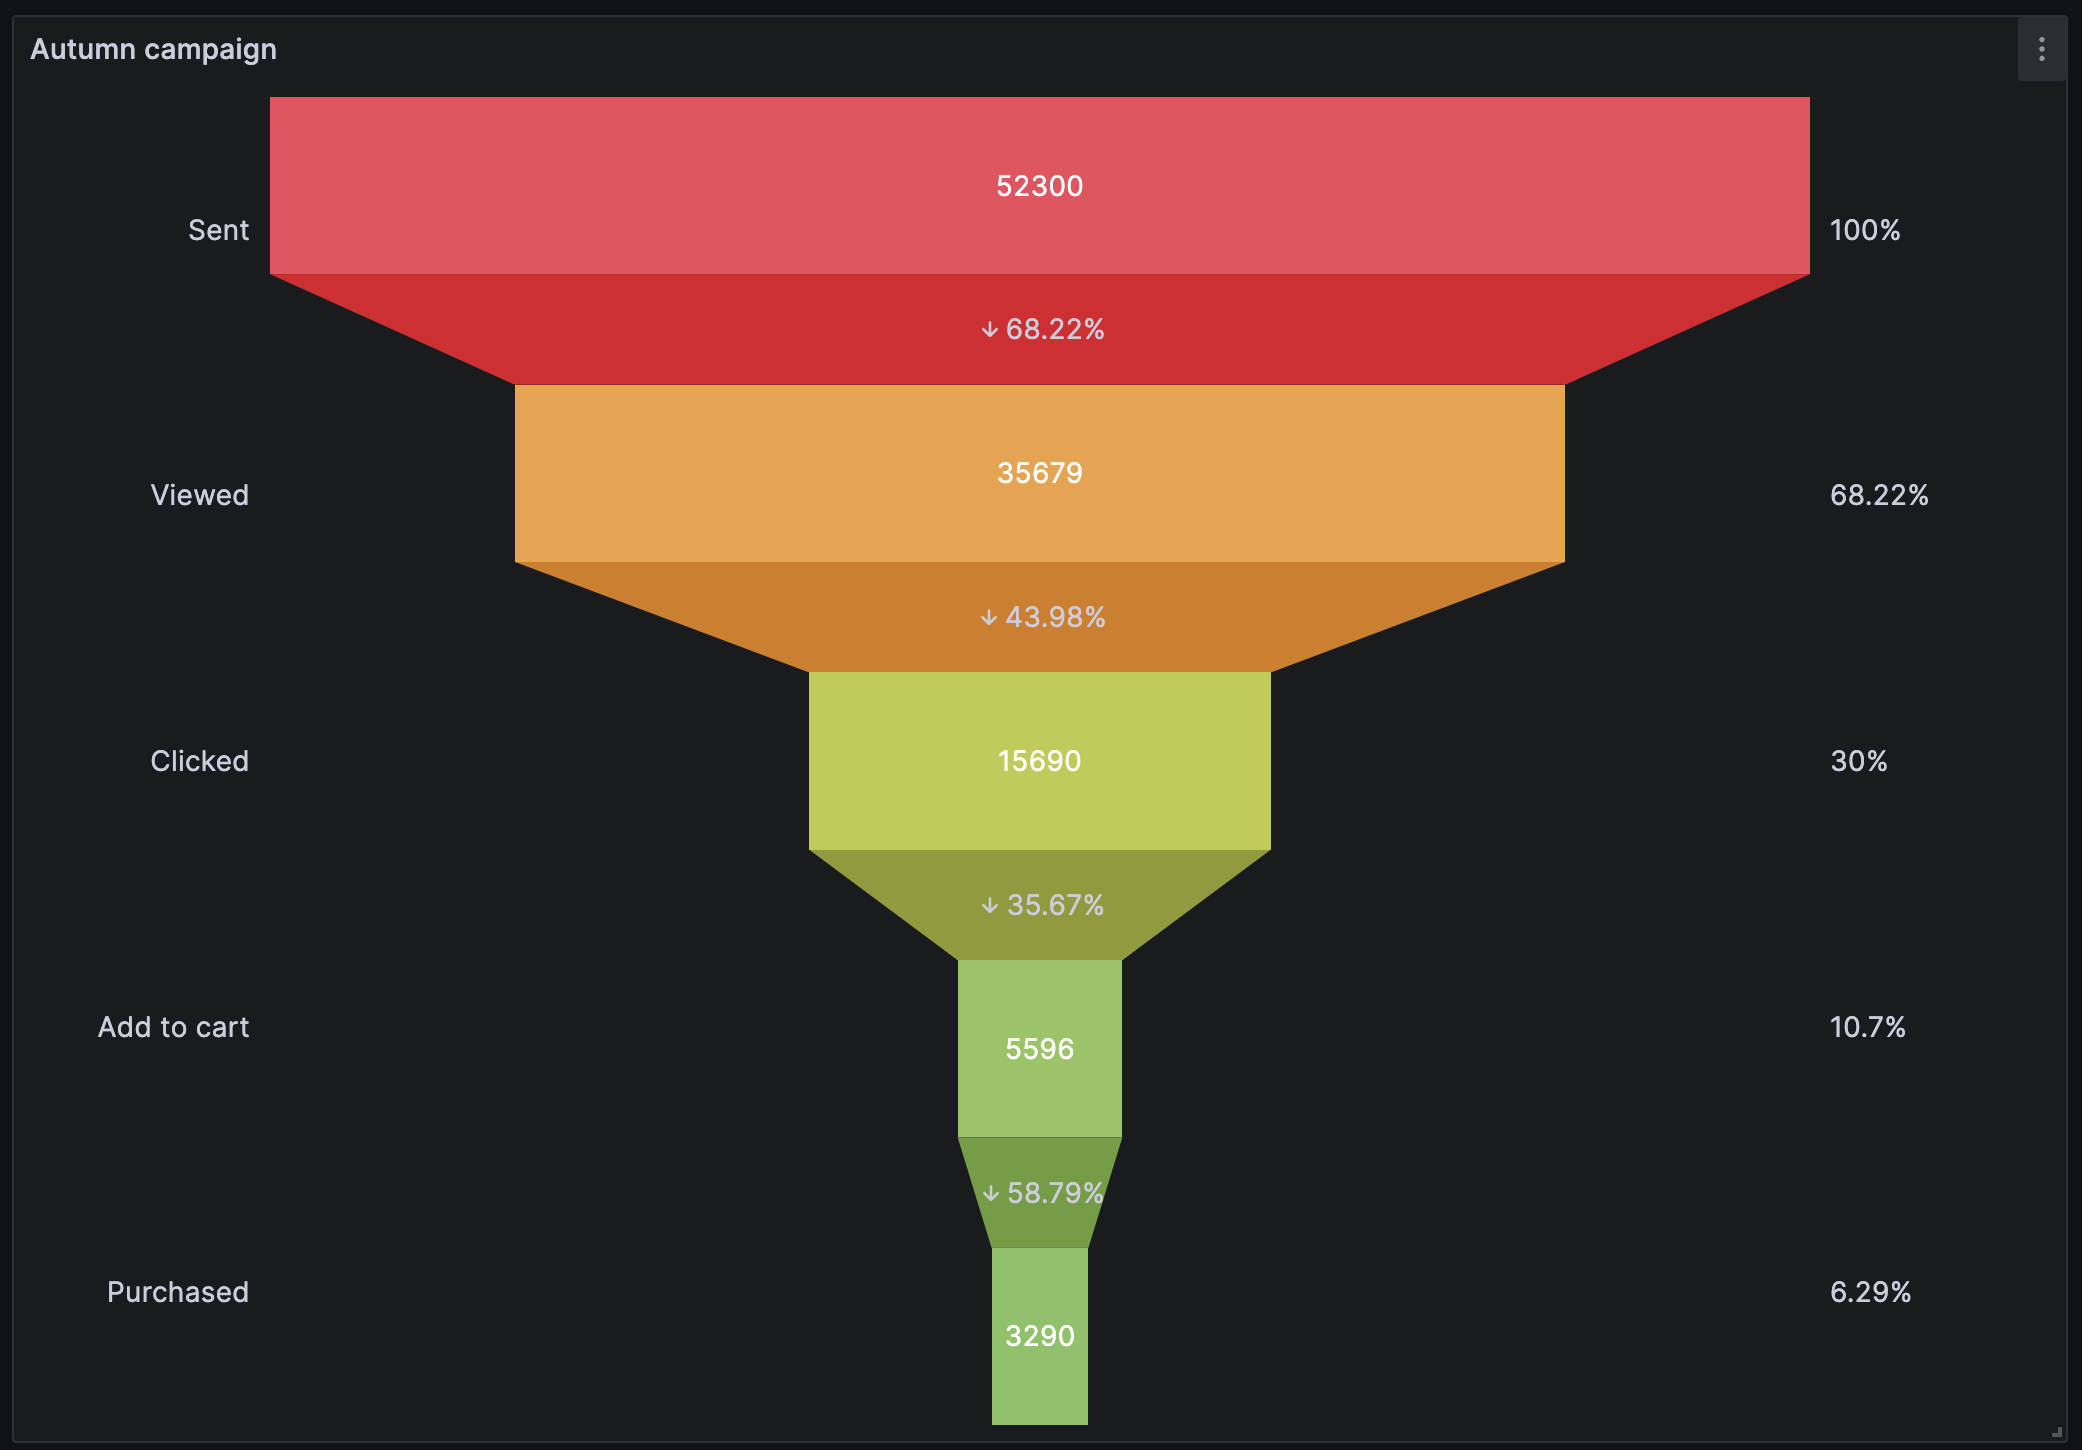


Funnel Panel
Grafana panel to create funnel charts

What are funnel charts?
A funnel chart is a specialized chart type that demonstrates the flow of e.g. users through a business or sales process. The chart takes its name from its shape, which starts from a broad head and ends in a narrow neck. The number of users at each stage of the process are indicated from the funnel’s width as it narrows.
Getting Started
The panel can be used with any data source that returns data frame(s) containing one numeric field per step in the funnel.
The easies way to achive this is to have one query per step (probably the most common way to query the data).
If your data, instead, is returned as one data frame with two fields. One field containing all the step labels and one field containing all the numeric values. We recommend using transformations (Rows to fields) to transform that data into one data frame with one field per value.
The most common scenarios for this would be if you have a pre-baked view containing the data for the funnel e.g. if you have some heavy queries running on a regular basis to aggregate the data.
FAQ
Q: The percentage values looks off in my funnel, what am I doing wrong?
A: Check the standard options for your panel. Your min value might be set to auto which will cause Grafana to normalize the data and use the lowest value in the data set as the minimum value. Try to set this value to 0 to see if it will resolve the issue. For more details see the following issue.
Contributing
- For bugs or enhancements please create an issue.
Grafana Cloud Free
- Free tier: Limited to 3 users
- Paid plans: $55 / user / month above included usage
- Access to all Enterprise Plugins
- Fully managed service (not available to self-manage)
Self-hosted Grafana Enterprise
- Access to all Enterprise plugins
- All Grafana Enterprise features
- Self-manage on your own infrastructure
Install on Grafana Cloud
Plugins can be installed directly from within your Grafana instance or automated using the Cloud API or Terraform.
Learn more about plugin installationMarketplace plugins
This is a paid plugin developed by a marketplace partner. To purchase an entitlement, sign in first, then fill out the contact form.
Get this plugin
This is a paid for plugin developed by a marketplace partner. To purchase entitlement please fill out the contact us form.
What to expect:
- Grafana Labs will reach out to discuss your needs
- Payment will be taken by Grafana Labs
- Once purchased the plugin will be available for you to install (cloud) or a signed version will be provided (on-premise)
Thank you! We will be in touch.
For more information, visit the docs on plugin installation.
Installing on a local Grafana:
For local instances, plugins are installed and updated via a simple CLI command. Plugins are not updated automatically, however you will be notified when updates are available right within your Grafana.
1. Install the Panel
Use the grafana-cli tool to install Funnel from the commandline:
grafana-cli plugins install The plugin will be installed into your grafana plugins directory; the default is /var/lib/grafana/plugins. More information on the cli tool.
Alternatively, you can manually download the .zip file for your architecture below and unpack it into your grafana plugins directory.
Alternatively, you can manually download the .zip file and unpack it into your grafana plugins directory.
2. Add the Panel to a Dashboard
Installed panels are available immediately in the Dashboards section in your Grafana main menu, and can be added like any other core panel in Grafana.
To see a list of installed panels, click the Plugins item in the main menu. Both core panels and installed panels will appear.
Changelog
1.3.0
Feature: It is now possible to configure the panel to show the bar gap as a retention instead of a drop.
1.2.0
Feature: It is now possible to configure how to sort the bars in the funnel panel.
Bugfix: Added a FAQ to highlight that you might need to set min:0 in standard options if your data is normalized by minium value.
1.1.2
Improved accessability and fixed issue with white text on light background. Big thanks to https://github.com/negrel for help fixing this.
1.1.1
Making sure to keep backwards compatability with older Grafana version when using the new Stack component.
1.1.0
Upgrade github workflows to latest version and switched to npm instead of yarn.
1.0.1
Bugfix: Funnel plugin shows drop numbers as the wrong percentage #21 Bugfix: Text contrast improved for light/dark backgrounds #19 Bugfix: Data will not be repeated weirdly when refreshing dashboard #20
1.0.0
Initial release.