Plugins 〉Business Input


Business Input
Business Input for Grafana
This project was originally contributed by Volkov Labs - thanks for all your great work!
[!CAUTION] This data source plugin is now in maintenance mode. It will continue to receive only minimal updates required for compatibility with Grafana 12.x. No new features will be developed. To ensure long-term support and access to new capabilities, we recommend using the Infinity data source plugin.
Legacy information
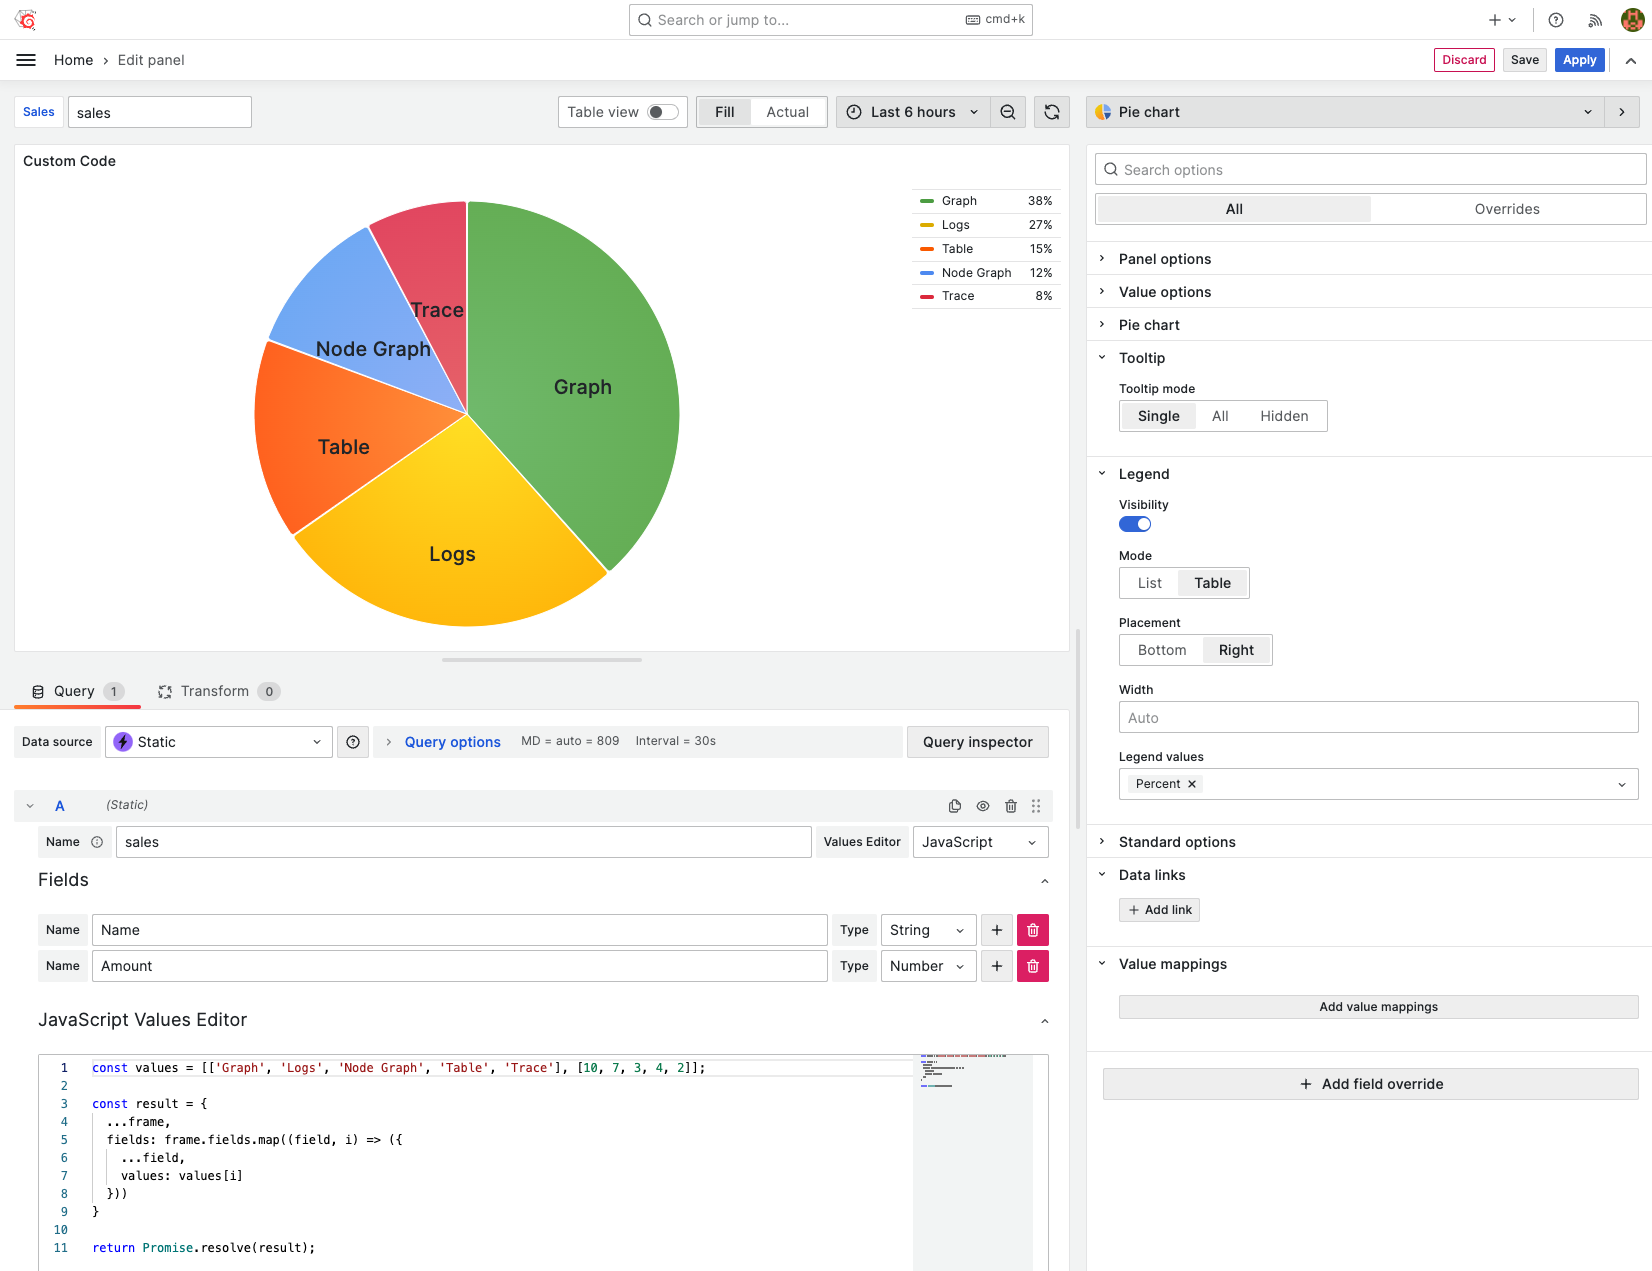
Business Input is a powerful Grafana plugin that enables you to store, emulate, and visualize static data effortlessly. Perfect for testing, prototyping, or creating custom visualizations without relying on external data sources.
🚀 Features
- Static Visualizations: Create dashboards independent of specific data sources.
- Flexible Data Input: Manually enter values or use the JavaScript Values Editor for dynamic data.
- AI-Powered Data Generation: Generate data using OpenAI and LLM applications.
- Custom Query Responses: Build tailored responses for testing or developing panel plugins.
- Dashboard Storage: Store data and images directly within Grafana dashboards.
- Variable Support: Use variables in text fields for dynamic content.
- Intuitive Inputs: Leverage Number inputs, Date Time Pickers, and Text Areas for seamless data entry.
📋 Requirements
Ensure your Grafana version matches the plugin version for compatibility:
| Plugin Version | Compatible Grafana Versions |
|---|---|
| 5.X | Grafana 11, Grafana 12 |
| 4.X | Grafana 10.3, Grafana 11 |
| 3.X | Grafana 9.2, Grafana 10 |
| 2.X | Grafana 8.5, Grafana 9 |
| 1.X | Grafana 7.3 |
🛠️ Installation
Install the Business Input data source via the Grafana Plugins Catalog or using the Grafana CLI:
grafana cli plugins install marcusolsson-static-datasource
📚 Documentation
Explore detailed guides to maximize the potential of Business Input:
| Section | Description |
|---|---|
| Provisioning | Learn how to automatically provision the data source. |
| Variables | Understand how to use variables for dynamic data. |
| Panels | See how to integrate with Grafana panels. |
| Release Notes | Stay updated with the latest features and changes. |
📜 License
This project is licensed under the Apache License Version 2.0. See the LICENSE file for details.
Grafana Cloud Free
- Free tier: Limited to 3 users
- Paid plans: $55 / user / month above included usage
- Access to all Enterprise Plugins
- Fully managed service (not available to self-manage)
Self-hosted Grafana Enterprise
- Access to all Enterprise plugins
- All Grafana Enterprise features
- Self-manage on your own infrastructure
Install on Grafana Cloud
Plugins can be installed directly from within your Grafana instance or automated using the Cloud API or Terraform.
Learn more about plugin installationMarketplace plugins
This is a paid plugin developed by a marketplace partner. To purchase an entitlement, sign in first, then fill out the contact form.
Get this plugin
This is a paid for plugin developed by a marketplace partner. To purchase entitlement please fill out the contact us form.
What to expect:
- Grafana Labs will reach out to discuss your needs
- Payment will be taken by Grafana Labs
- Once purchased the plugin will be available for you to install (cloud) or a signed version will be provided (on-premise)
Thank you! We will be in touch.
For more information, visit the docs on plugin installation.
Installing on a local Grafana:
For local instances, plugins are installed and updated via a simple CLI command. Plugins are not updated automatically, however you will be notified when updates are available right within your Grafana.
1. Install the Data Source
Use the grafana-cli tool to install Business Input from the commandline:
grafana-cli plugins install The plugin will be installed into your grafana plugins directory; the default is /var/lib/grafana/plugins. More information on the cli tool.
Alternatively, you can manually download the .zip file for your architecture below and unpack it into your grafana plugins directory.
Alternatively, you can manually download the .zip file and unpack it into your grafana plugins directory.
2. Configure the Data Source
Accessed from the Grafana main menu, newly installed data sources can be added immediately within the Data Sources section.
Next, click the Add data source button in the upper right. The data source will be available for selection in the Type select box.
To see a list of installed data sources, click the Plugins item in the main menu. Both core data sources and installed data sources will appear.
Changelog
6.1.1
- Updated frontend dependencies and fixed vulnerabilities.
6.1.0
- Preparation for react 19 update
[6.0.0] - 2026-01-06
Changed
- Requires Grafana 11.6 and dependencies.
- Migrated from Volkov Labs to Grafana Labs.
- Updated README and documentation.
[5.1.0] - 2025-09-29
Changed
- ESLint Configuration: Updated linting rules and settings for better code quality and consistency. (#104)
- LLM Behavior & Plugin Handling: Improved LLM functionality and added better error handling for cases when a plugin is not found. (#106)
- E2E Tests: Adjusted end-to-end tests to resolve compatibility issues with the Main branch. (#107)
[5.0.0] - 2025-07-21
Breaking Changes
- Requires Grafana 11 and Grafana 12.
Features & Enhancements
- Updated to Grafana 12 and dependencies (#103).
[4.5.0] - 2024-12-23
Features & Enhancements
- Added editor for boolean values (#97).
- Updated end-to-end (E2E) tests (#98).
- Updated to Grafana 11.4 and dependencies (#99).
[4.4.0] - 2024-11-18
Features & Enhancements
[4.3.0] - 2024-09-13
Features & Enhancements
- Updated "Add a row" below the rows list (#83, #84).
- Added
toDataFramehelper to code parameters (#86). - Updated to Grafana 11.2 and dependencies (#87).
- Updated code editor from business components (#89).
[4.2.0] - 2024-07-24
Breaking Changes
- Requires Grafana 10.2 and Grafana 11.
Features & Enhancements
[4.1.0] - 2024-06-25
Features & Enhancements
- Added support for OpenAI completions (#73).
- Updated E2E workflow to use Docker (#75, #77).
- Updated plugin logo (#76).
[4.0.0] - 2024-06-12
Breaking Changes
- Requires Grafana 10 and Grafana 11.
Features & Enhancements
- Updated name to Business Input Data Source (#268).
- Added plugin E2E tests and removed Cypress (#66).
- Prepared for Grafana 11 (#67).
- Updated to Grafana 11 and dependencies (#69).
- Added support for variables in code editor (#70).
[3.1.1] - 2024-03-03
Bug Fixes
- Fixed issue with reading property of undefined for empty fields (#63).
[3.1.0] - 2024-02-21
Breaking Changes
- Requires Grafana 9.2 and Grafana 10.
Features & Enhancements
- Increased test coverage (#47).
- Updated ESLint configuration and refactoring (#53).
- Added drag-and-drop for rows and fields (#54).
- Updated custom code when switching value editor from manual to JS (#59).
- Added Variable Editor with Fields and JavaScript (#58).
- Added Collapse/Expand All for Fields and Values (#57).
- Updated to Grafana 10.3.3 (#60).
[3.0.0] - 2023-06-28
Breaking Changes
- Requires Grafana 9 and Grafana 10.
Features & Enhancements
- Refactored Types and Fields Editor (#37).
- Updated tests with
testing-library/react(#40). - Updated to Grafana 10.0.0 (#41, #46).
- Migrated to Plugin Tools 1.5.2 (#42).
- Updated to Node 18 and npm (#42).
- Added E2E Cypress testing (#43).
- Added JavaScript Values Editor (#44).
- Removed Grafana 8.5 support (#46).
[2.2.0] - 2023-03-27
Features & Enhancements
- Updated CI and Release workflows (#33).
- Updated to Grafana 9.4.7 (#34).
- Updated README with documentation (#35).
- Added Scoped Variables for variable replacement (#35).
[2.1.0] - 2022-12-29
Breaking Changes
- Refactoring may introduce breaking changes. Please test before upgrading in production.
Features & Enhancements
- Updated CI to upload signed artifacts (#23).
- Added "Static data source for Grafana | Mimic any data source | Tutorial and examples" video in README (#23).
- Updated to Grafana 9.3.2 (#24).
- Refactored and improved test coverage for data source (#25).
- Updated Field and Values Editors to labels and fields structure (#27).
- Removed Frame Reducer to simplify code (#28).
- Refactored frame and field utilities (#29).
- Added Date Time Picker, Number, and Text Area Inputs (#30).
[2.0.0] - 2022-11-01
Features & Enhancements
- Maintained by Volkov Labs (#19).
- Updated based on Volkov Labs Panel Template (#19).
- Updated CI to Node 16 and synchronized with Release workflow (#20).
- Updated to Grafana 9.2.2 (#21).
- Refactored components and updated theme (#22).
[1.4.4] - 2022-08-28
Features & Enhancements
- Updated to Grafana 9.
[1.4.3] - 2021-09-03
Features & Enhancements
- Updated dependencies.
Bug Fixes
- Fixed an issue where fields and rows were added twice in development.
[1.4.2] - 2021-07-08
Features & Enhancements
- Updated metadata, docs, and dependencies.
Bug Fixes
- Fixed an issue where frame changes were not synced correctly.
[1.4.1] - 2021-06-12
Features & Enhancements
- Minor docs and metadata updates.
- Changed from
useStatetouseReducerfor manipulating form model. - Replaced custom input component with
Inputfrom@grafana/ui.
[1.4.0] - 2021-06-10
Features & Enhancements
- Added support for annotations.
- Added button for duplicating value rows.
- Added option to set preferred visualization type for Explore.
[1.3.1] - 2021-01-29
Bug Fixes
- Set reference ID on data frames.
[1.3.0] - 2021-01-29
Features & Enhancements
- Updated to new form styles. Bumps the minimum required Grafana version to 7.3.
[1.2.1] - 2020-11-27
Features & Enhancements
- Updated
@grafanadependencies from^7.0.0to^7.3.0. - Improved release process using the new GitHub workflows for Grafana plugins.