Plugins 〉Business Text


Business Text
Business Text for Grafana
![]()
![]()

This project was originally contributed by Volkov Labs - thanks for all your great work!
We have republished under the same plugin ID, keeping the community signature. This means you can simply update your plugin version. A new ID would have required manual updates to your dashboards. For additional information on the changes, see the Notices.
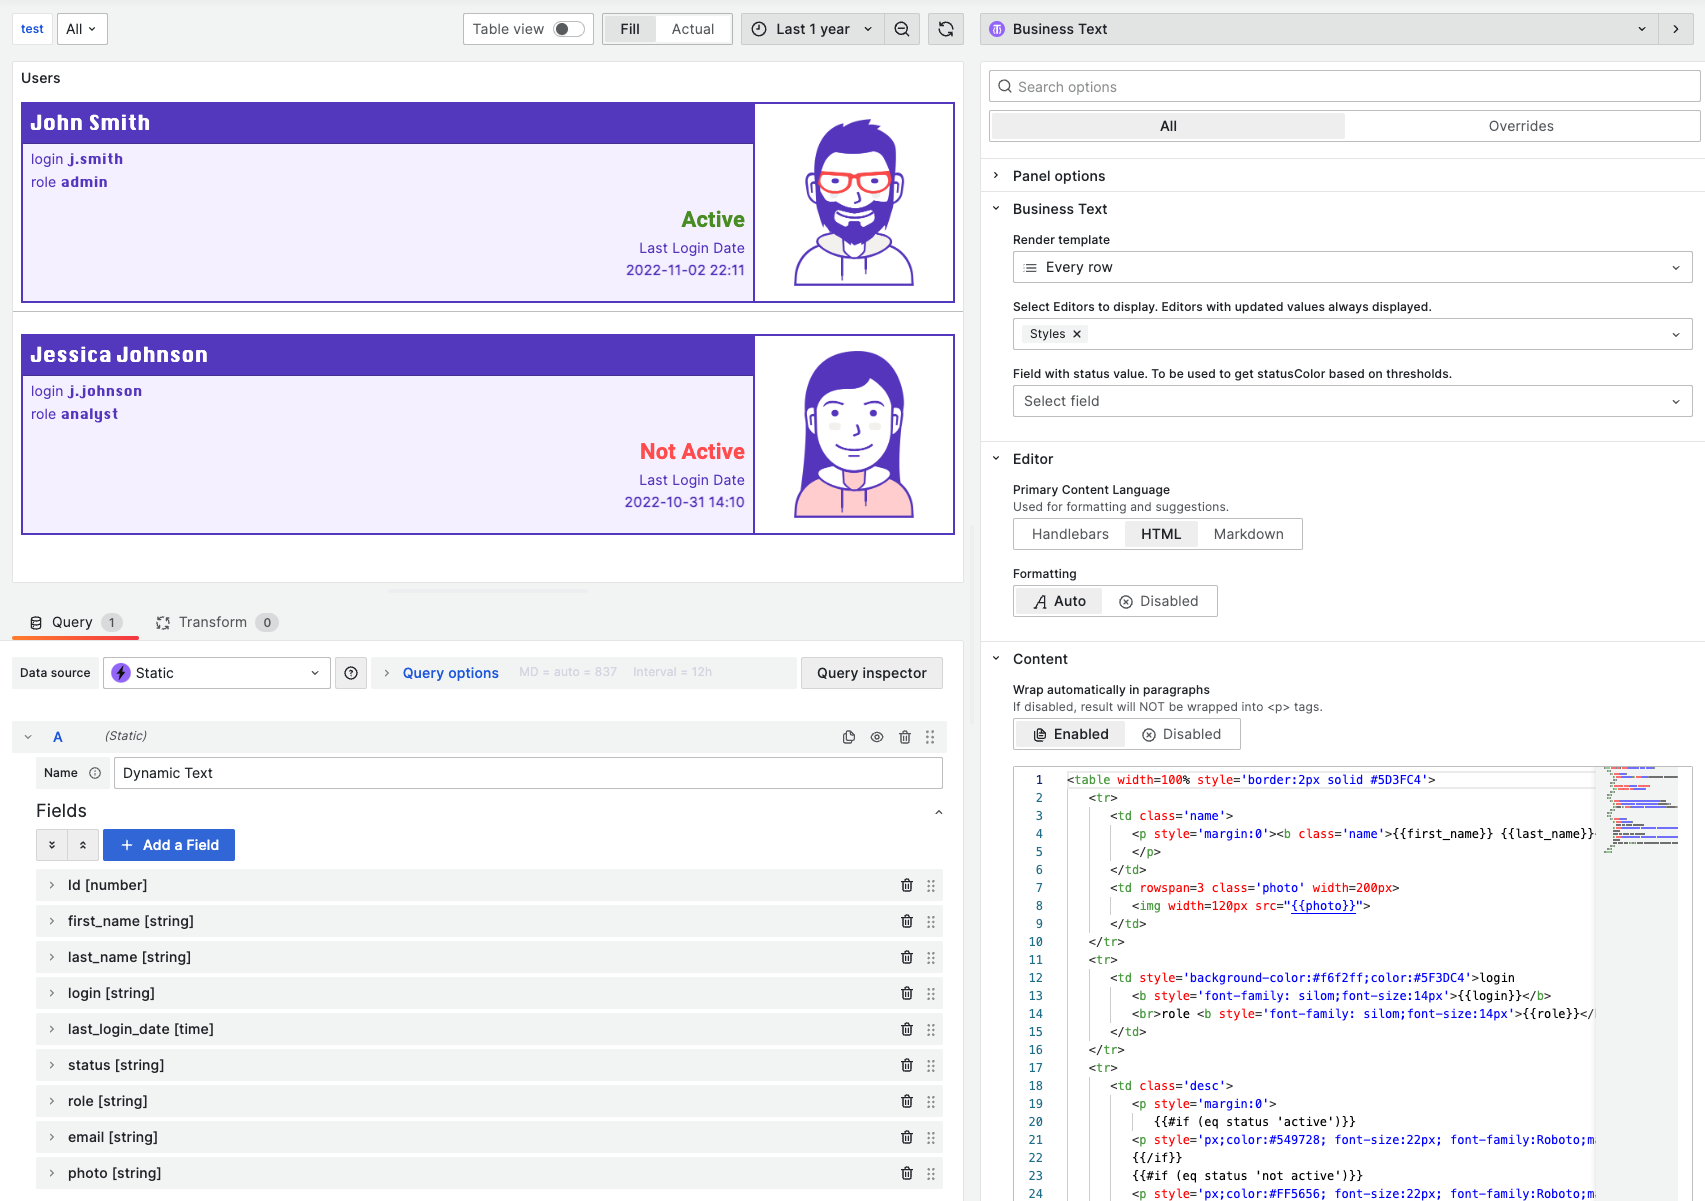
The Business Text panel plugin allows you to construct a text visualization template from the values of a dataset returned by a data source query.
Requirements
- Business Text panel 6.X requires Grafana 11 or Grafana 12.
- Business Text panel 5.X requires Grafana 10 or Grafana 11.
- Dynamic Text panel 4.X requires Grafana 9.2 or Grafana 10.
- Dynamic Text panel 2.X and 3.X require Grafana 8.5 or Grafana 9.
- Dynamic Text panel 1.X requires Grafana 7.
Getting Started
You can install the Business Text panel from the Grafana Plugins catalog or use the Grafana command line tool.
For the latter, please use the following command:
grafana cli plugins install marcusolsson-dynamictext-panel
Highlights
- Uses Monaco Code Editor with automatic JavaScript code formatting.
- Supports Markdown and Handlebars.
- Renders markdown-it into HTML elements.
- Supports the highlighting of code syntax using A11Y styles.
- Provides code sanitization:
- HTML inside templates is sanitized using XSS.
- Can be disabled in the Grafana configuration through the
disable_sanitize_htmlparameter.
- Supports display of nested objects using the
{{json object}}Handlebars helper. - Supports display of time global variables (
__toand__from) as seconds, ISO timestamps, or formatted using thedayjslibrary. - Supports adding the Handlebars helpers and event handlers.
- Supports adding CSS styles with dashboard variables.
- Supports internationalization using custom helpers.
Documentation
| Section | Description |
|---|---|
| Rendering | Explains how to create a visualization template for your data |
| Recipes | Useful snippets that you can use in your templates |
| Features | Demonstrates panel features |
| Release Notes | Stay up to date with the latest features and updates |
License
Apache License Version 2.0, see LICENSE.
Grafana Cloud Free
- Free tier: Limited to 3 users
- Paid plans: $55 / user / month above included usage
- Access to all Enterprise Plugins
- Fully managed service (not available to self-manage)
Self-hosted Grafana Enterprise
- Access to all Enterprise plugins
- All Grafana Enterprise features
- Self-manage on your own infrastructure
Install on Grafana Cloud
Plugins can be installed directly from within your Grafana instance or automated using the Cloud API or Terraform.
Learn more about plugin installationMarketplace plugins
This is a paid plugin developed by a marketplace partner. To purchase an entitlement, sign in first, then fill out the contact form.
Get this plugin
This is a paid for plugin developed by a marketplace partner. To purchase entitlement please fill out the contact us form.
What to expect:
- Grafana Labs will reach out to discuss your needs
- Payment will be taken by Grafana Labs
- Once purchased the plugin will be available for you to install (cloud) or a signed version will be provided (on-premise)
Thank you! We will be in touch.
For more information, visit the docs on plugin installation.
Installing on a local Grafana:
For local instances, plugins are installed and updated via a simple CLI command. Plugins are not updated automatically, however you will be notified when updates are available right within your Grafana.
1. Install the Panel
Use the grafana-cli tool to install Business Text from the commandline:
grafana-cli plugins install The plugin will be installed into your grafana plugins directory; the default is /var/lib/grafana/plugins. More information on the cli tool.
Alternatively, you can manually download the .zip file for your architecture below and unpack it into your grafana plugins directory.
Alternatively, you can manually download the .zip file and unpack it into your grafana plugins directory.
2. Add the Panel to a Dashboard
Installed panels are available immediately in the Dashboards section in your Grafana main menu, and can be added like any other core panel in Grafana.
To see a list of installed panels, click the Plugins item in the main menu. Both core panels and installed panels will appear.
Changelog
All notable changes to the Business Text Panel (formerly Dynamic Text Plugin) for Grafana are documented in this file.
This changelog follows the Keep a Changelog format and adheres to Semantic Versioning.
[6.3.0] - 2026-06-29
Fixed
- Fixed the panel reverting to its initial HTML and losing
afterRender(content-ready JS) changes when Grafana re-renders the panel (e.g. on a variable change or panel hover/select with the new dashboard layouts on React 19).
[6.2.3] - 2026-05-21
Fixed
- Fixed code editor minimap setting not applying after the initial render.
- Clipboard operations in the code editor toolbar now handle errors gracefully.
[6.2.0] - 2025-10-28
Project Updates
- Grafana Labs fork.
[6.1.0] - 2025-08-31
Changed
- Updated styles using theme object (#427).
- Updated ESLint configuration (#428).
- Removed Default content editor if value is empty (#429).
[6.0.0] - 2025-07-15
Breaking Changes
- Now requires Grafana 11 or 12.
Added
- Added User Preferences functionality (#425).
Changed
- Enhanced Decimals setting support in panel options (#422).
- Updated to Grafana 12 with dependency upgrades (#424).
- Fixed status color settings to avoid rendering extra columns (#421).
[5.7.0] - 2025-03-05
Added
- Introduced
context.grafana.refreshfor improved refresh handling (#387).
Changed
- Optimized external resource usage (#384).
- Updated to Grafana 11.5 with dependency updates (#402).
- Added attestation to release workflow (#402).
[5.6.0] - 2024-12-15
Changed
- Updated packages for Code Editor functionality (#380).
[5.5.0] - 2024-12-09
Added
- Added
statusColorhelper for specific field styling (#375). - Enabled variable replacement in URLs (#376).
Changed
- Improved Autosize Code Editor toolbar (#362).
- Updated E2E tests (#377).
- Updated to Grafana 11.4 with dependency upgrades (#378).
[5.4.0] - 2024-09-12
Added
- Added wrap button to the code editor (#359).
Changed
- Improved panel rendering when the first data source has no data (#353).
- Enhanced partials loading and hyperlinks styling (#358).
[5.3.0] - 2024-08-22
Added
- Introduced partials for loading external HTML (#345).
- Added expandable editors for better usability (#348).
Changed
- Updated provisioning dashboard features (#346).
[5.2.0] - 2024-07-25
Changed
- Streamlined helpers migration process (#338).
- Updated to Grafana 11.1 with dependency updates (#339).
[5.1.0] - 2024-07-01
Added
- Added support for running E2E tests in Docker (#323).
Changed
- Made before-render code asynchronous and passed markdown instance (#322).
- Updated video tutorial content (#330).
[5.0.0] - 2024-06-06
Breaking Changes
- Now requires Grafana 10 or 11.
- Removed external scripts (deprecated in Grafana 11); use
importinstead. - Deprecated non-context code parameters; update to use
context(see migration guide below).
Code Parameters Migration Guide
data→context.datadataFrame→context.dataFrameeventBus→context.grafana.eventBusgetLocale→context.grafana.getLocalehandlebars→context.handlebarslocationService→context.grafana.locationServicepanelData→context.panelDatareplaceVariables→context.grafana.replaceVariablestimeRange→context.grafana.timeRangetimezone→context.grafana.timezone
Added
- Introduced plugin E2E tests, replacing Cypress (#301).
- Added ES6 Modules support (#312).
- Added Units and Decimals in panel options (#311).
Changed
- Renamed to Business Text Panel (#304).
- Prepared for Grafana 11 compatibility (#304).
- Updated to Grafana 11.0 with dependency upgrades (#315).
[4.5.0] - 2024-03-13
Added
- Added info message when sanitize is enabled (#290).
Changed
[4.4.0] - 2024-03-06
Breaking Changes
- Requires Grafana 9.2 or 10.
Added
- Added theme object,
notifySuccess, andnotifyErrorfunctions (#270). - Introduced Code Parameters Builder to replace custom code parameters (#285).
Changed
- Updated context parameter handling (#270).
- Updated dependencies and GitHub Actions (#271).
- Changed CSS class from Row to Panel (#272).
- Adjusted editor auto-height from fixed value (#278).
- Disabled
unitScaleandfieldMinMaxstandard panel options (#286).
Bug Fixes
- Fixed
statusColorfor Row elements (#280).
[4.3.0] - 2023-12-25
Added
- Added data render mode and selected data frame passing (#246).
- Introduced
variableValuehelper and re-render on dashboard refresh (#252).
Changed
- Updated ESLint configuration and refactored code (#239).
- Updated Collapse component from
@volkovlabs/components(#239). - Updated introduction video in README (#240).
- Updated to Grafana 10.2.2 and Volkov Labs packages (#247).
Bug Fixes
- Fixed draggable icon issue in Grafana 10.3 (#249).
[4.2.0] - 2023-11-20
Added
- Added ESLint deprecation check (#203).
- Introduced custom code option called after content is ready (#231).
- Added option to enable/disable wrapping for empty lines in HTML (#235).
- Added Handlebars helpers (
startsWith,endsWith,match) (#211).
Changed
- Updated ESLint configuration and sorted imports (#236).
- Updated to Plugin Tools 2.1.1 (#236).
- Used Grafana Access Policy to sign plugin (#236).
- Updated to Grafana 10.2.1 (#237).
[4.1.0] - 2023-07-16
Added
Changed
- Updated ESLint configuration (#192).
- Increased test coverage (#194).
- Updated to Grafana 10.0.2 dependencies (#201).
[4.0.0] - 2023-06-26
Breaking Changes
- Requires Grafana 9 or 10.
Added
- Added Event Bus object to JavaScript functions (#179).
- Introduced E2E Cypress testing (#184).
- Added support for variables in CSS styles editor (#185).
Changed
- Increased test coverage and updated to
testing-library/react(#177). - Migrated to Plugin Tools 1.5.2 (#183).
- Updated to Grafana 10.0.0 (#166, #178, #183).
- Updated to Node 18 and npm (#183).
- Removed Grafana 8.5 support (#183).
[3.1.0] - 2023-03-12
Added
- Added Time Zone and Range parameters for JavaScript code (#155).
- Added "Magic (JavaScript) Trio" tutorial in README (#157).
- Introduced Replace Variables and Location Service parameters for JavaScript code (#160).
Changed
[3.0.0] - 2023-02-19
Breaking Changes
- Default Content and JavaScript editors are hidden unless modified. Select required editors (including new Styles) from the list to display them.
Added
- Added custom styles support (#149).
- Introduced option to display optional editors (#149).
- Added code syntax highlighting (#151).
- Documented breaking changes for optional editors (#152).
Changed
- Updated README with JavaScript Code Editor features (#141).
- Updated to Grafana 9.3.6 (#147).
- Updated CI and release workflows (#147).
- Added JavaScript tutorial to README (#148).
- Removed panel padding (#150).
[2.2.0] - 2023-01-09
Added
- Added JSON helper for displaying objects and arrays (#121).
- Introduced Split Helper (#132).
- Added JavaScript code support for Handlebars helpers and event handlers (#134).
- Added
getLocale()parameter to JavaScript code (#137).
Changed
- Updated to Grafana 9.3.1 (#122).
- Updated documentation links (#130, #131).
- Refactored Text Component and styles (#133).
- Set default Content to
{{json @root}}and Code Editor height to200px(#134). - Adjusted CSS to fit images to screen (#135).
[2.1.0] - 2022-11-27
Breaking Changes
- Refactoring may introduce breaking changes; test before upgrading in production.
Added
- Added support for time formatting syntax parsing (#86).
- Introduced option to disable HTML sanitization (#118).
Changed
- Fixed broken link in README (#111).
- Updated CI to upload signed artifacts (#113).
- Fixed data rendering with transformations (#98).
- Updated Panel Options to Monaco Code Editor (#114).
- Increased test coverage (#114).
- Refactored alert message and text options (#117).
[2.0.0] - 2022-11-02
Breaking Changes
- Minimum required Grafana version bumped to >=8.5.
Added
- Added "Dynamic Text Plugin for Grafana" video in README (#106).
Changed
- Maintained by Volkov Labs (#100).
- Updated based on Volkov Labs Panel Template (#100).
- Updated to Grafana 9.1.6 (#104).
- Updated CI to Node 16 and synchronized with release workflow (#107).
- Updated to Grafana 9.2.2 (#108).
- Updated screenshot and provisioning (#109).
[1.9.0] - 2022-01-09
Added
- Added option to render templates per row or as a single template, useful for creating tables from query results (#53) (Thanks @andykingking).
Bug Fixes
- Fixed visibility of dropdown for selecting multiple frames due to overflow (#65).
[1.8.0] - 2021-11-19
Added
- Added
containshelper (#48).
Changed
- Upgraded dependencies.
[1.7.2] - 2021-06-21
Changed
- Improved error handling to avoid dashboard refresh on template errors.
[1.7.1] - 2021-06-15
Changed
- Updated docs and metadata.
- Upgraded dependencies.
[1.7.0] - 2021-03-08
Added
- Added options for default content on empty query results (#15).
[1.6.0] - 2021-03-04
Changed
- Improved error handling.
[1.5.0] - 2021-02-16
Changed
- Avoided recompiling templates on every render.
[1.4.0] - 2021-01-08
Changed
- Updated
@grafana/*packages. - Improved styling for tables and blockquotes.
[1.3.0] - 2021-01-08
Added
[1.2.1] - 2020-11-27
Changed
- Updated
@grafanadependencies from^7.0.0to^7.3.0. - Improved release process using GitHub workflows for Grafana plugins.
- Added screenshot.