Plugins 〉LinkSmart SensorThings


LinkSmart SensorThings
Grafana OGC SensorThings Plugin
This plugin enables the visualization of sensor and location data from an OGC SensorThings server on Grafana.
It provides:
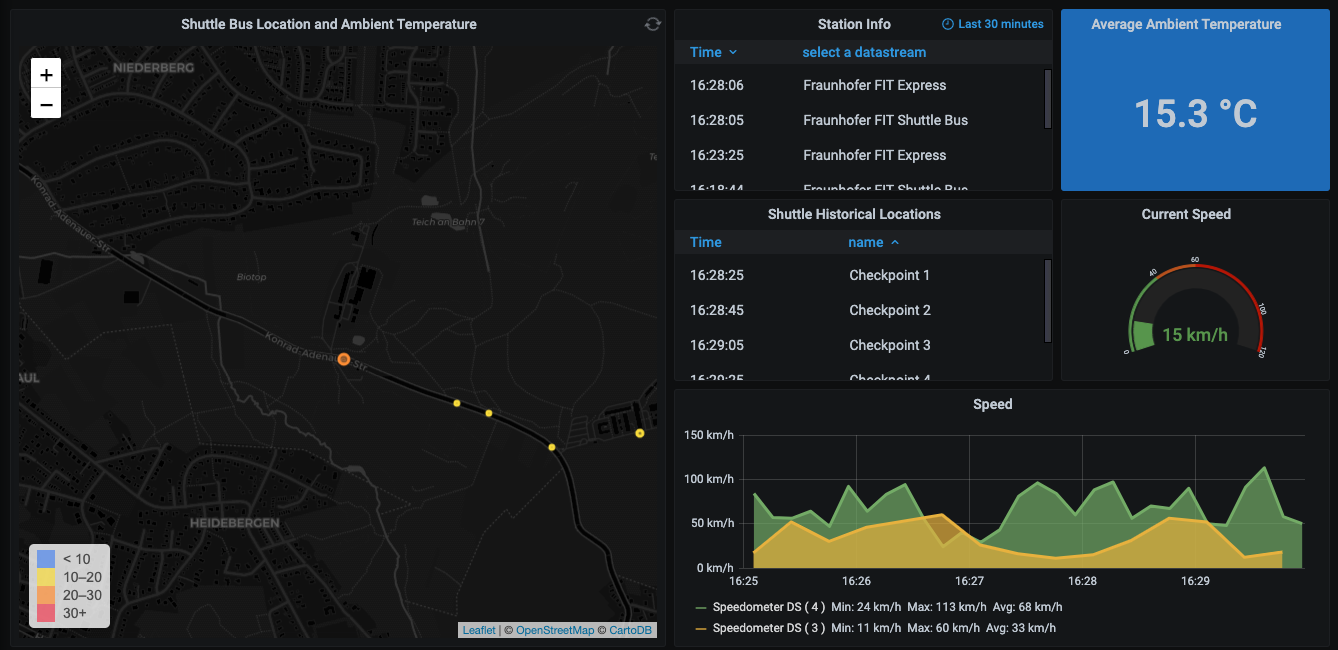
- Time-series visualization on Graph
- Time-series and location history in Table
- Sensor data in Singlestat
- Location of things on Worldmap Panel
- JSONPath support for extracting values from OM_Observation observations
Demo
A live dashboard showing SensorThings data in Grafana panels: SensorThings Dashboard
Installation
Install via grafana-cli
sudo grafana-cli plugins install linksmart-sensorthings-datasource
Install from source
- Clone the repository into Grafana's plugin directory:
git clone https://github.com/linksmart/grafana-sensorthings-datasource.git linksmart-sensorthings-datasource
- Restart Grafana server to see the newly added datasource.
Setup
- Go to Grafana Configuration.
- Select
Add data source. - Provide the necessary details to connect with OGC SensorThings server.
| Name | Description |
|---|---|
| Name | The data source name. |
| Default | Set this as the default plugin for new panels. |
| Type | Choose SensorThings Datasource. |
| Url | OGC SensorThings API root URL (e.g. http://localhost:8080/v1.0). Note the URL has no trailing slash ("/"). |
| Access | Proxy: Let Grafana server proxy the requests to OGC SensorThings API server. |
| Basic Auth | Authenticate to OGC SensorThings API server (if required, provide User and Password) |

- Save & Test, you should see this confirmation:

Query Configuration
Graph view
To visualize the observations from OGC SensorThings server,
- Add a graph panel.
- Select the SensorThings Datasource.
- Select
SensororThingsto get the list of sensors or things which are available in your SensorThings server. - Select a specific sensor or thing from the list, to get the list of datastreams.
- Select a datastream to visualize the observations in the graph.
See the demo below for better understanding:

Table view
Using table view, one can see list of observation recorded based on Sensors/Things, and also list of Locations visited by a Thing or list of Things that has been in a specific Location.
- Add a table panel.
- Select the SensorThings Datasource.
- Select
Sensors,Things,Locations, orHistorical Locationsfrom the initial dropdown list.
See the demo below for better understanding:

World Map view
Using world map view, one can see the current Location of a Thing on the map.
Install world map panel from grafana plugin store.
Add a world map panel in dashboard
In "Worldmap" tab:
- Select
Center->Last GeoHash - Set
Min Circle SizeandMax Circle Sizeto 5 - Select
Location Data->json result
- Select
In "Metrics" tab:
- Select the OGC SensorThings Datasource.
- Select a "Thing" from dropdown list.
See the demo below for better understanding:

Dev setup
npm install
npm run watch
Links
Grafana Cloud Free
- Free tier: Limited to 3 users
- Paid plans: $55 / user / month above included usage
- Access to all Enterprise Plugins
- Fully managed service (not available to self-manage)
Self-hosted Grafana Enterprise
- Access to all Enterprise plugins
- All Grafana Enterprise features
- Self-manage on your own infrastructure
Install on Grafana Cloud
Plugins can be installed directly from within your Grafana instance or automated using the Cloud API or Terraform.
Learn more about plugin installationMarketplace plugins
This is a paid plugin developed by a marketplace partner. To purchase an entitlement, sign in first, then fill out the contact form.
Get this plugin
This is a paid for plugin developed by a marketplace partner. To purchase entitlement please fill out the contact us form.
What to expect:
- Grafana Labs will reach out to discuss your needs
- Payment will be taken by Grafana Labs
- Once purchased the plugin will be available for you to install (cloud) or a signed version will be provided (on-premise)
Thank you! We will be in touch.
For more information, visit the docs on plugin installation.
Installing on a local Grafana:
For local instances, plugins are installed and updated via a simple CLI command. Plugins are not updated automatically, however you will be notified when updates are available right within your Grafana.
1. Install the Data Source
Use the grafana-cli tool to install LinkSmart SensorThings from the commandline:
grafana-cli plugins install The plugin will be installed into your grafana plugins directory; the default is /var/lib/grafana/plugins. More information on the cli tool.
Alternatively, you can manually download the .zip file for your architecture below and unpack it into your grafana plugins directory.
Alternatively, you can manually download the .zip file and unpack it into your grafana plugins directory.
2. Configure the Data Source
Accessed from the Grafana main menu, newly installed data sources can be added immediately within the Data Sources section.
Next, click the Add data source button in the upper right. The data source will be available for selection in the Type select box.
To see a list of installed data sources, click the Plugins item in the main menu. Both core data sources and installed data sources will appear.