Plugins 〉CompareQueries


CompareQueries
![]()

Overview
This data source plugin enables data comparison capabilities by supporting queries from multiple data sources. It allows you to use custom time shifts to display data from different time ranges within a single graph.
Key features:
- Compatible with Grafana 11/12/13+
- Resolves issues with undefined data points
- Introduces support for timeShift aliases
- Supports Grafana Alerting through backend execution

Quick start
Step 1. Add the real target datasource you want to compare, such as Elasticsearch. CompareQueries does not store metrics by itself; it runs queries against this target datasource.
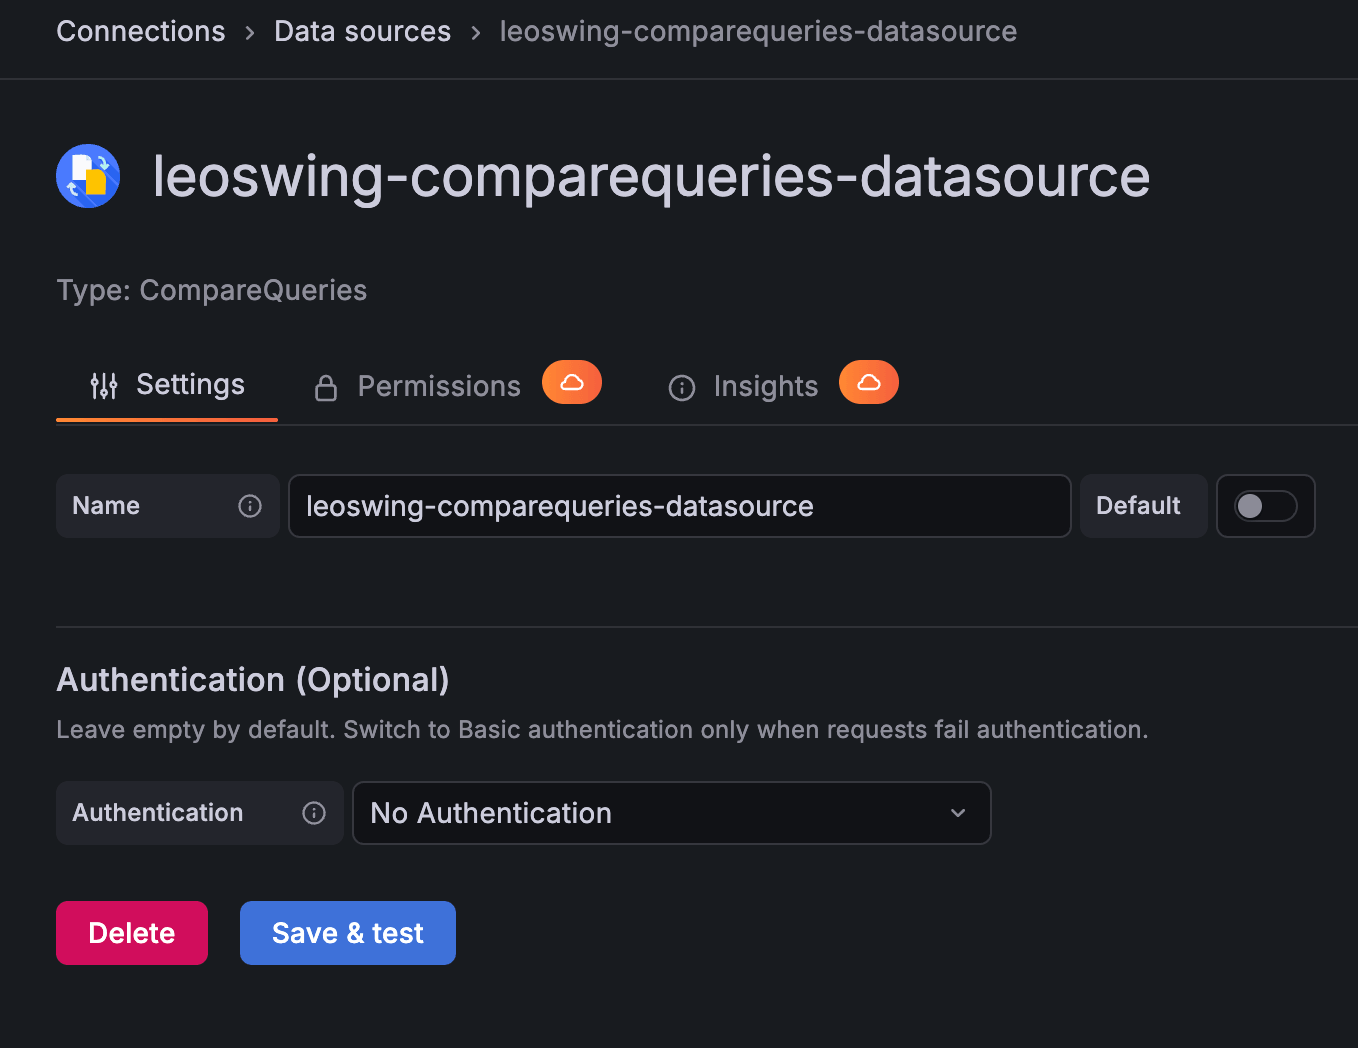
Step 2. Create a datasource of type CompareQueries.
Grafana -> Connections -> Data sources -> Add new data source -> search compare.

Step 3. Configure CompareQueries datasource settings.
Authentication (Optional)defaults toNo Authentication- Switch to
Basic authenticationonly when backend or alerting requests fail authentication - Fill
Service Accountand optionalGrafana URLonly in that case
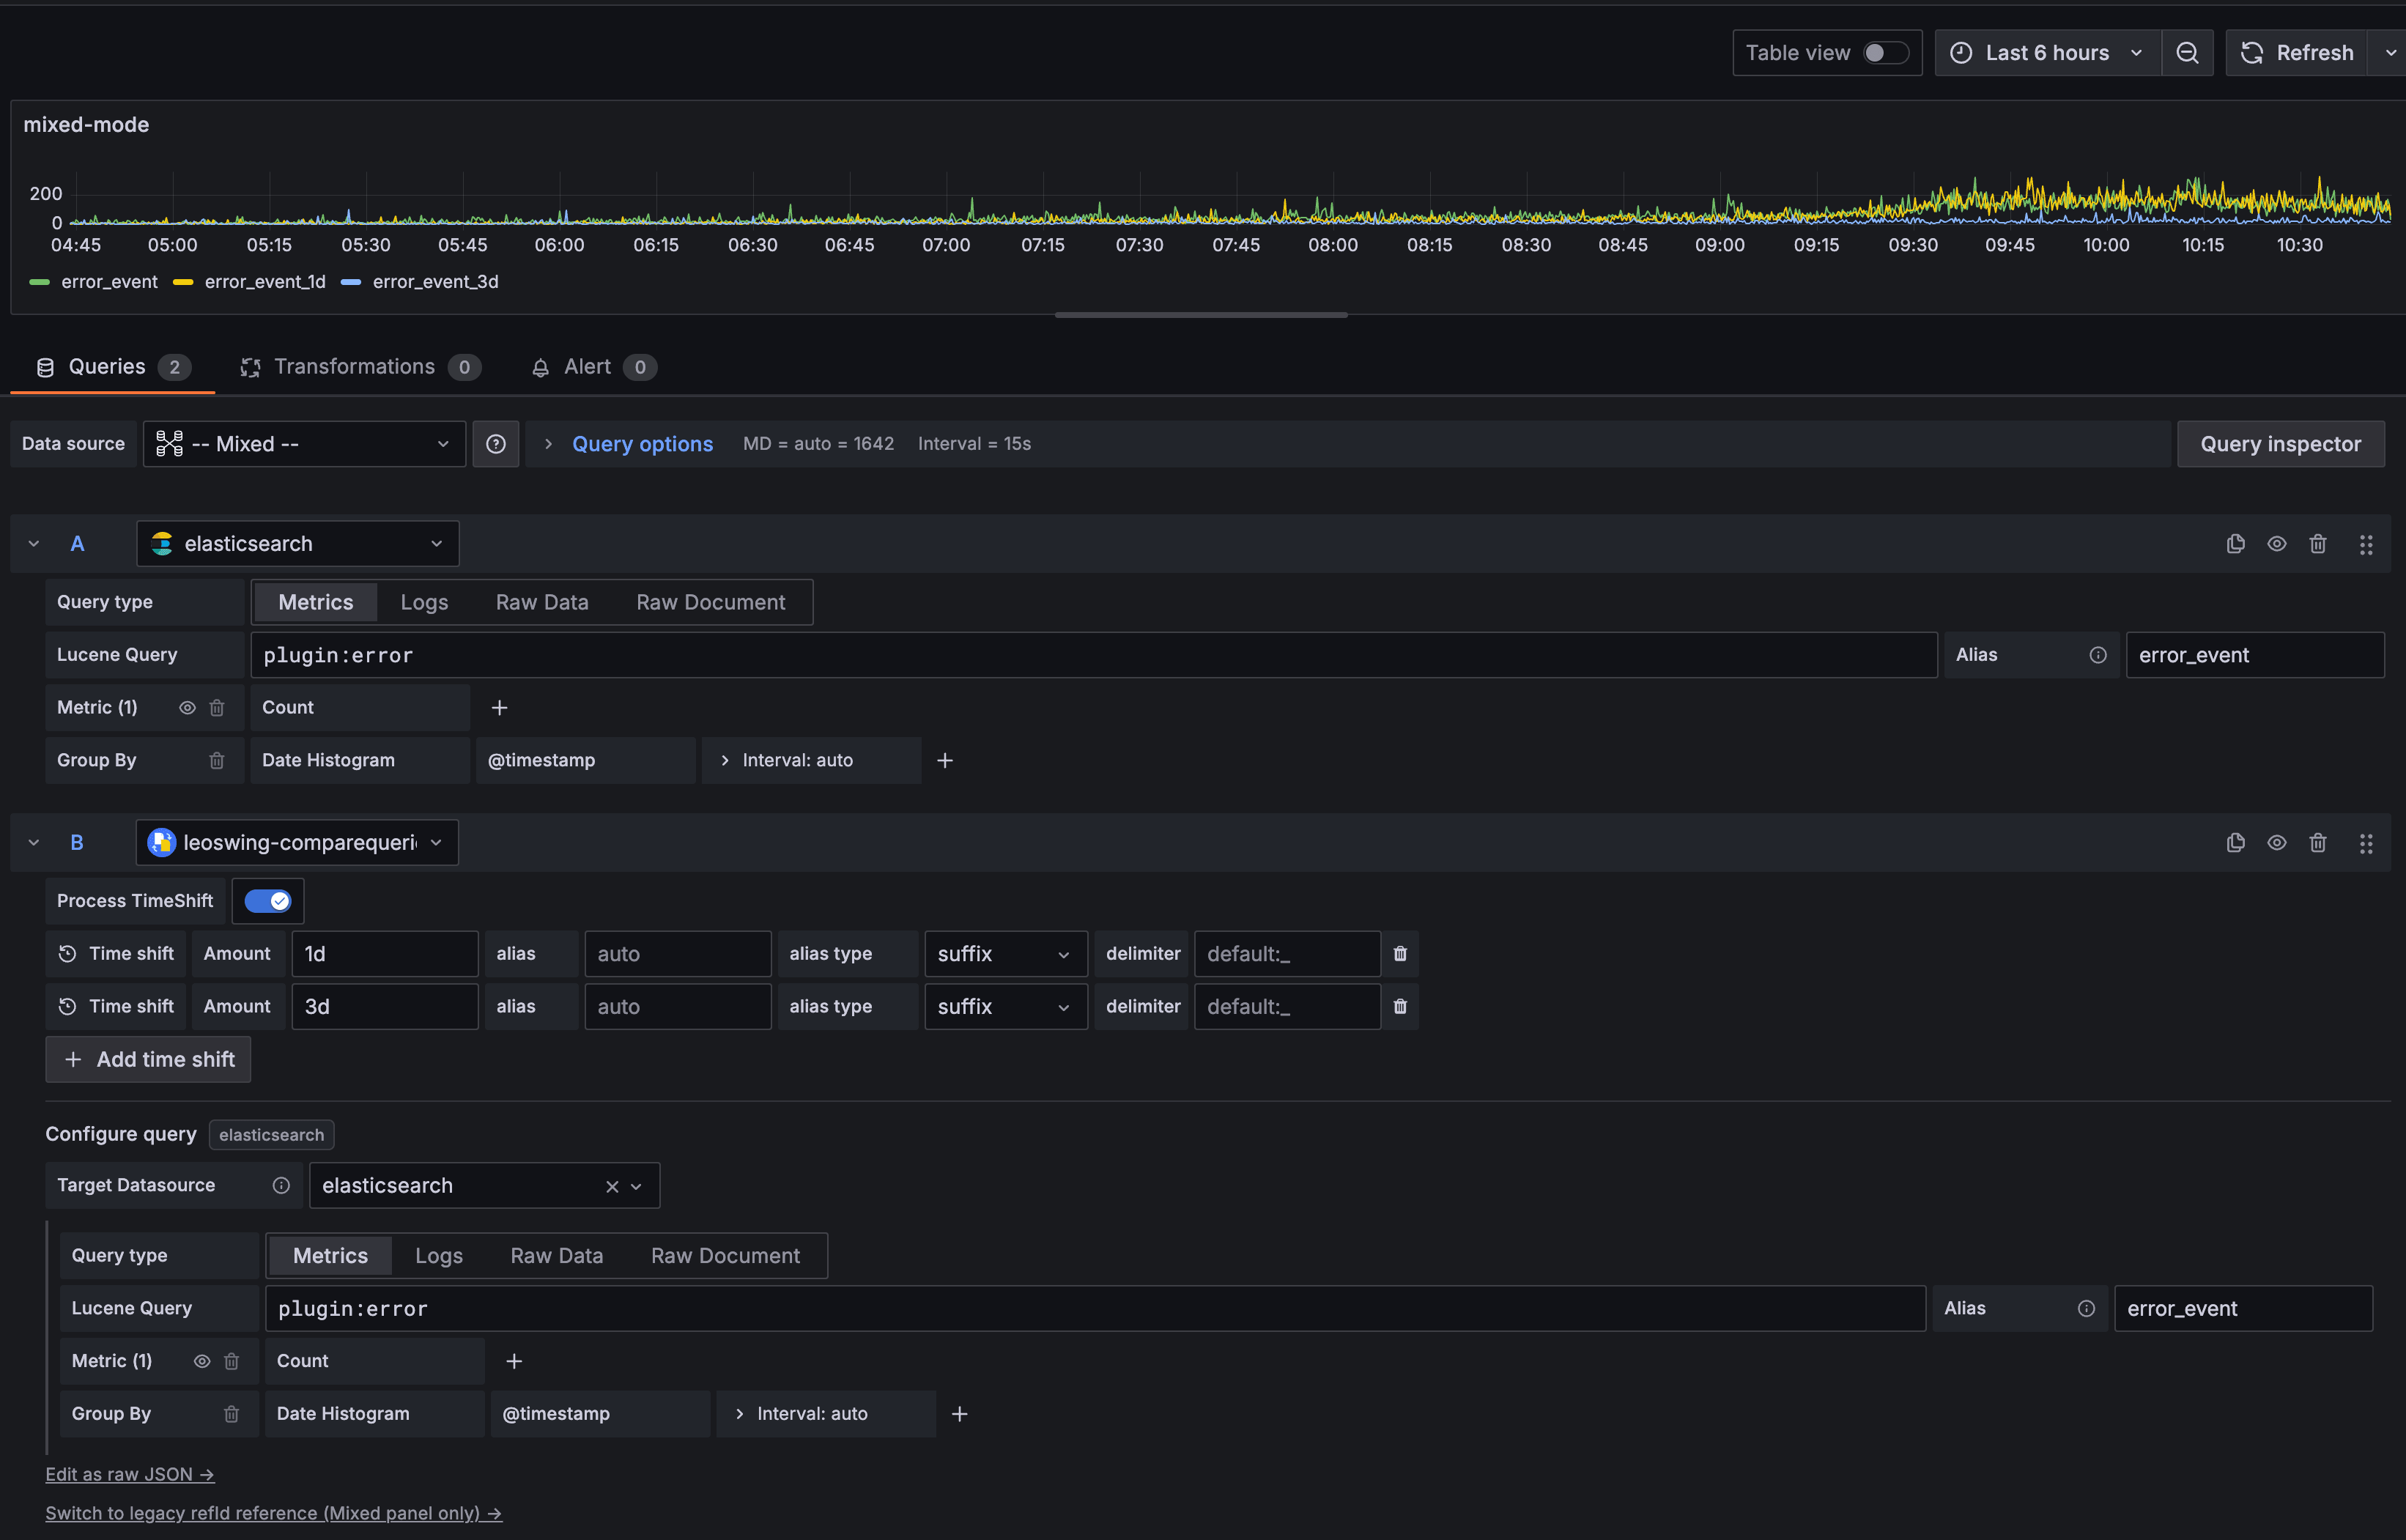
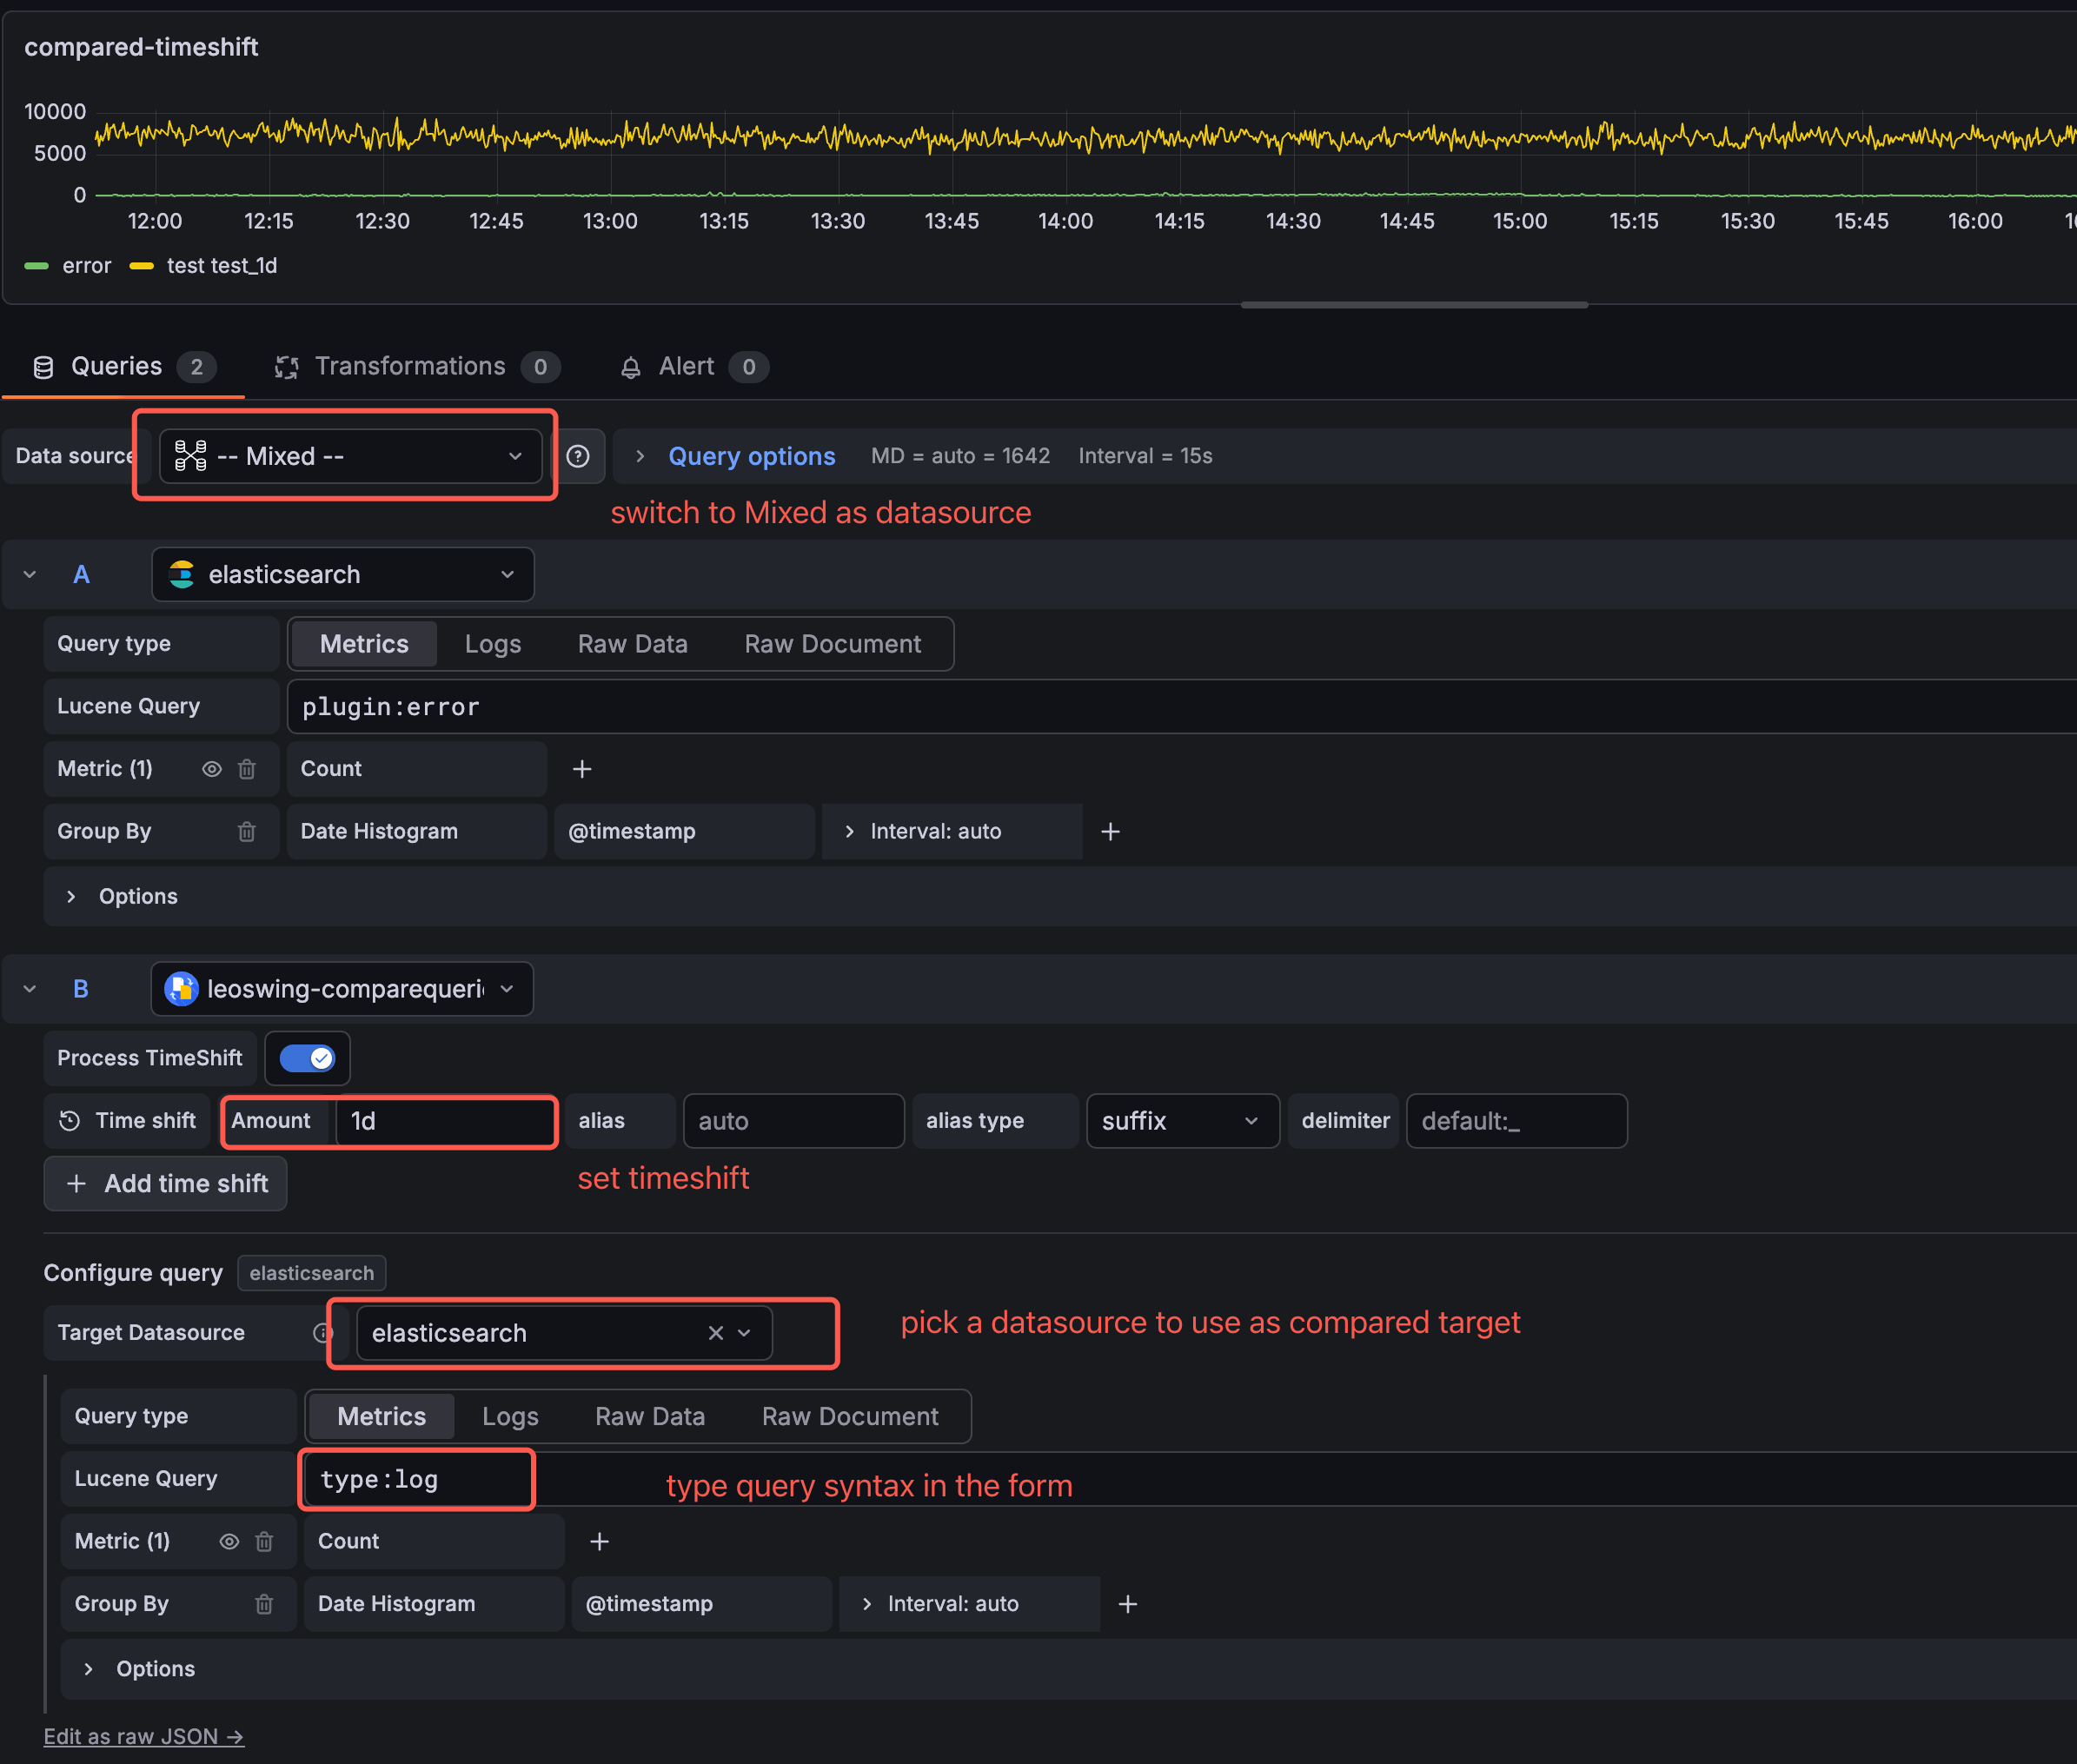
Step 4. Create a dashboard panel and set panel datasource to -- Mixed --.
Step 5. Add a query row and select CompareQueries as that row's datasource.
Step 6. Pick Target Datasource inside CompareQueries, build target query inline, and add time shift rows (Amount like 1d, 1w, etc.).
Legacy RefId usage (Grafana < 13 existing dashboards only)
Use this only if you are on Grafana versions below 13 and already have dashboards using the old CompareQueries RefId workflow.
- Query A: build normal source query (e.g. Elasticsearch)
- Query B: use CompareQueries and reference Query A by RefId
- Keep panel datasource as
-- Mixed --
For Grafana 13+, use Step 4 recommended flow instead: select Target Datasource inside CompareQueries.
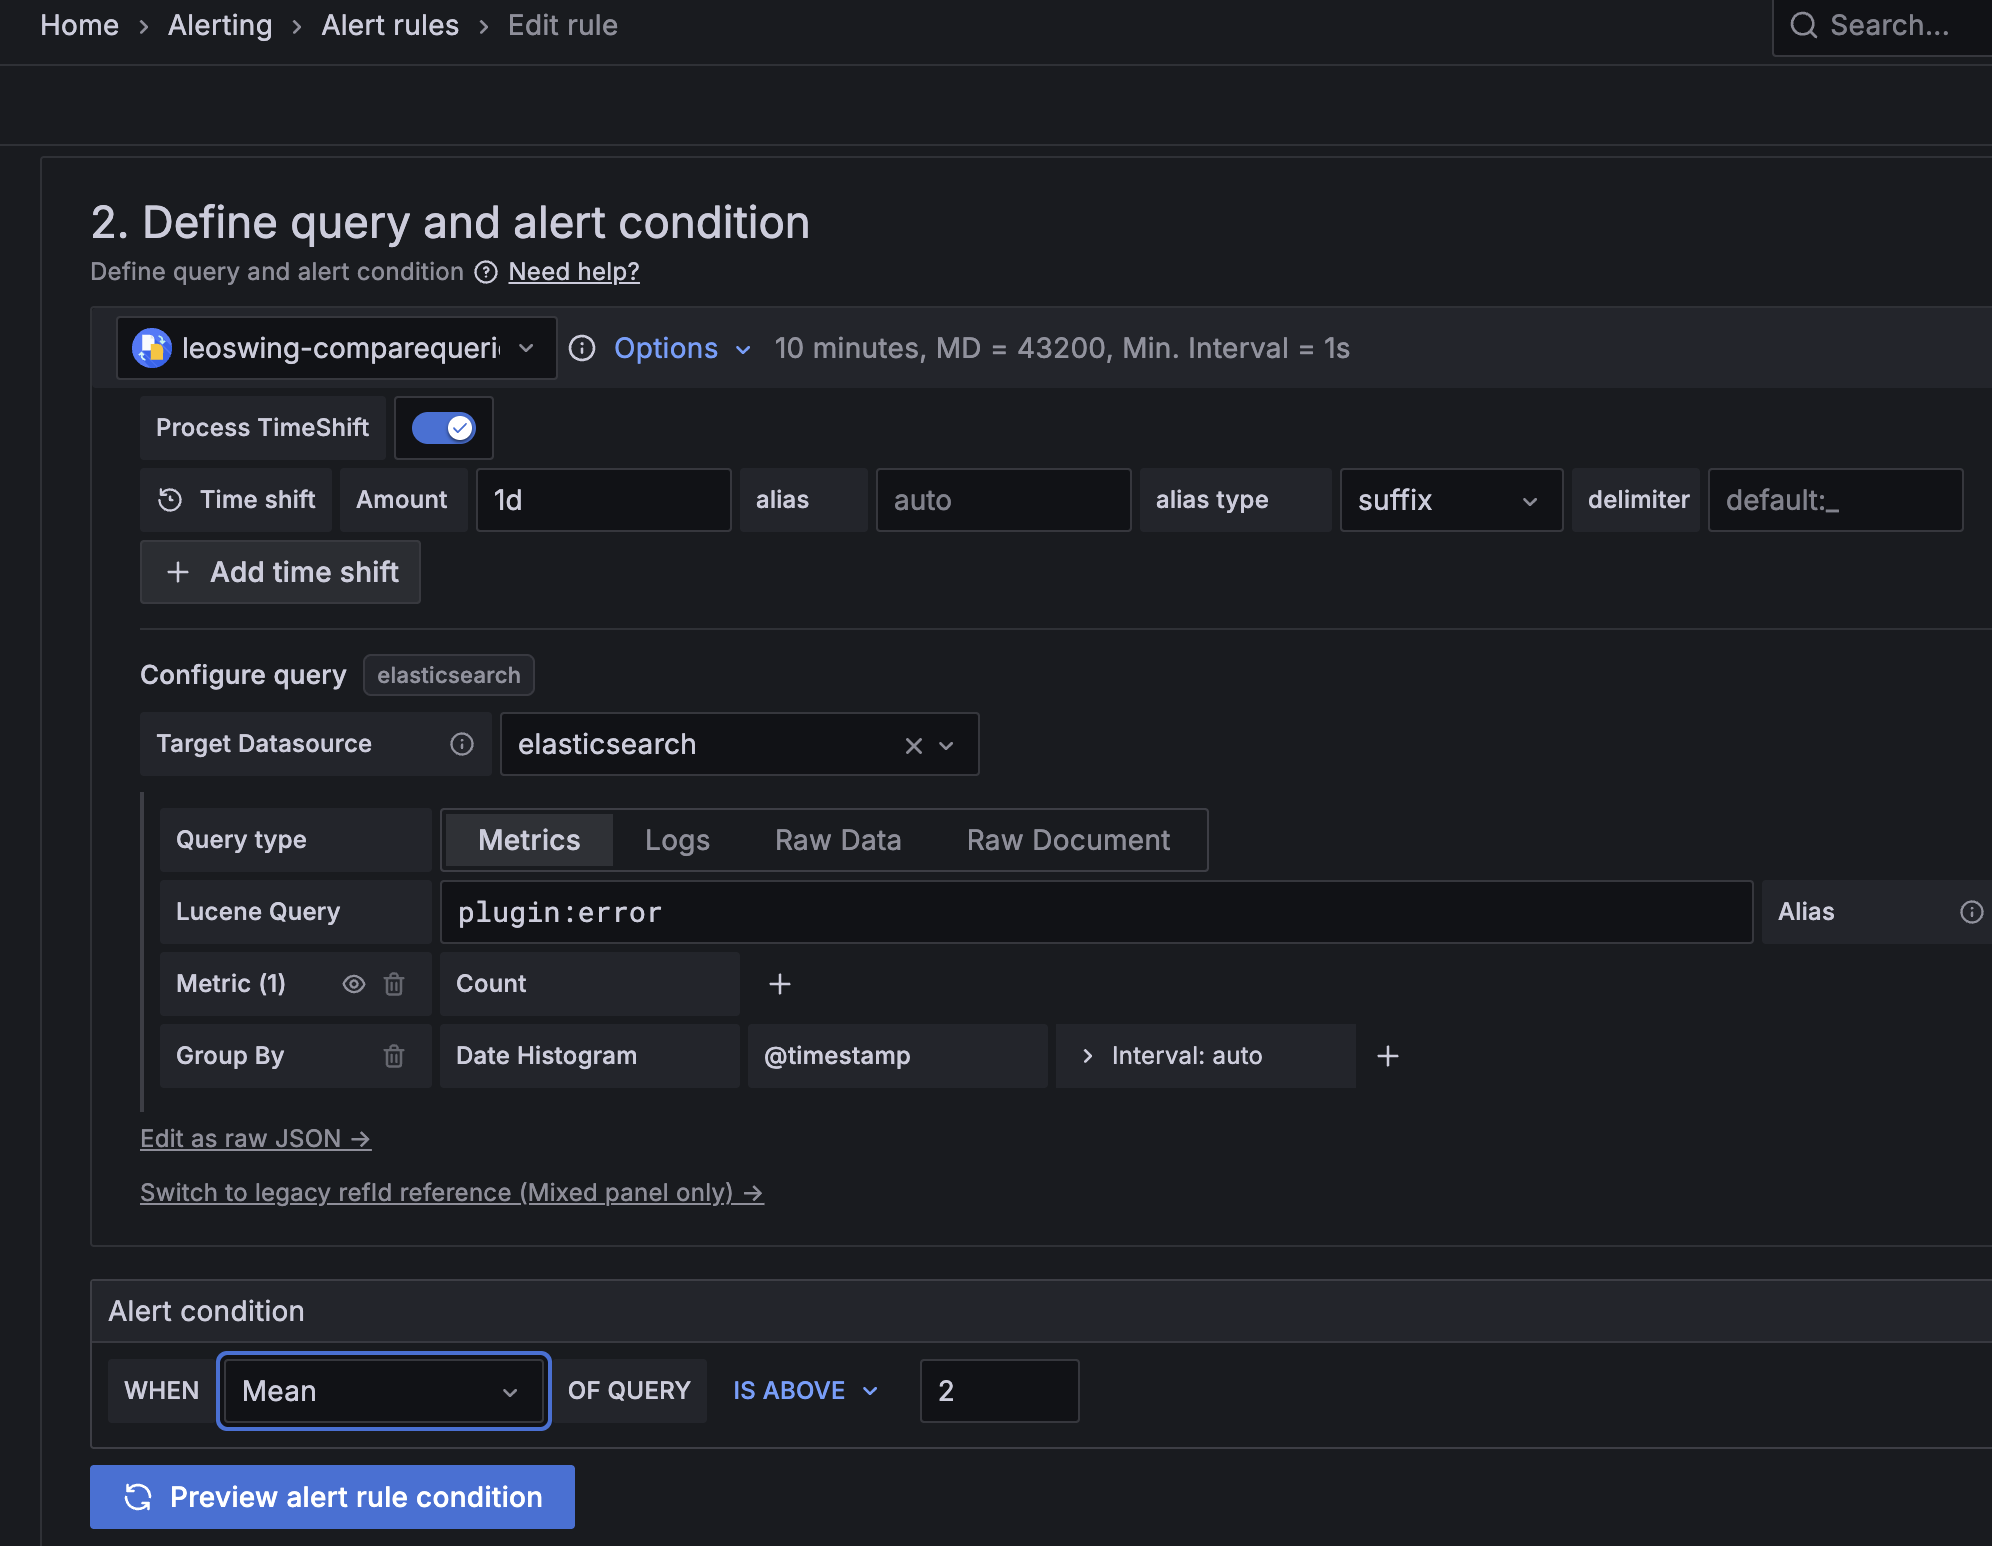
Grafana Alerting (2.1.0+)
Alerting uses backend execution. Alert rules do not use the panel -- Mixed -- datasource flow.
Configure CompareQueries directly with Target Datasource, Time shift, and query inline.
- Default datasource auth mode is
No Authentication. - If backend or alerting requests fail authentication, switch to
Basic authentication. - In
Basic authentication, configureService Accounttoken and (optionally)Grafana URL.
Reference alert rule setup (query + condition):
Grafana Cloud Free
- Free tier: Limited to 3 users
- Paid plans: $55 / user / month above included usage
- Access to all Enterprise Plugins
- Fully managed service (not available to self-manage)
Self-hosted Grafana Enterprise
- Access to all Enterprise plugins
- All Grafana Enterprise features
- Self-manage on your own infrastructure
Install on Grafana Cloud
Plugins can be installed directly from within your Grafana instance or automated using the Cloud API or Terraform.
Learn more about plugin installationMarketplace plugins
This is a paid plugin developed by a marketplace partner. To purchase an entitlement, sign in first, then fill out the contact form.
Get this plugin
This is a paid for plugin developed by a marketplace partner. To purchase entitlement please fill out the contact us form.
What to expect:
- Grafana Labs will reach out to discuss your needs
- Payment will be taken by Grafana Labs
- Once purchased the plugin will be available for you to install (cloud) or a signed version will be provided (on-premise)
Thank you! We will be in touch.
For more information, visit the docs on plugin installation.
Installing on a local Grafana:
For local instances, plugins are installed and updated via a simple CLI command. Plugins are not updated automatically, however you will be notified when updates are available right within your Grafana.
1. Install the Data Source
Use the grafana-cli tool to install CompareQueries from the commandline:
grafana-cli plugins install The plugin will be installed into your grafana plugins directory; the default is /var/lib/grafana/plugins. More information on the cli tool.
Alternatively, you can manually download the .zip file for your architecture below and unpack it into your grafana plugins directory.
Alternatively, you can manually download the .zip file and unpack it into your grafana plugins directory.
2. Configure the Data Source
Accessed from the Grafana main menu, newly installed data sources can be added immediately within the Data Sources section.
Next, click the Add data source button in the upper right. The data source will be available for selection in the Type select box.
To see a list of installed data sources, click the Plugins item in the main menu. Both core data sources and installed data sources will appear.
Changelog
v2.1.1 (2026-05-25)
- fix: improve Grafana 9 compatibility for UI theme tokens with safe fallback handling(mySql datasource).
- fix: improve SQL/MySQL expression compatibility guidance for wide-series inputs.
- chore: update compatibility wording and release metadata for submission.
v2.1.0 (2026-05-13)
Uninstalled after update of Home Assistant #21
Issue with compareQueries in Grafana: Missing Queries in Panel #20
多个es query添加compare时,如果时间偏移量一致只显示最后一个compare的数据 #18
Unable to add new field from calulation/binary transform a series from CompareQueries #12
Dashboards: Comparing with Multiple Fields Results in Identical Field Names in Comparison Output #11
feat: optimize backend httpClient and frontend style sttings #28 (leoswing)
Refactor: add Grafana 13 mixed mode support, and Grafana alert is now available in the plugin #23 (leoswing)
2.0.3 (2024-11-20)
can not have two curves with the same time shift #10
2.0.2 (2024-07-10)
2.0.1 (2024-07-04)
2.0.0 (2024-07-03)
Signature: Version 2.0.0 claims to be signed, but it is unsigned #7
InfluxDB data source does not show data #2
feat: upgrade QueryEditor with grafana ui and fix Query ref unchange … #8 (leoswing)
feat: remove hiddenQueries property and upgrade links and screenshots… #6 (leoswing)
refactor(plugin): refactor plugin name and config to leoswing-compare… #5 (leoswing)
1.2.0 (2024-06-24)
- chore: add sha1 release workflow setting support #4 (leoswing)
- fix: fix QueryEditor data model binding issue with the form #3 (leoswing)
1.1.0 (2024-06-20)
1.0.0 (2024-06-18)
* This Changelog was automatically generated by github_changelog_generator