Plugins 〉simple grpc datasource


simple grpc datasource


Grafana Simple gRPC Datasource Plugin

What is this plugin?
This back-end Grafana datasource plugin provides a user-friendly grafana experience with only a handful simple and generic parameters to configure. It comes with a dedicated API specification that requires implementation in the data provider's back-end. Implementing this API helps to decouple the front-end visualisation solution from the back-end data-layer implementation, leaving developers with the necessary freedom to update and improve the back-end without breaking the end-user experience.
The protobuf API specification can be found in the pkg/proto directory. On configuring the datasource plugin, the end-user provides an endpoint URL and optionally an API key too. The datasource will attempt to establish a gRPC connection and emit calls to the given endpoint according to the API specification.
For more information on gRPC or protobuf, see the gRPC docs.
Why gRPC?
gRPC is a fast & efficient framework for inter-service communication and provides a fool-proof and streamlined workflow for API implementation through protobuf.
gRPC also supports all essential streaming capabilities, which can be implemented in future releases.
Security
The datasource plugin establishes a secure gRPC connection through TLS. Additionally, the datasource supports API-key authorization. The API-key will be included in each API call as part of the call metadata.
Usage
Metric
The variable that is updated with new values as the stream of timeseries datapoints is appended.
Dimension
A dimension is an optional, identifying property of the measure. Each dimension is modeled as a key-value pair. A measure can have zero or many dimensions that collectively uniquely identify it.
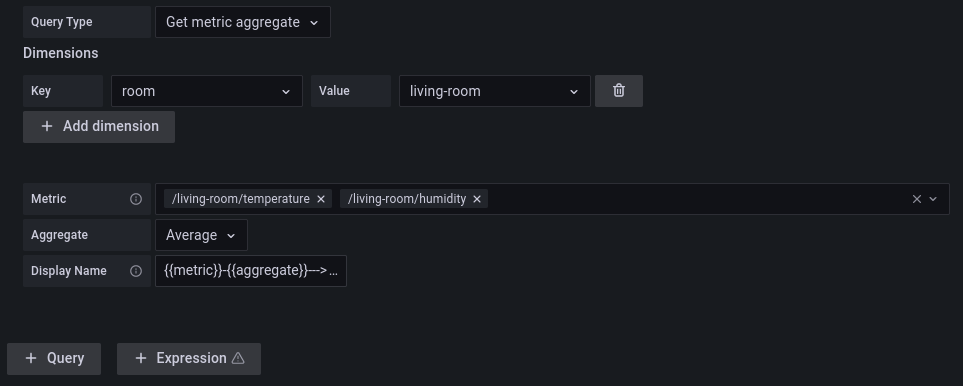
Query Type
| type | description |
|---|---|
| Get Metric History | gets historical timeseries values |
| Get Metric Aggregate | gets aggregated timeseries |
| Get Metric Value | gets the last known value |
Getting started
- start a sample grpc server locally:
docker run -p 50051:50051 innius/sample-grpc-server
install the innius-simple-grpc-datasource
enable the datasource
- configure the endpoint
localhost:50051
- configure the endpoint
configure dashboards
Implement your own backend API
This datasource plugin expects a backend to implement the Simple or the Advanced interface.
The Simple API (GrafanaQueryAPI)
This API provides the following operations:
| name | description |
|---|---|
| ListDimensionKeys | Returns a list of all available dimension keys |
| ListDimensionValues | Returns a list of all available dimension values of a dimension key |
| ListMetrics | Returns a list of all metrics for a combination of dimensions. |
| GetMetricValue | Returns the last known value of a metric. |
| GetMetricHistory | Returns historical values of a metric |
| GetMetricAggregate | Returns aggregated metric values |
A sample implementation can be found here.
This API has some limitations:
- it only supports one metric per query
- it does not support variables with multiple options
- it does not support enhanced metadata for metrics (like unit, etc.)
- it does not support flexible query options
The Advanced API (GrafanaQueryAPIV3)
This API provides almost the same operations as the Simple API but with one major difference: it supports multiple metrics for the same query. As a result this API integrates seamlessly with grafana templating capabilities. In addition, it supports enhanced metric metadata, like unit of measure. Another difference is that it supports grafana labels.
The advanced API supports dynamic query options which are defined by the backend system. This makes it possible to tailor the behavior of grafana queries for specific backends. An example of a custom option is the Aggregate of the GetMetricAggregate query. The v1 version of the API has a fixed number of Aggregates, defined by the plugin. It is not possible for a backend system to add a different option. With the V3 API, however, this is supported. Currently an option can be either an Enumeration or a Boolean type.
This API provides the following operations:
| name | description |
|---|---|
| ListDimensionKeys | Returns a list of all available dimension keys |
| ListDimensionValues | Returns a list of all available dimension values of a dimension key |
| ListMetrics | Returns a list of all metrics for a combination of dimensions. |
| GetMetricValue | Returns the last known value for one or more metrics. |
| GetMetricHistory | Returns historical values for one or more metrics |
| GetMetricAggregate | Returns aggregated values for one or more metrics |
| GetQueryOptions | Returns the options for a selected query type |
A sample implementation can be found here.
Example Use Cases:
- different time series for the same metric with different labels. For example: the temperature measure is a room. The room has four zones: north, south, east and west. The V1 API does not support this unless there are four different metrics defined for each temperature / zone combination.
The Advanced API does support this scenario by returning multiple time series for the same metric
temperature, each annotated with different labelzone. - different time series for different metrics. For example: a room has multiple temperature sensors. The V1 API supports this by defining multiple queries for each metric. The Advanced API can do this with a single query.
Important Note: in order to use the Advanced API the backend server needs to support gRPC Reflection. The plugin uses this to determine if a backend supports the V2 or V3 protocol. If not supported it falls back on the Simple API implementation.
Please note gRPC is programming language agnostic which makes it possible to implement a backend in the language of your choice. Checkout the gRPC documentation of your language.
Changes between (GrafanaQueryAPIV2) and (GravanaQueryAPIV3)
The most important difference is that the Aggregate types of the V2 API are not available by the V3 API unless they are defined in the backend.
The backend code has to implement something like this:
const (
    // this id is important because it matches the current v2 aggregate type option
	AggregationTypeOptionID = iota
    // these enum values are important because they match the values of the V2 options
	AggregationTypeAverage = 0
	AggregationTypeMax     = 1
	AggregationTypeMin     = 2
	AggregationTypeCount   = 3
)
func (backend *BackendServerV3) GetQueryOptions(ctx context.Context, in *v3.GetOptionsRequest) (*v3.GetOptionsResponse, error) {
var Options []*v3.Option
switch in.GetQueryType() {
case v3.GetOptionsRequest_GetMetricAggregate:
Options = append(Options, []*v3.Option{
{
Id:          strconv.Itoa(AggregationTypeOptionID),
Label:       “Aggregate”,
Description: “Aggregate the query results”,
Type:        v3.Option_Enum,
EnumValues: []*v3.EnumValue{
{Label: “Average”, Description: “Calculate the average of the values”, Id: strconv.Itoa(AggregationTypeAverage)},
{Label: “Min”, Description: “Calculate the minimum of the values”, Id: strconv.Itoa(AggregationTypeMin)},
{Label: “Max”, Description: “Calculate the maximum of the values”, Id: strconv.Itoa(AggregationTypeMax)},
{Label: “Count”, Description: “Calculate the sum of the values”, Id: strconv.Itoa(AggregationTypeCount)},
},
},
}…)
case v3.GetOptionsRequest_GetMetricValue:
return &v3.GetOptionsResponse{}, nil
case v3.GetOptionsRequest_GetMetricHistory:
return &v3.GetOptionsResponse{}, nil
}
return &v3.GetOptionsResponse{Options: Options}, nil
}
A sample implementation of the V3 backend can be found here
Features
- select multiple metrics in one query
- flexible dimension selection
- integrated with Grafana variables and templating
- allow backend systems to provided additional metadata, like value mappings, unit of measure, etc.
- supports notifications
- supports pagination
- supports retries for grpc calls if backend server is at maximum capacity
- allow backend systems to define custom query options.
Roadmap
- support annotations
- support streaming queries
Grafana Cloud Free
- Free tier: Limited to 3 users
- Paid plans: $55 / user / month above included usage
- Access to all Enterprise Plugins
- Fully managed service (not available to self-manage)
Self-hosted Grafana Enterprise
- Access to all Enterprise plugins
- All Grafana Enterprise features
- Self-manage on your own infrastructure
Install on Grafana Cloud
Plugins can be installed directly from within your Grafana instance or automated using the Cloud API or Terraform.
Learn more about plugin installationMarketplace plugins
This is a paid plugin developed by a marketplace partner. To purchase an entitlement, sign in first, then fill out the contact form.
Get this plugin
This is a paid for plugin developed by a marketplace partner. To purchase entitlement please fill out the contact us form.
What to expect:
- Grafana Labs will reach out to discuss your needs
- Payment will be taken by Grafana Labs
- Once purchased the plugin will be available for you to install (cloud) or a signed version will be provided (on-premise)
Thank you! We will be in touch.
For more information, visit the docs on plugin installation.
Installing on a local Grafana:
For local instances, plugins are installed and updated via a simple CLI command. Plugins are not updated automatically, however you will be notified when updates are available right within your Grafana.
1. Install the Data Source
Use the grafana-cli tool to install simple grpc datasource from the commandline:
grafana-cli plugins install The plugin will be installed into your grafana plugins directory; the default is /var/lib/grafana/plugins. More information on the cli tool.
Alternatively, you can manually download the .zip file for your architecture below and unpack it into your grafana plugins directory.
Alternatively, you can manually download the .zip file and unpack it into your grafana plugins directory.
2. Configure the Data Source
Accessed from the Grafana main menu, newly installed data sources can be added immediately within the Data Sources section.
Next, click the Add data source button in the upper right. The data source will be available for selection in the Type select box.
To see a list of installed data sources, click the Plugins item in the main menu. Both core data sources and installed data sources will appear.
Changelog
1.2.12
- fix: sort frames by the Name field
1.2.10
- chore: update dependencies
1.2.7
- refactor: move pagination logic to plugin backend
- chore: update dependencies
- chore: update grafana version in
docker-compose.yml - chore: add
sample-grpc-servertodocker-compose.yml
1.2.6
- fix: ensure the single stat query accommodates string values.
1.2.5
- feature: allow backend system to return string values
1.2.3
- refactor: improved backend error messages feat: enhance width of metric selection control in query editor
- chore: update to latest grafana framework fix: reset query options after changing query type
1.2.2
bugfix: fix backend resource path
1.2.1
- feature: provide backend query options with default values
- feature: send currently selected query options to the backend while retrieving query options
- feature: include grafana time range in GetMetricQuery
- feature: layout improvements for query option editor
1.1.1.
- docs: explain differences between API versions
1.1.0
- feature: add new v3 API which allows backend to define query options
1.0.14
upgrade grafana dependencies and grafana tools
1.0.12
- feature: support backend value mapping
1.0.11
- fix: specify correct grafana version dependency
1.0.10
- feature: retry mechanism for backend grpc calls
- feature: add dimension value filter to VariableQueryEditor
- feature: update to latest grafana frameworks
1.0.9
- feature: imporoved dimension selection component
- feature: add variable editor which supports dimension keys and metrics
1.0.8
- bugfix: incorrect metrics when Explore is triggered from dashboard panel
- bugfix: fix dimension drop down glitch for Chrome browser
1.0.7
- feature: provide ListDimensions with selected dimensions to enable advanced backend filtering
- feature: support frame metadata to enable user notifications from backend
- bugfix: pagination for queries with multiple frames did not work properly
1.0.6
- upgrade: upgrade to latest grafana toolkit
- feature: add v2 API which better aligns with grafana dataframe API
- feature: add fieldname to display name expressions
1.0.5
- feature: add
COUNTaggregate type to list of possible aggregations - feature: support display name expression (also known as aliasing)
- bugfix: exclude variables from metricFind query
1.0.4
- improved metric selection
- support Count aggregation type
- add grafana
intervalMSandMaxItemsattributes to query definition
1.0.3
Hide technical grpc errors from user interface; backend plugin logs error details and returns user-friendly message for the user.
1.0.2
- Add support for GetMetricAggregate query
- Fix a few typo's in Readme
- Correct plugin id to standard grafana plugin-id conventions
1.0.0 (Unreleased)
Initial release.