
Kafka Datasource for Grafana





Visualize real-time Kafka data in Grafana dashboards.
Why Kafka Datasource?
- Live streaming: Monitor Kafka topics in real time.
- Flexible queries: Select topics, partitions, offsets, and timestamp modes.
- Rich JSON support: Handles flat, nested, and array data.
- Avro support: Integrates with Schema Registry for Avro messages.
- Plaintext support: Reads raw Kafka payload bytes without schema decoding.
- Line Protocol support: Parses InfluxDB Line Protocol messages into a single long-format Grafana frame per message, with tags carried as columns.
- Secure: SASL authentication (PLAIN, SCRAM, OAUTHBEARER/OIDC, GSSAPI/Kerberos) & SSL/TLS encryption.
- Easy setup: Install and configure in minutes.
How It Works
This plugin connects your Grafana instance directly to Kafka brokers, allowing you to query, visualize, and explore streaming data with powerful time-series panels and dashboards.
Requirements
- Apache Kafka v0.11+
- Grafana v10.2+
Note: Without PDC, the Grafana server must access the Kafka broker and Schema Registry directly. With PDC enabled, Grafana must access the PDC proxy, and the PDC agent must access the Kafka broker and Schema Registry.
Features
- Real-time monitoring of Kafka topics
- Kafka authentication (SASL: PLAIN, SCRAM, OAUTHBEARER/OIDC client credentials, GSSAPI/Kerberos) & encryption (SSL/TLS)
- Query all or specific partitions
- Autocomplete for topic names
- Flexible offset options (latest, last N, earliest)
- Timestamp modes (Kafka event time, dashboard received time)
- Advanced JSON support (flat, nested, arrays, mixed types)
- Avro support with Schema Registry integration (inline schema or Schema Registry)
- Protobuf support with Schema Registry integration (inline schema or Schema Registry)
- Plaintext support for raw byte payloads (no schema required)
- Line Protocol support (InfluxDB format) with per-query timestamp-precision selection (auto / ns / µs / ms / s)
- Transactional topic support (committed messages only; control records are filtered)
- Message key support (None, String, JSON, Base64 formats)
- Configurable flattening depth (default: 5)
- Configurable max fields per message (default: 1000)
- Customizable query aliases with placeholders
Installation
Via grafana-cli
grafana-cli plugins install hamedkarbasi93-kafka-datasource
Via zip file
Download the latest release and unpack it into your Grafana plugins directory (default: /var/lib/grafana/plugins).
Provisioning
You can automatically configure the Kafka datasource using Grafana's provisioning feature. For a ready-to-use template and configuration options, refer to provisioning/datasources/datasource.yaml in this repository.
Usage
Configuration
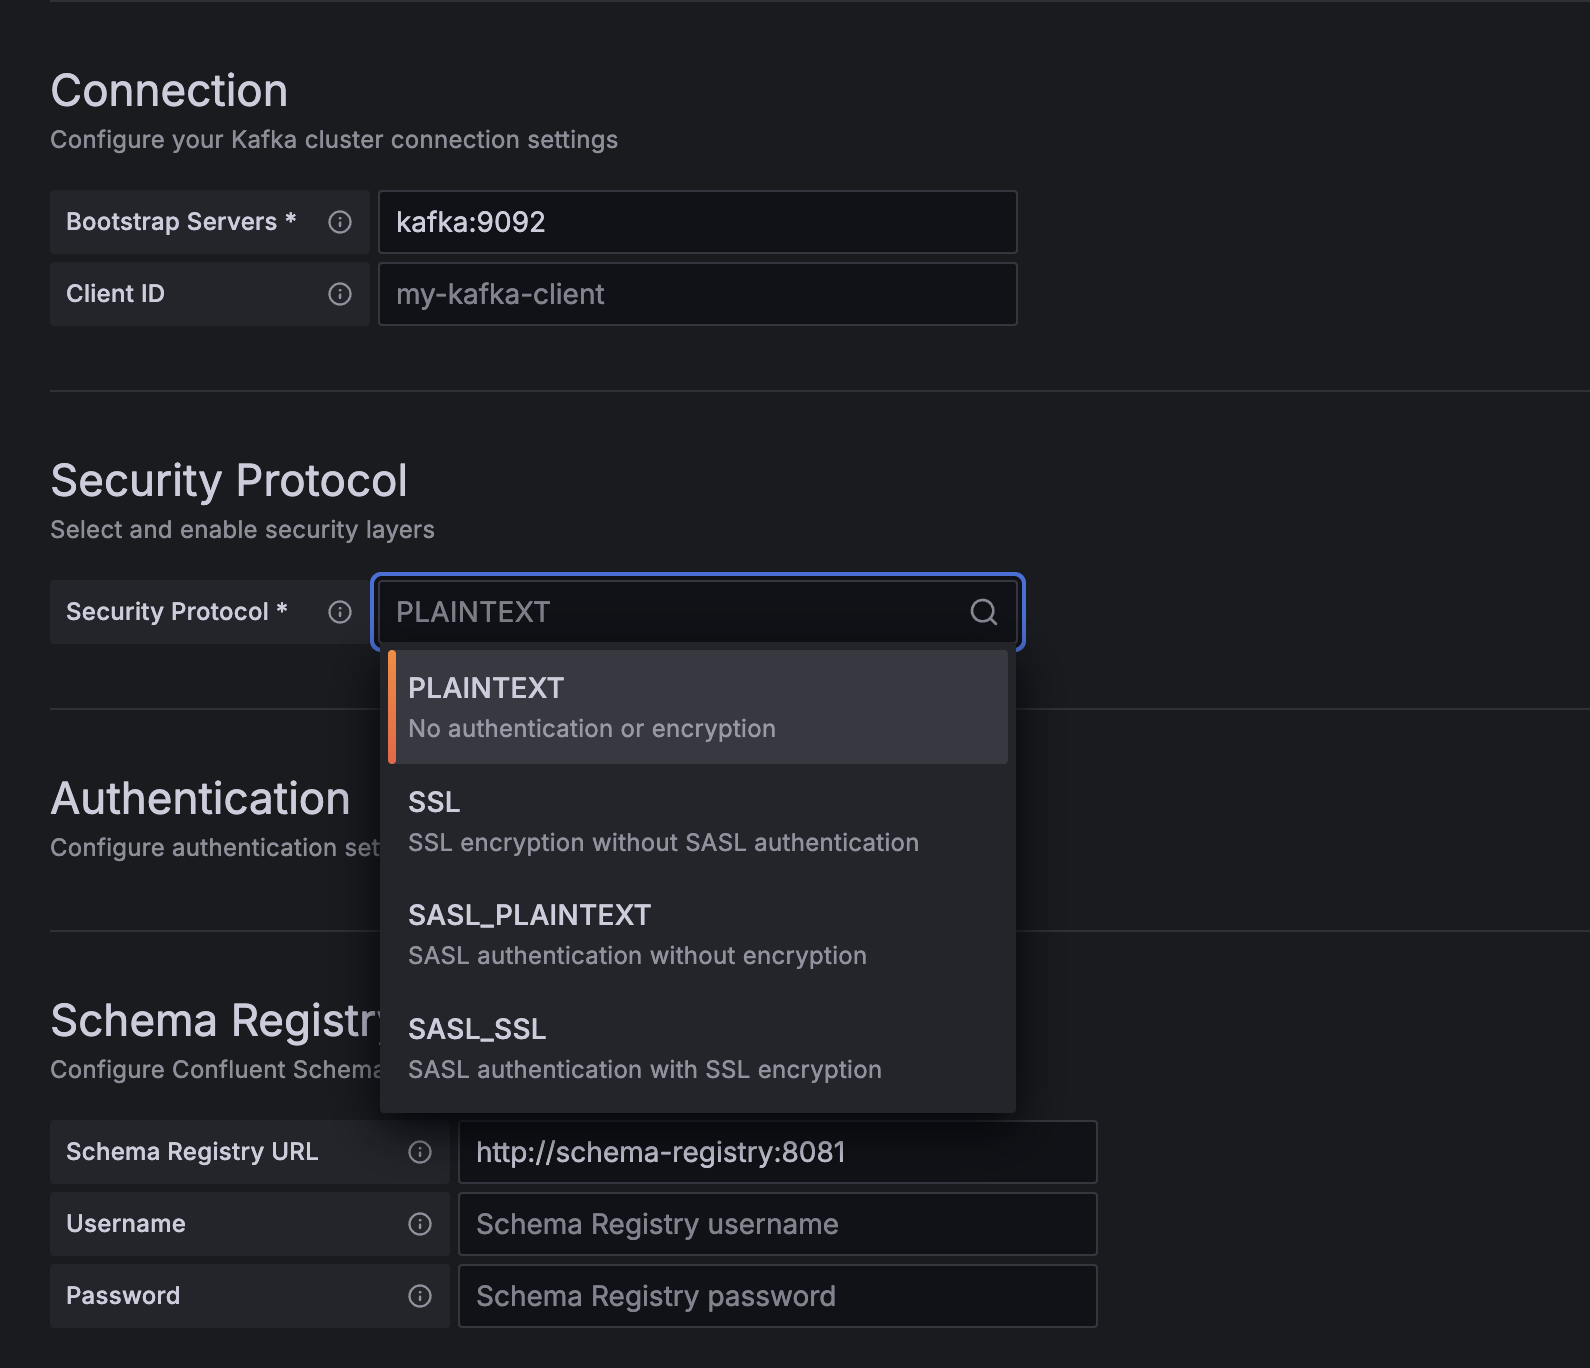
- Add a new data source in Grafana and select "Kafka Datasource".
- Configure connection settings:
- Broker address (e.g.
localhost:9094orkafka:9092) - Private Data Source Connect (PDC) (optional; requires PDC to be configured in Grafana)
- Authentication (SASL — PLAIN, SCRAM, OAUTHBEARER/OIDC client credentials, or GSSAPI/Kerberos — SSL/TLS, optional)
- Avro Schema Registry (if using Avro format)
- Timeout settings (default: two seconds)
- Broker address (e.g.
Build the Query
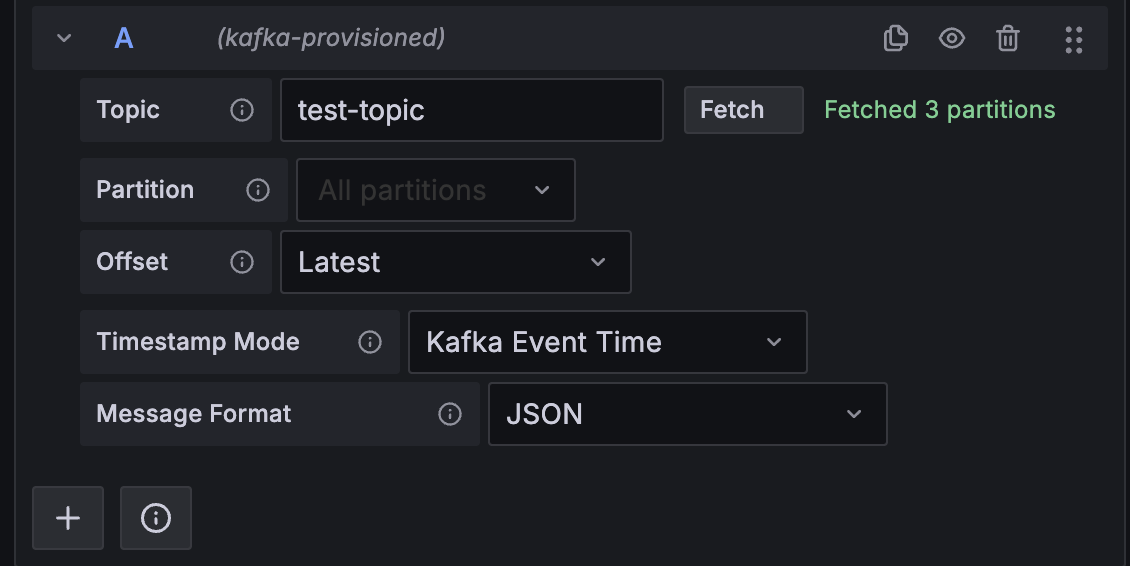
- Create a new dashboard panel in Grafana.
- Select your Kafka data source.
- Configure the query:
- Topic: Enter or select your Kafka topic (autocomplete available).
- Fetch Partitions: Click to retrieve available partitions.
- Partition: Choose a specific partition or "all" for all partitions.
- Message Format:
JSON: For JSON messagesAvro: For Avro messages (requires schema registry or inline schema)Protobuf: For Protobuf messages (requires schema registry or inline schema)Plaintext: For raw payload bytes (no schema required)Line Protocol: For InfluxDB Line Protocol messages. All lines in a Kafka message are combined into the rows of a single long-format frame; tags become columns; field types (float/int/uint/bool/string) are preserved per spec. A Timestamp Precision selector (Auto-detectby default) controls how inline timestamps are interpreted.
- Offset Reset:
latest: Only new messageslast N messages: Start from the most recent N messages (set N in the UI)earliest: Start from the oldest message
- Transactional Topics: The datasource reads committed messages and automatically skips Kafka transaction control records (COMMIT/ABORT markers).
- Timestamp Mode: Choose between Kafka event time or dashboard received time.
- Alias: Optional custom name for the query series. Supports template placeholders:
{{topic}}: The Kafka topic name{{field}}: The field name (for field display names){{partition}}: The partition number{{refid}}: The query RefID (e.g., A, B)
- Key Format: Choose how to process Kafka message keys:
None: Ignore keys (default, backward compatible)String: Single "key" column with UTF-8 decoded keyJSON: Flatten JSON keys with "key." prefix (e.g., key.userId, key.region)Base64: Single "key" column with raw binary key encoded as a base64 string
Tip: Numeric fields become time series, string fields are labels, arrays and nested objects are automatically flattened for visualization.
Supported JSON Structures
- Flat objects
- Nested objects (flattened)
- Top-level arrays
- Mixed types
Examples:
Simple flat object:
{
  "temperature": 23.5,
  "humidity": 65.2,
  "status": "active"
}
Nested object (flattened as user.name, user.age, settings.theme):
{
  "user": {
    "name": "John Doe",
    "age": 30
  },
  "settings": {
    "theme": "dark"
  }
}
Top-level array (flattened as item_0.id, item_0.value, item_1.id, etc.):
[
  { "id": 1, "value": 10.5 },
  { "id": 2, "value": 20.3 }
]
Avro Support
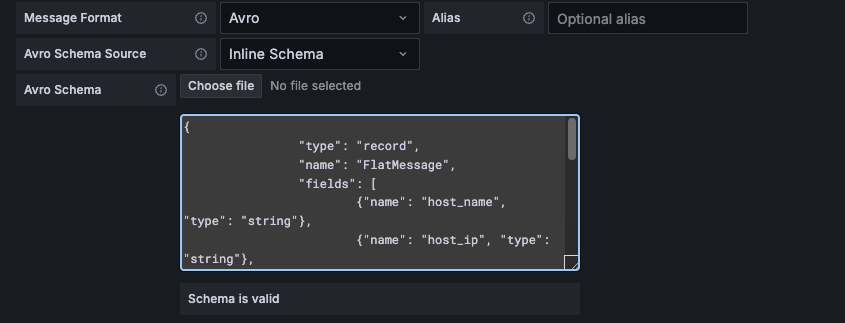
Avro messages are supported using either:
- Inline schema: paste your Avro schema (JSON format) in the UI
- Schema Registry: the plugin fetches the latest schema by subject from the configured Schema Registry
Example Avro schema:
{
  "type": "record",
  "name": "SensorReading",
  "fields": [
    { "name": "sensor_id", "type": "string" },
    { "name": "temperature", "type": "double" },
    { "name": "timestamp", "type": "long" }
  ]
}
Both flat and nested structures are supported. When using Schema Registry, messages are encoded in Confluent wire format with schema ID prefix for efficient deserialization.
Protobuf Support
Protobuf messages are supported using either:
- Inline schema: paste your
.protoschema definition in the UI - Schema Registry: the plugin extracts the schema ID from the Confluent wire format header and fetches the schema from the configured Schema Registry
Example Protobuf schema:
syntax = "proto3";

message SensorReading {
  string sensor_id = 1;
  double temperature = 2;
  int64 timestamp = 3;
}
Both flat and nested structures are supported. Confluent wire format uses a magic byte (0x00) followed by a 4-byte schema ID, then a variable-length message-indexes array (varint-encoded), and finally the Protobuf payload. The message-indexes identify which message type in the schema the payload encodes.
Known Protobuf Limitations
- Inline schemas do not support imports
- Well-known types like
google.protobuf.Timestampwon't compile when provided inline - Use inline schema for simple schemas, or provide the schema via Schema Registry if imports are needed
- Well-known types like
- Default message selection: the first top-level message in the
.protofile is used as the default - Schema caching: schemas are cached by ID/subject to avoid repeated registry requests
If you encounter issues with complex Protobuf schemas, open an issue so we can prioritize improvements.
Live Demo
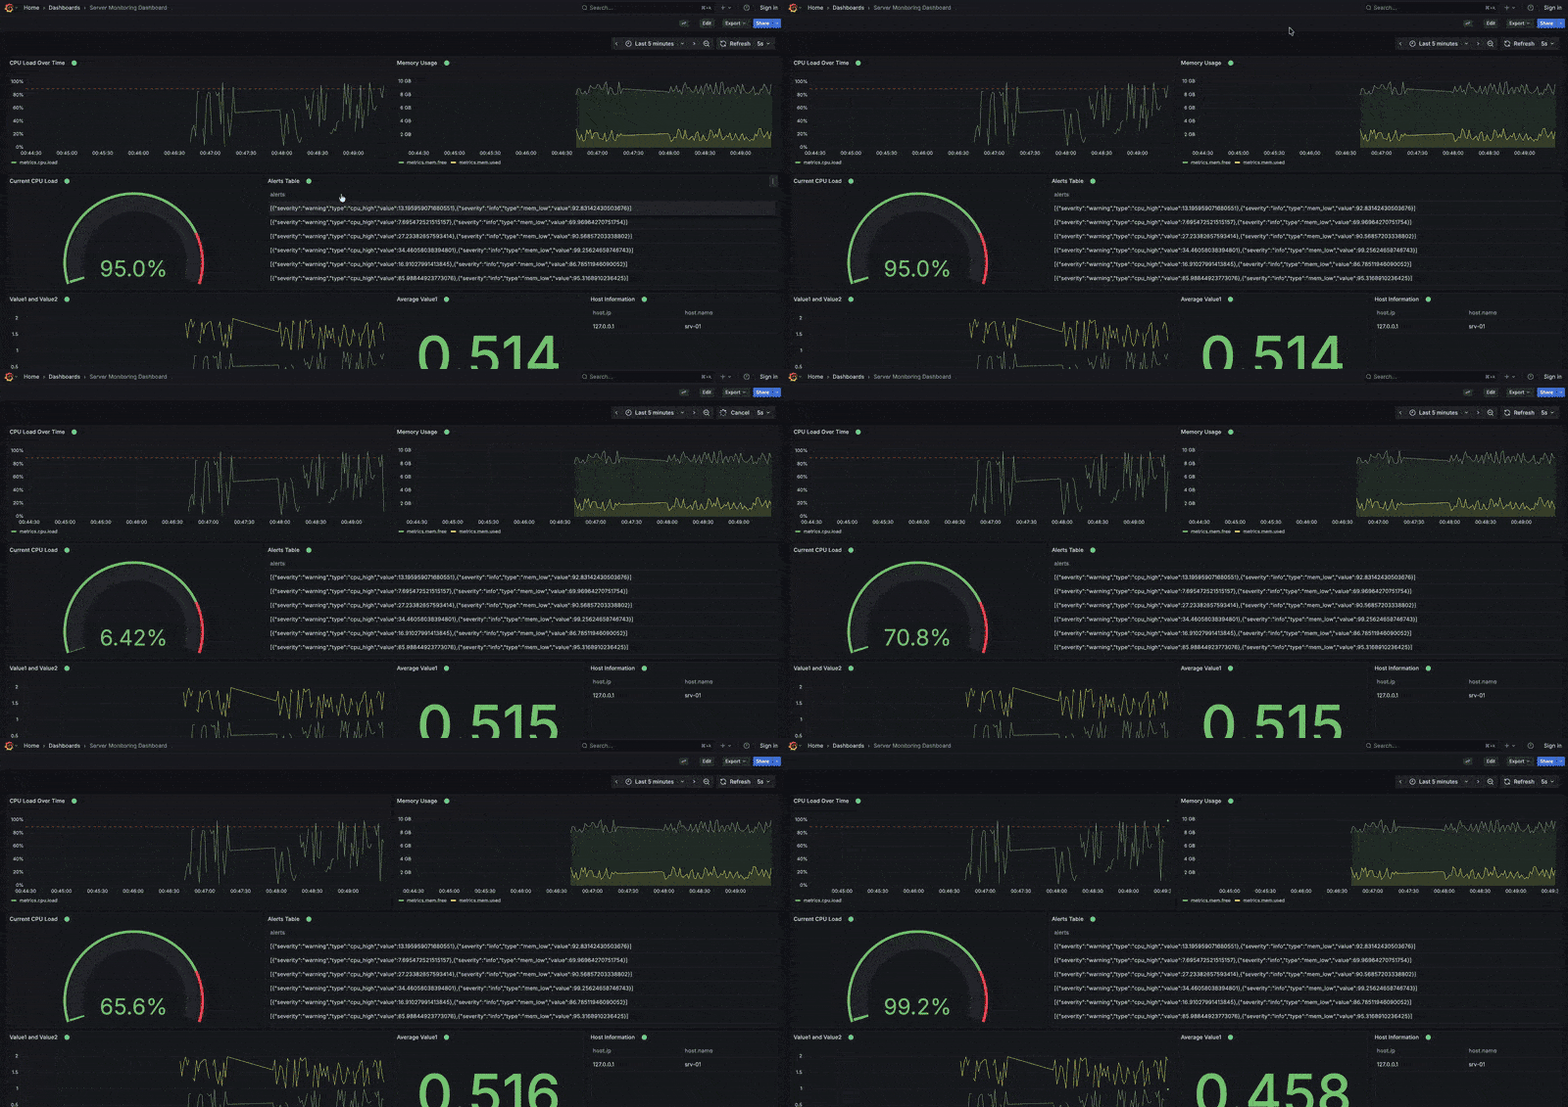
More screenshots and recordings (click to open):
Sample Data Generator
Want to test the plugin with realistic Kafka messages? Use the included sample producers to generate JSON, Avro, or Protobuf messages with various structures and schema configurations. For detailed usage, see the example README. To test Plaintext mode, produce any bytes (for example JSON bytes) and select Plaintext in the query editor to view raw payload text.
Performance Benchmarks
Production builds always use the optimized path. The old pre-fix behavior is still available for measurement through dedicated benchmark variants instead of runtime environment variables.
Useful benchmark pairs:
BenchmarkDecodeAvroMessagevsBenchmarkDecodeAvroMessage_NoCacheBenchmarkDecodeProtobufMessage_PlainvsBenchmarkDecodeProtobufMessage_Plain_NoCacheBenchmarkProcessMessage_JSON_Wide100vsBenchmarkProcessMessage_JSON_Wide100_FieldOrderCacheDisabledBenchmarkWorkflowvsBenchmarkWorkflow_NoOptimizations
Example commands:
# Run all focused performance benchmarks
go test -run '^$' -bench 'BenchmarkDecodeAvroMessage|BenchmarkDecodeProtobufMessage_Plain|BenchmarkProcessMessage_JSON_Wide100|BenchmarkWorkflow' -benchmem ./pkg/kafka_client/... ./pkg/plugin/...

# Compare cached Avro decode vs the explicit no-cache benchmark path
go test -run '^$' -bench '^BenchmarkDecodeAvroMessage$' -benchmem -count=6 ./pkg/kafka_client/... > after.txt
go test -run '^$' -bench '^BenchmarkDecodeAvroMessage_NoCache$' -benchmem -count=6 ./pkg/kafka_client/... > before.txt
sed 's/BenchmarkDecodeAvroMessage_NoCache/BenchmarkDecodeAvroMessage/' before.txt > before.norm.txt
benchstat before.norm.txt after.txt
The Avro and Protobuf schema caches remain bounded with a hardcoded default size of 256 entries. For benchmark methodology, before/after numbers, profiling commands, and architecture notes, see Performance Optimizations.
FAQ & Troubleshooting
- Can I use this with any Kafka broker? Yes, supports Apache Kafka v0.11+ and compatible brokers.
- Does it support secure connections? Yes, SASL (PLAIN, SCRAM-SHA-256/512, OAUTHBEARER/OIDC client credentials, GSSAPI/Kerberos) and SSL/TLS are supported. See OAuth 2.0 Authentication for OAUTHBEARER setup, and Kerberos Authentication for GSSAPI setup.
- What JSON formats are supported? Flat, nested, arrays, mixed types.
- What is Plaintext format? It bypasses schema decoding and renders raw payload bytes in a single
messagefield. - What is Line Protocol format? It parses InfluxDB Line Protocol messages —
measurement,tag=val field=val timestamp. Each Kafka message produces a single Grafana frame in long format, one row per LP field, with a fixed streaming-friendly schema:Time | _measurement | _field | value | value_str | <one column per tag key> | offset. This shape works correctly with Grafana Live streaming (consistent schema per channel), and you can pivot it into Influx-style per-series frames with Grafana's Transform → Partition by values on_measurement+_fieldfor dashboards that were built around the InfluxDB datasource. The Timestamp Precision dropdown decides how inline timestamps are interpreted;Auto-detectpicks ns/µs/ms/s from the magnitude. - How do I generate test data? Use the included Go or Python producers.
- Where do I find more help? See this README or open an issue.
Documentation & Links
- Sample Producers
- OAuth 2.0 Authentication
- Kerberos Authentication
- Performance Optimizations
- Changelog
- Contribution Guidelines
- Code of Conduct
- Articles Series
Support & Community
If you find this plugin useful, please consider giving it a ⭐ on GitHub or supporting development:

For more information, see the documentation files above or open an issue/PR.
Grafana Cloud
Connect any plugin in Grafana Cloud.
- 150+ data source integrations
- Grafana Assistant - AI that correlates your data, builds queries, and answers questions
- 10k Prometheus metrics + 50 GB logs, traces, and profiles on the free tier
- ...and more
Insights
- Adoption
Running on 2 active Grafana instances.
- Activity
Last updated 5 Oct 2026.
9 releases in the past year.
- Queries
1,253 total queries served across all Grafana Cloud instances.
- Version
- 1.9.1
- Dependencies
- Grafana >=10.2.9
- Developer
- hamedkarbasi93
Grafana Cloud
Connect any plugin in Grafana Cloud.
- 150+ data source integrations
- Grafana Assistant - AI that correlates your data, builds queries, and answers questions
- 10k Prometheus metrics + 50 GB logs, traces, and profiles on the free tier
- ...and more