Plugins 〉MetaQueries
The MetaQueries plugin has been deprecated and is no longer maintained.
MetaQueries
Meta Queries Plugin for Grafana:
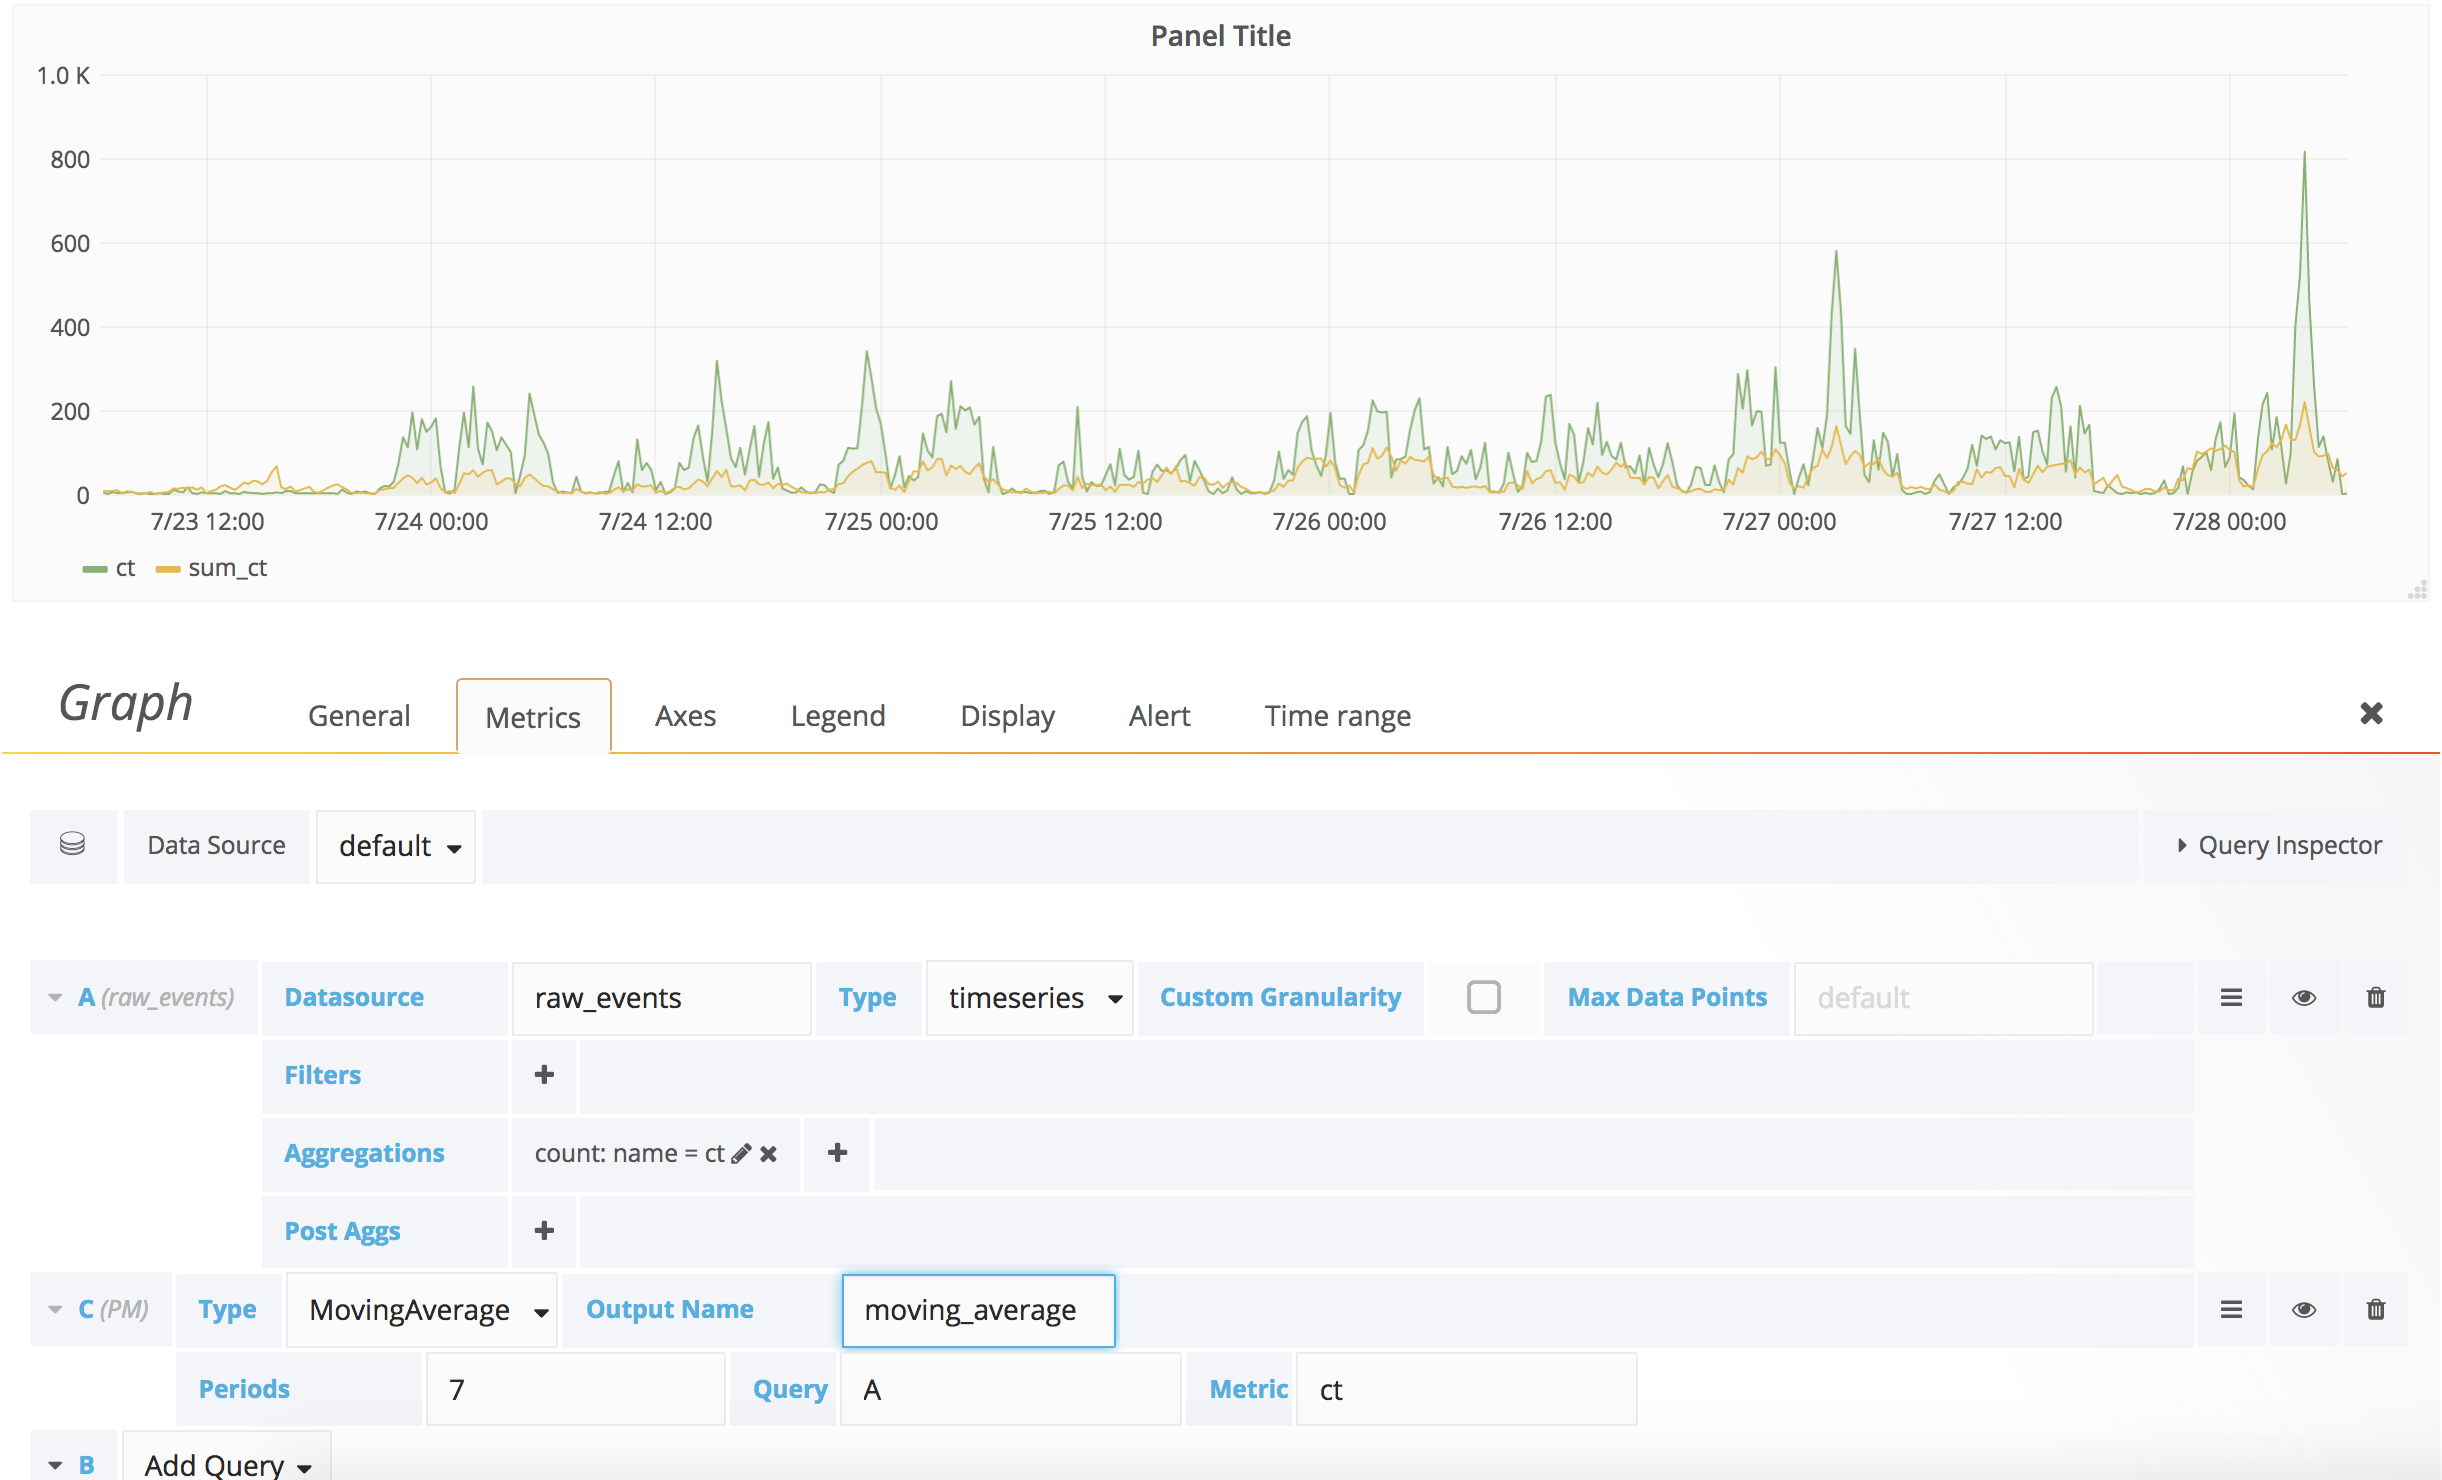
Meta Queries plugin is built as a data source plugin and can be used in conjunction with other data source to show computed metrics like Moving Average, Time Shift.
Installation
Need to clone this repo into your grafana plugins directory (default /var/lib/grafana/plugins if your installing grafana with package). Restart grafana-server and the plugin should be automatically detected and used.
git clone git@github.com:GoshPosh/grafana-meta-queries.git
sudo service grafana-server restart
Usage
Create a new datasource and select
MetaQueriesas the desired type.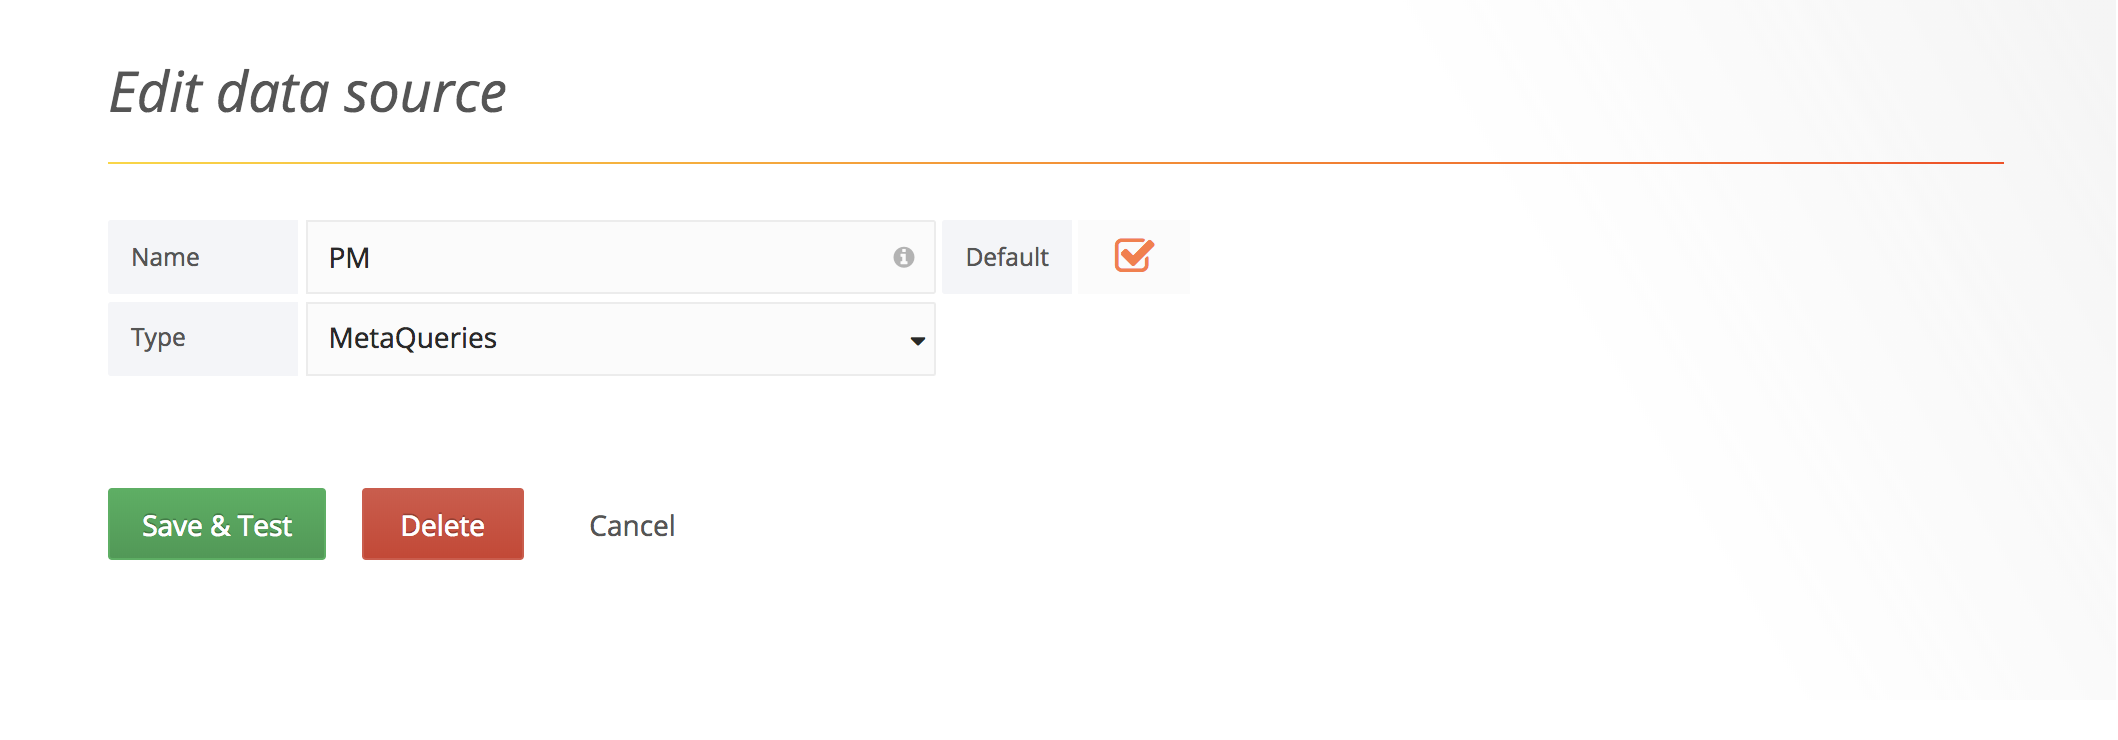
And new panel and set the
MetaQueriesas the data source.On the top right corner, Click on Add query. Select the desired data source and specify the query as desired (add a few more).
Add a
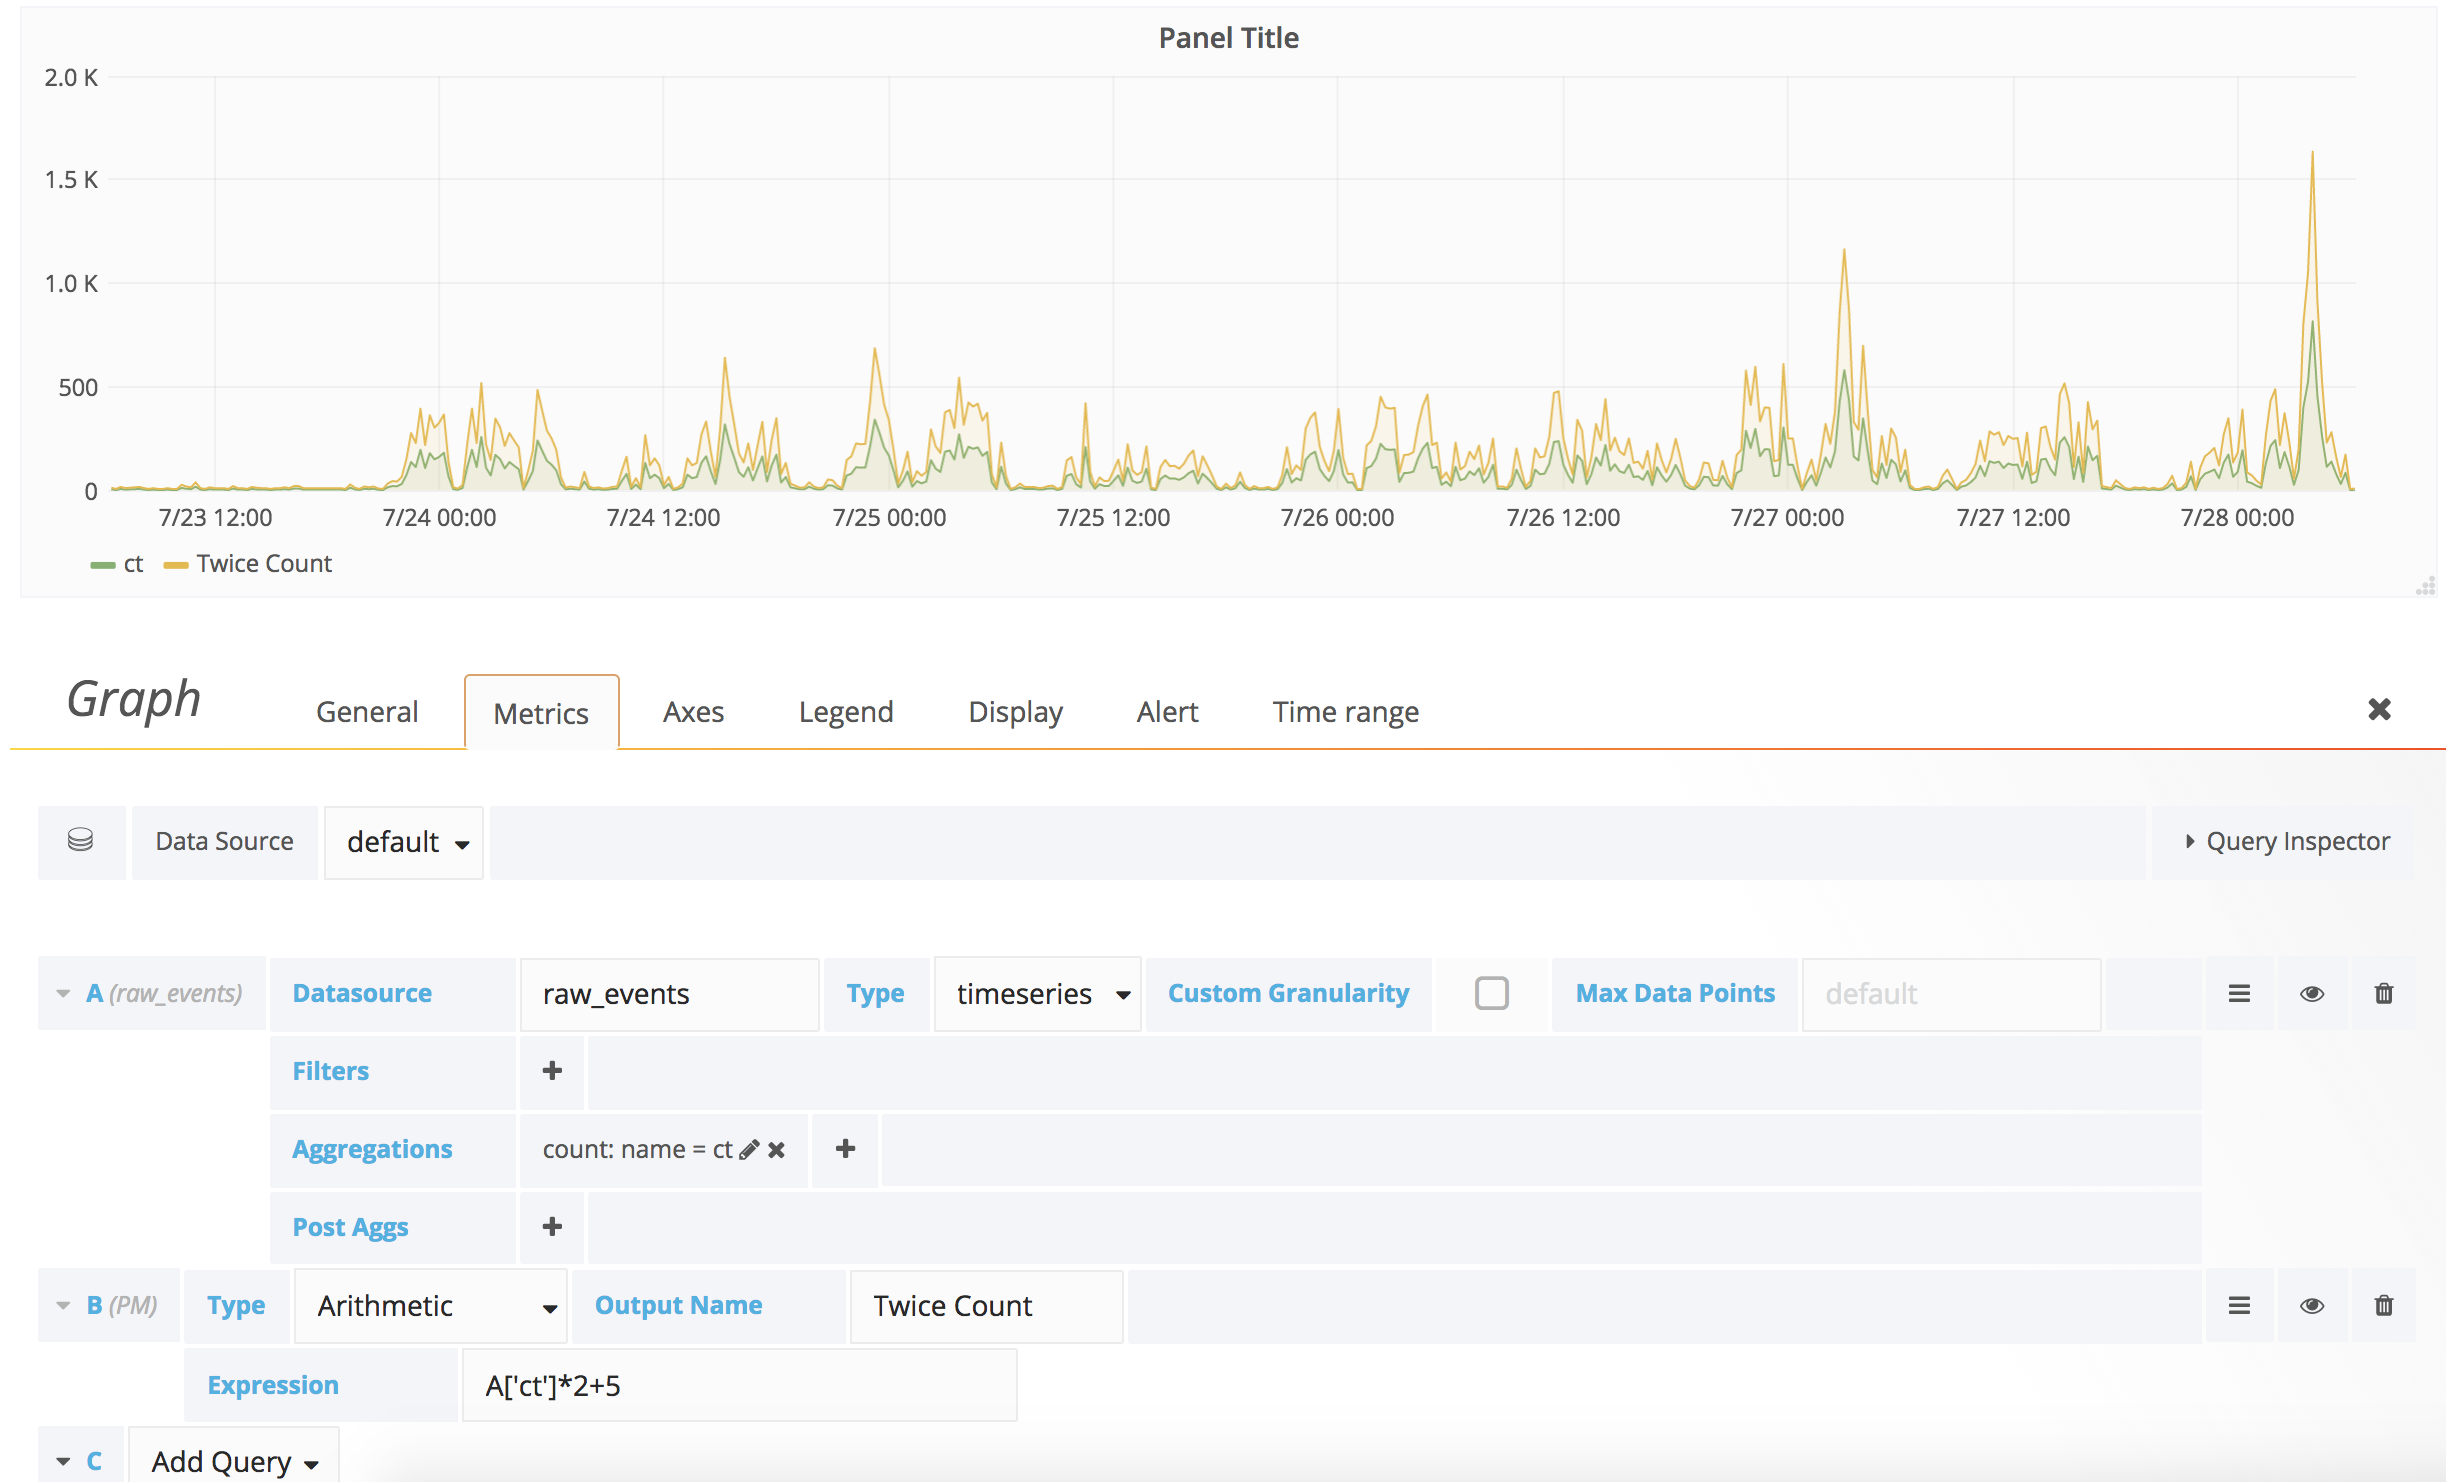
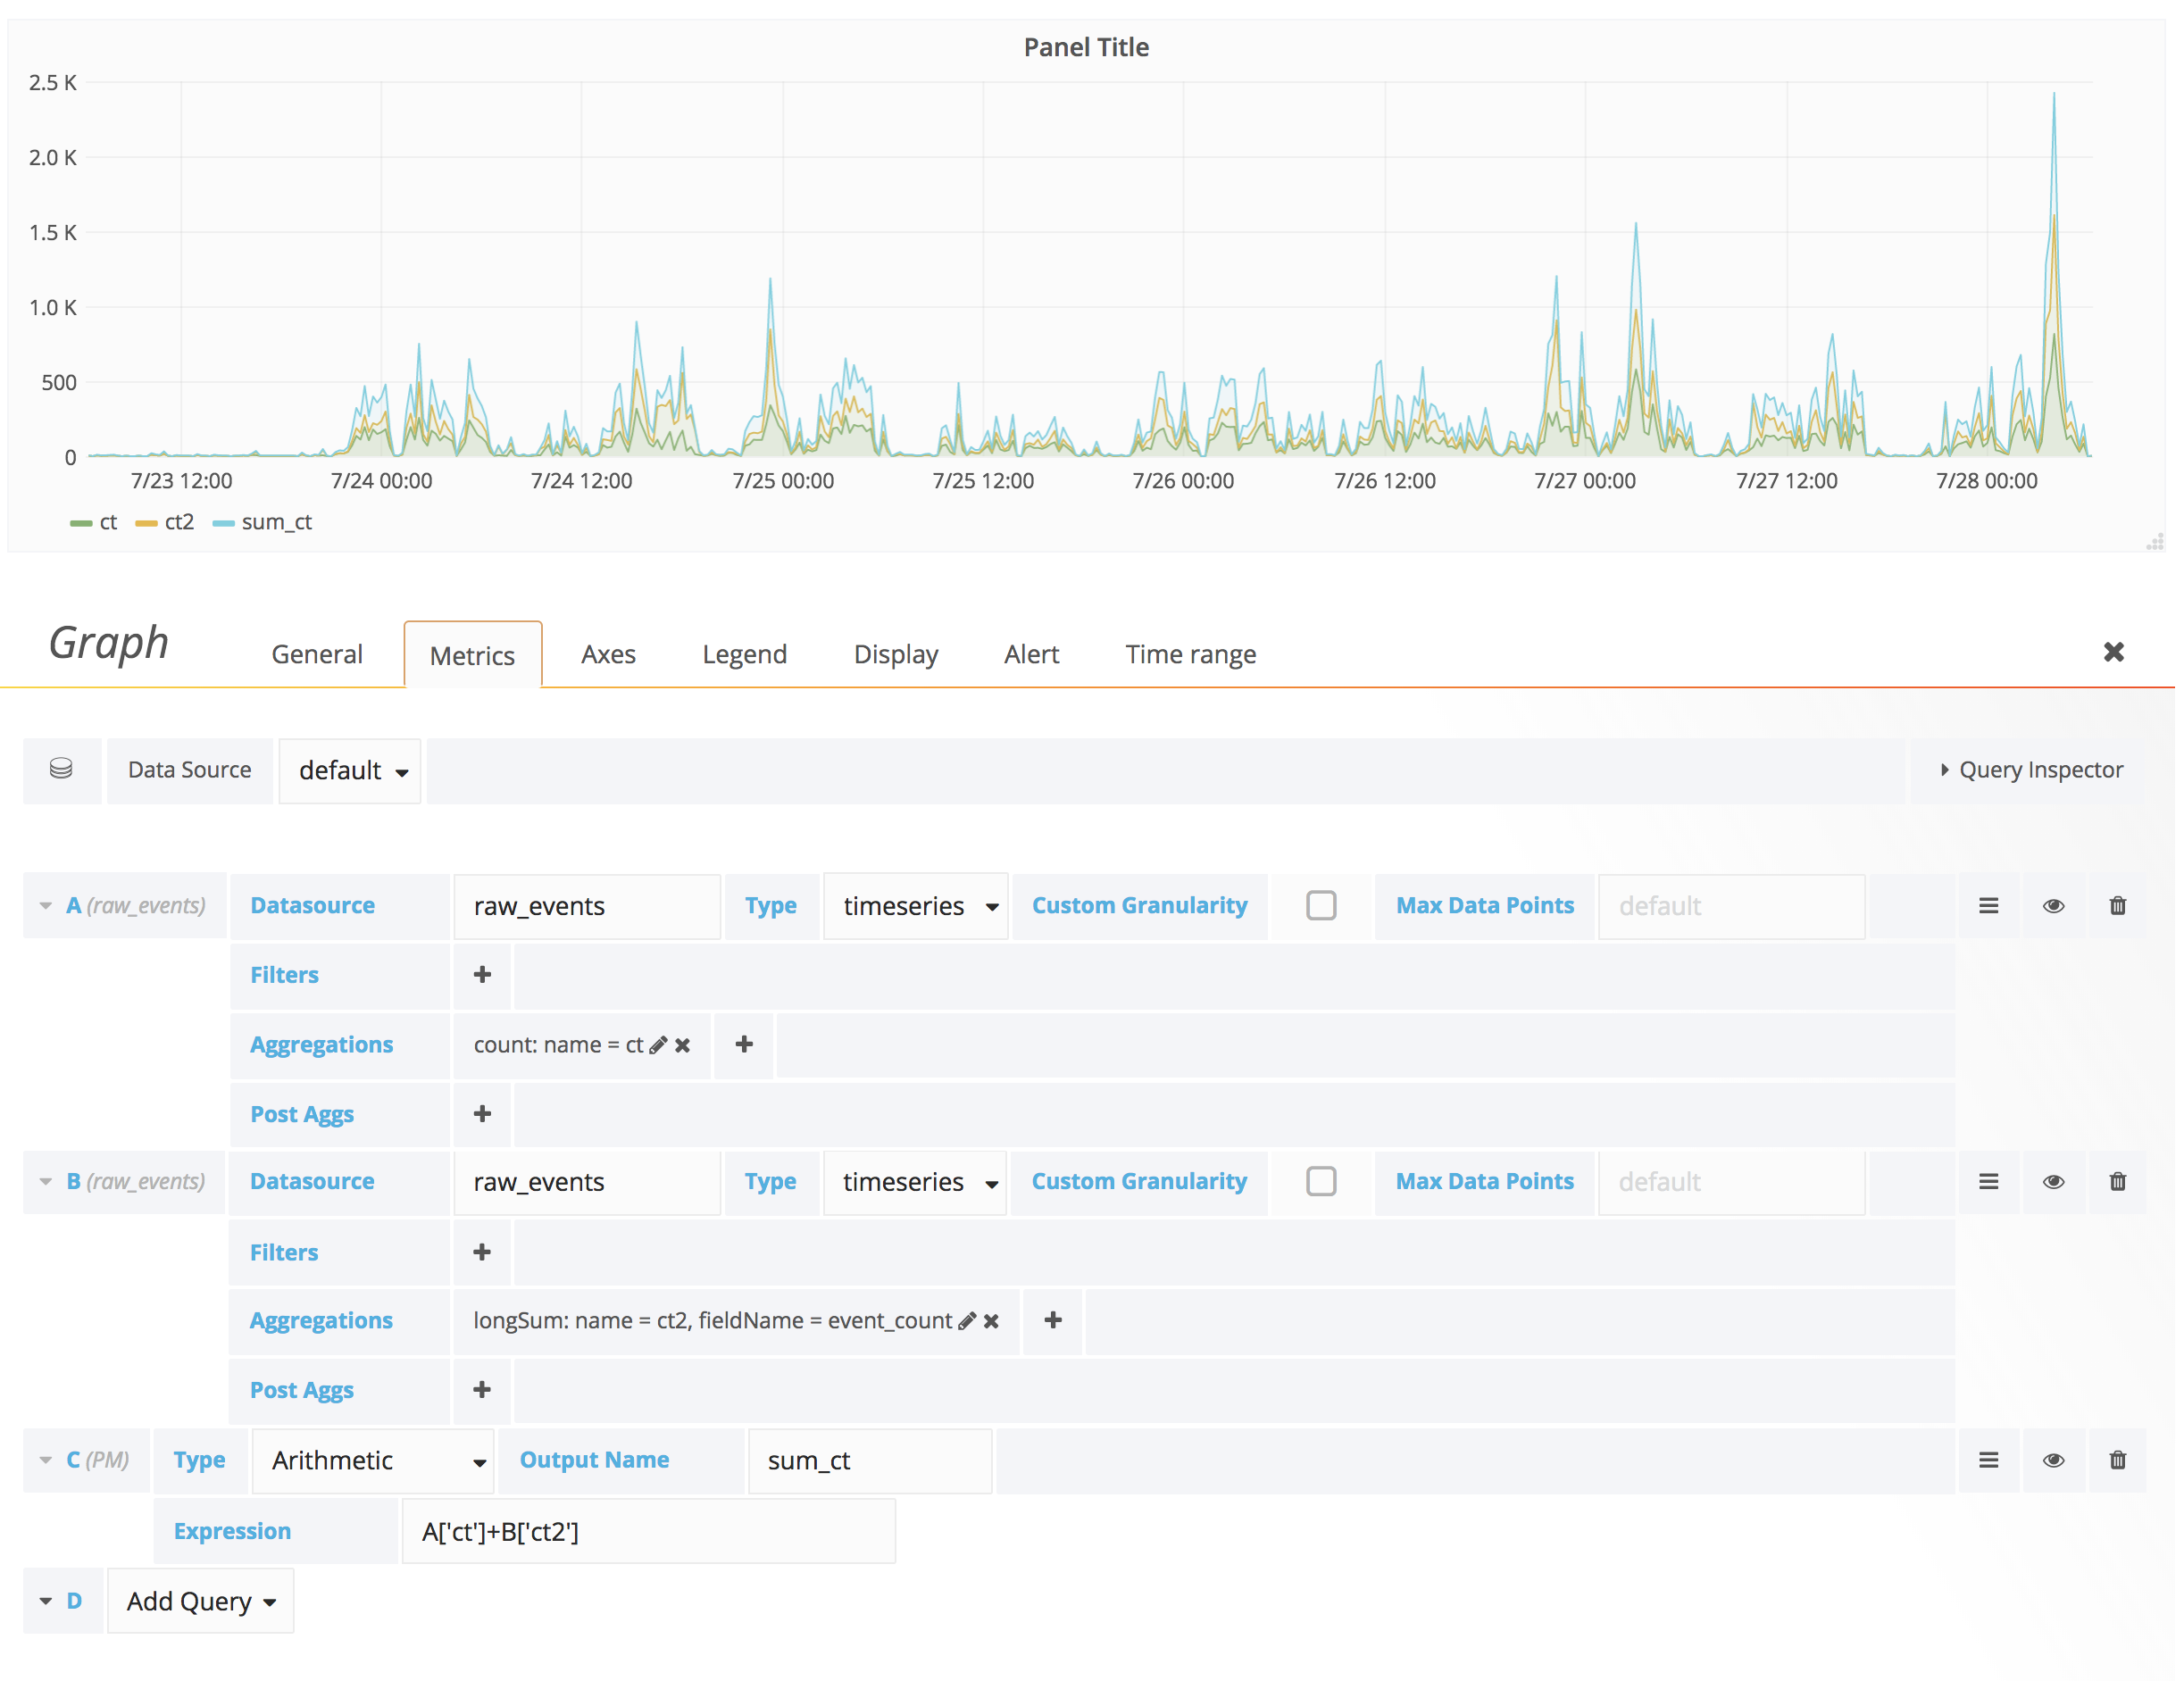
MetaQueriesquery, and preform the wanted manipulation (examples listed below) The Reference to the queries should be made both by query and it's metrics names. For example, from queryAwe'd like to work against metric callsTest, the refferer should be A['test'].
Examples
Arithmetic
Lets you perform arithmetic operations on one or more existing queries.
Moving Average
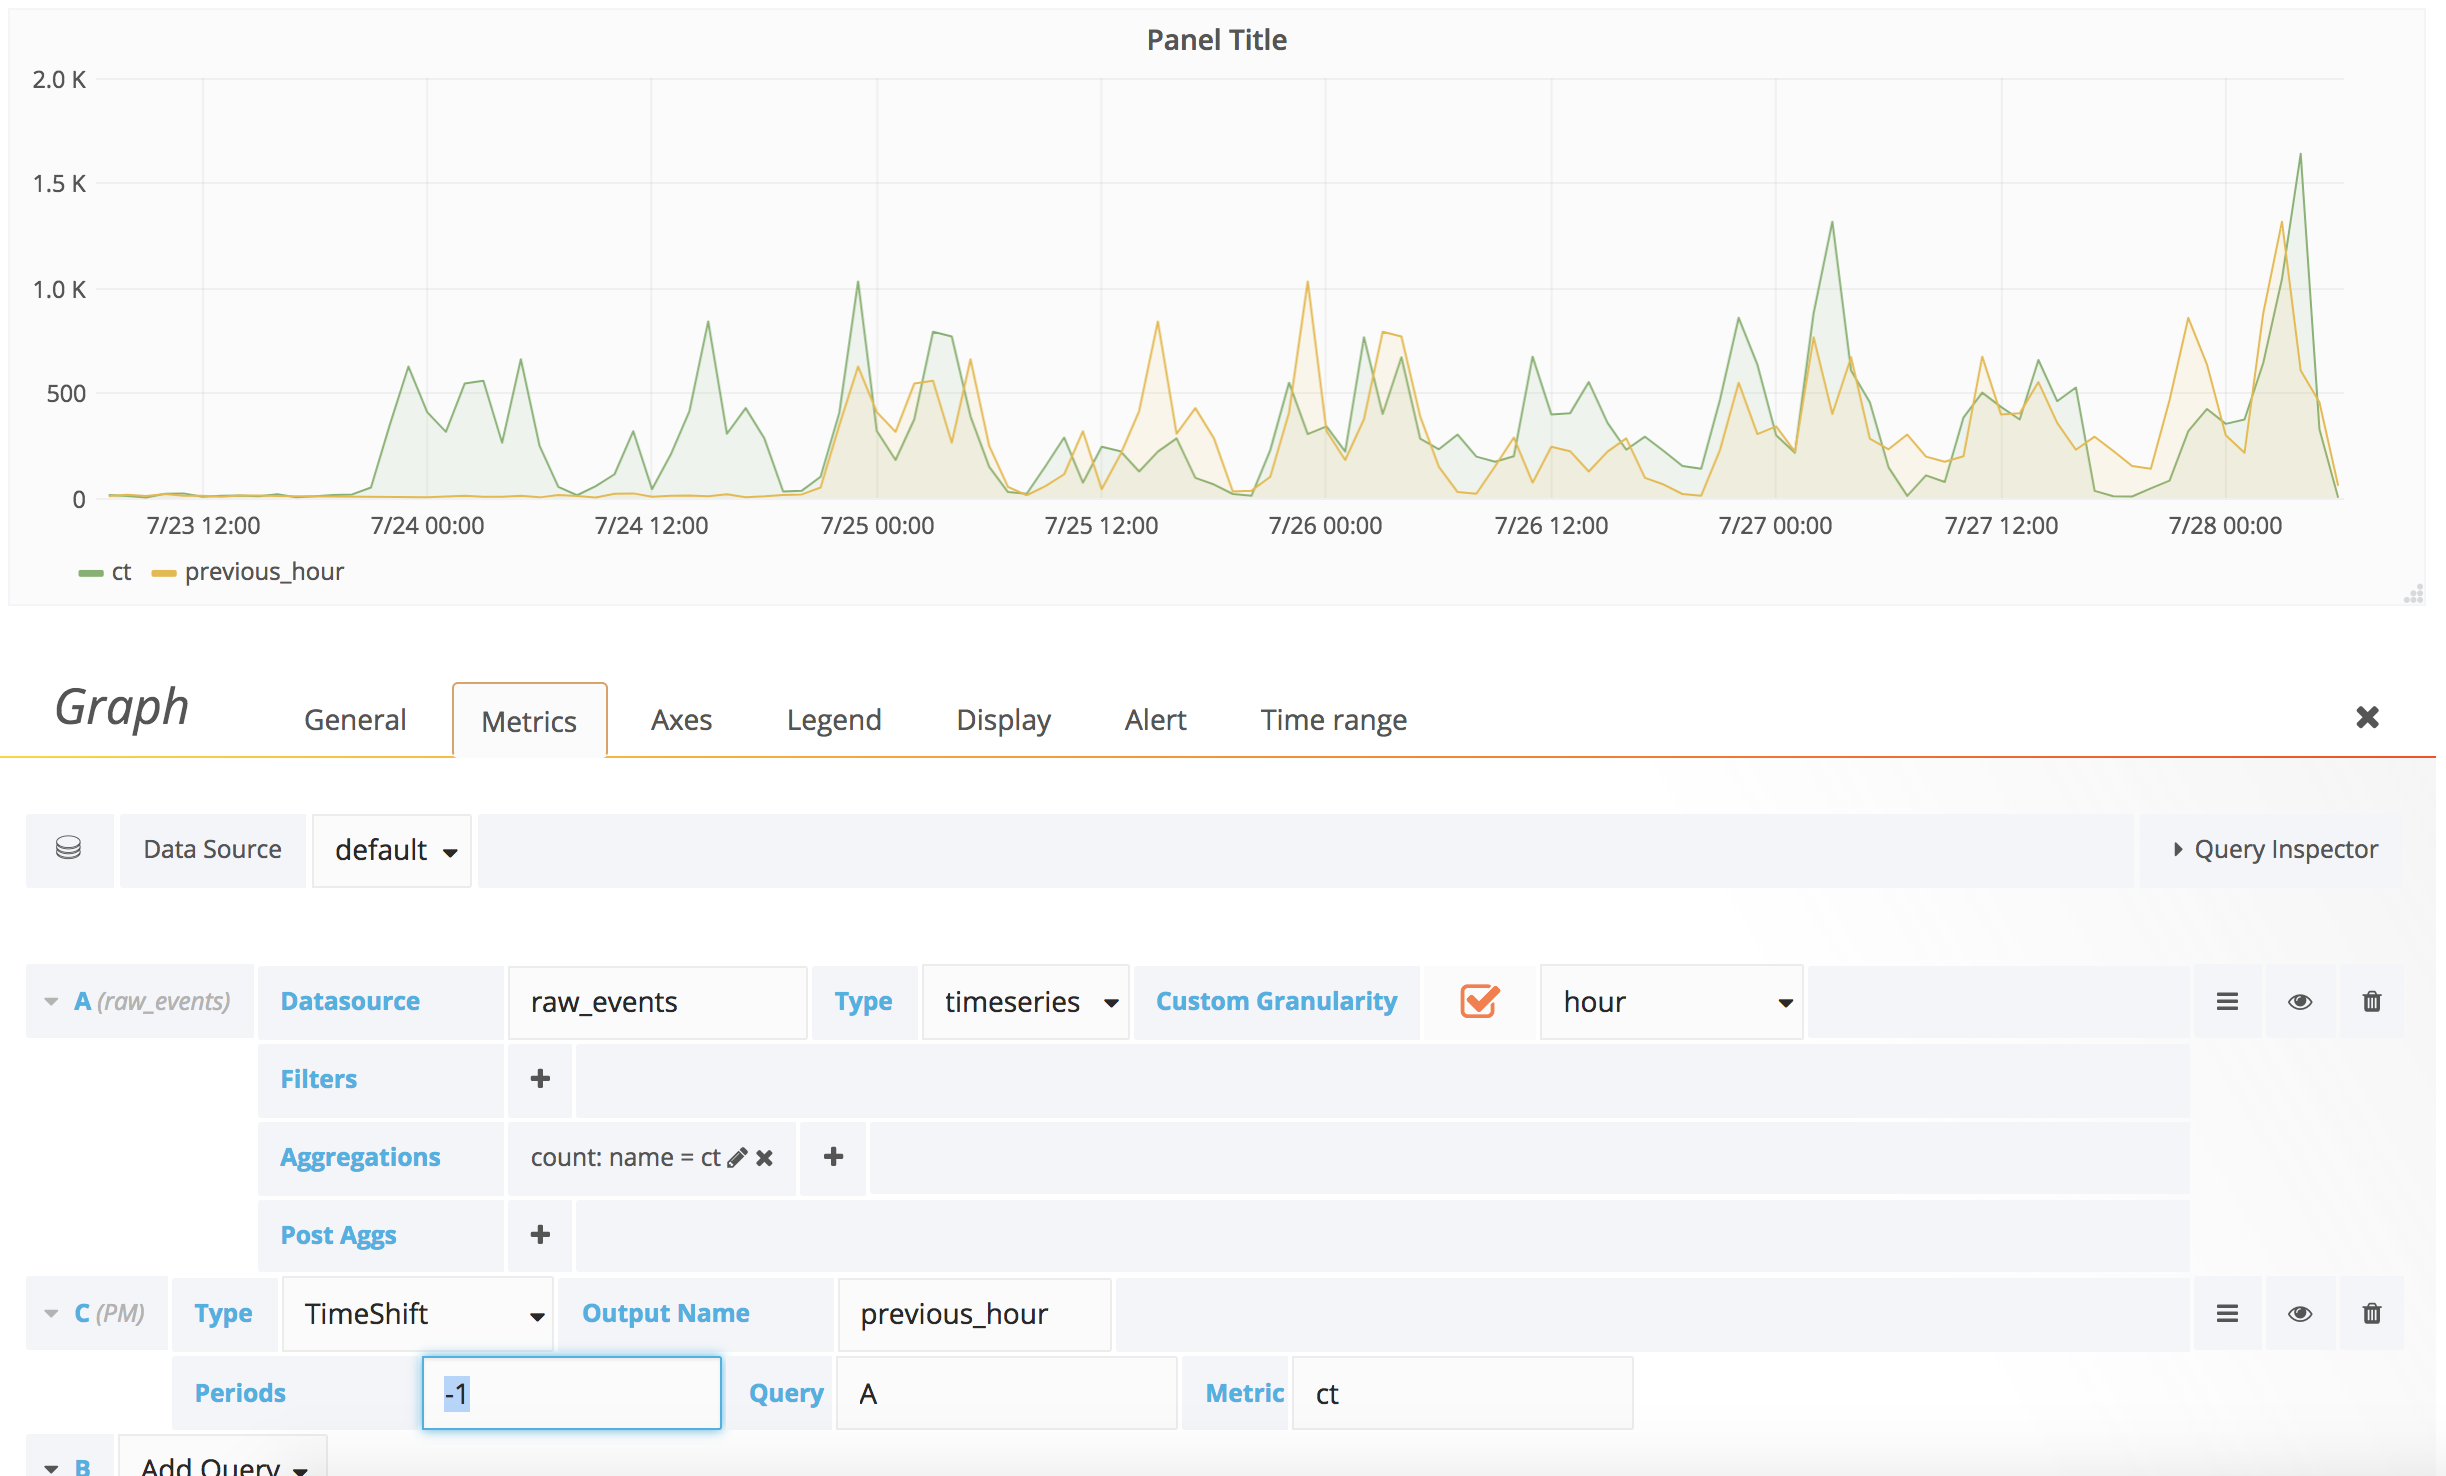
Time Shift
Compatibility
Grafana Meta Queries plugin 0.0.1 and above are supported for Grafana: 4.x.x
Supports Nesting
- Moving average of moving average
- Moving average of time shift
- Time shift of Moving average
- Time shift of Time Shift
Known issue
- Moving average on arithmetic is not supported
- TimeShift on arithmetic is not supported
Status
Lot of features might still not be implemented. Your contributions are welcome.
Grafana Cloud Free
- Free tier: Limited to 3 users
- Paid plans: $55 / user / month above included usage
- Access to all Enterprise Plugins
- Fully managed service (not available to self-manage)
Self-hosted Grafana Enterprise
- Access to all Enterprise plugins
- All Grafana Enterprise features
- Self-manage on your own infrastructure
Installing MetaQueries on Grafana Cloud:
Installing plugins on a Grafana Cloud instance is a one-click install; same with updates. Cool, right?
Note that it could take up to 1 minute to see the plugin show up in your Grafana.
Installing plugins on a Grafana Cloud instance is a one-click install; same with updates. Cool, right?
Note that it could take up to 1 minute to see the plugin show up in your Grafana.
Installing plugins on a Grafana Cloud instance is a one-click install; same with updates. Cool, right?
Note that it could take up to 1 minute to see the plugin show up in your Grafana.
Installing plugins on a Grafana Cloud instance is a one-click install; same with updates. Cool, right?
Note that it could take up to 1 minute to see the plugin show up in your Grafana.
Installing plugins on a Grafana Cloud instance is a one-click install; same with updates. Cool, right?
Note that it could take up to 1 minute to see the plugin show up in your Grafana.
Installing plugins on a Grafana Cloud instance is a one-click install; same with updates. Cool, right?
Note that it could take up to 1 minute to see the plugin show up in your Grafana.
Installing plugins on a Grafana Cloud instance is a one-click install; same with updates. Cool, right?
Note that it could take up to 1 minute to see the plugin show up in your Grafana.
For more information, visit the docs on plugin installation.
Installing on a local Grafana:
For local instances, plugins are installed and updated via a simple CLI command. Plugins are not updated automatically, however you will be notified when updates are available right within your Grafana.
1. Install the Data Source
Use the grafana-cli tool to install MetaQueries from the commandline:
grafana-cli plugins install The plugin will be installed into your grafana plugins directory; the default is /var/lib/grafana/plugins. More information on the cli tool.
Alternatively, you can manually download the .zip file for your architecture below and unpack it into your grafana plugins directory.
Alternatively, you can manually download the .zip file and unpack it into your grafana plugins directory.
2. Configure the Data Source
Accessed from the Grafana main menu, newly installed data sources can be added immediately within the Data Sources section.
Next, click the Add data source button in the upper right. The data source will be available for selection in the Type select box.
To see a list of installed data sources, click the Plugins item in the main menu. Both core data sources and installed data sources will appear.


