
Untimely
Introduction
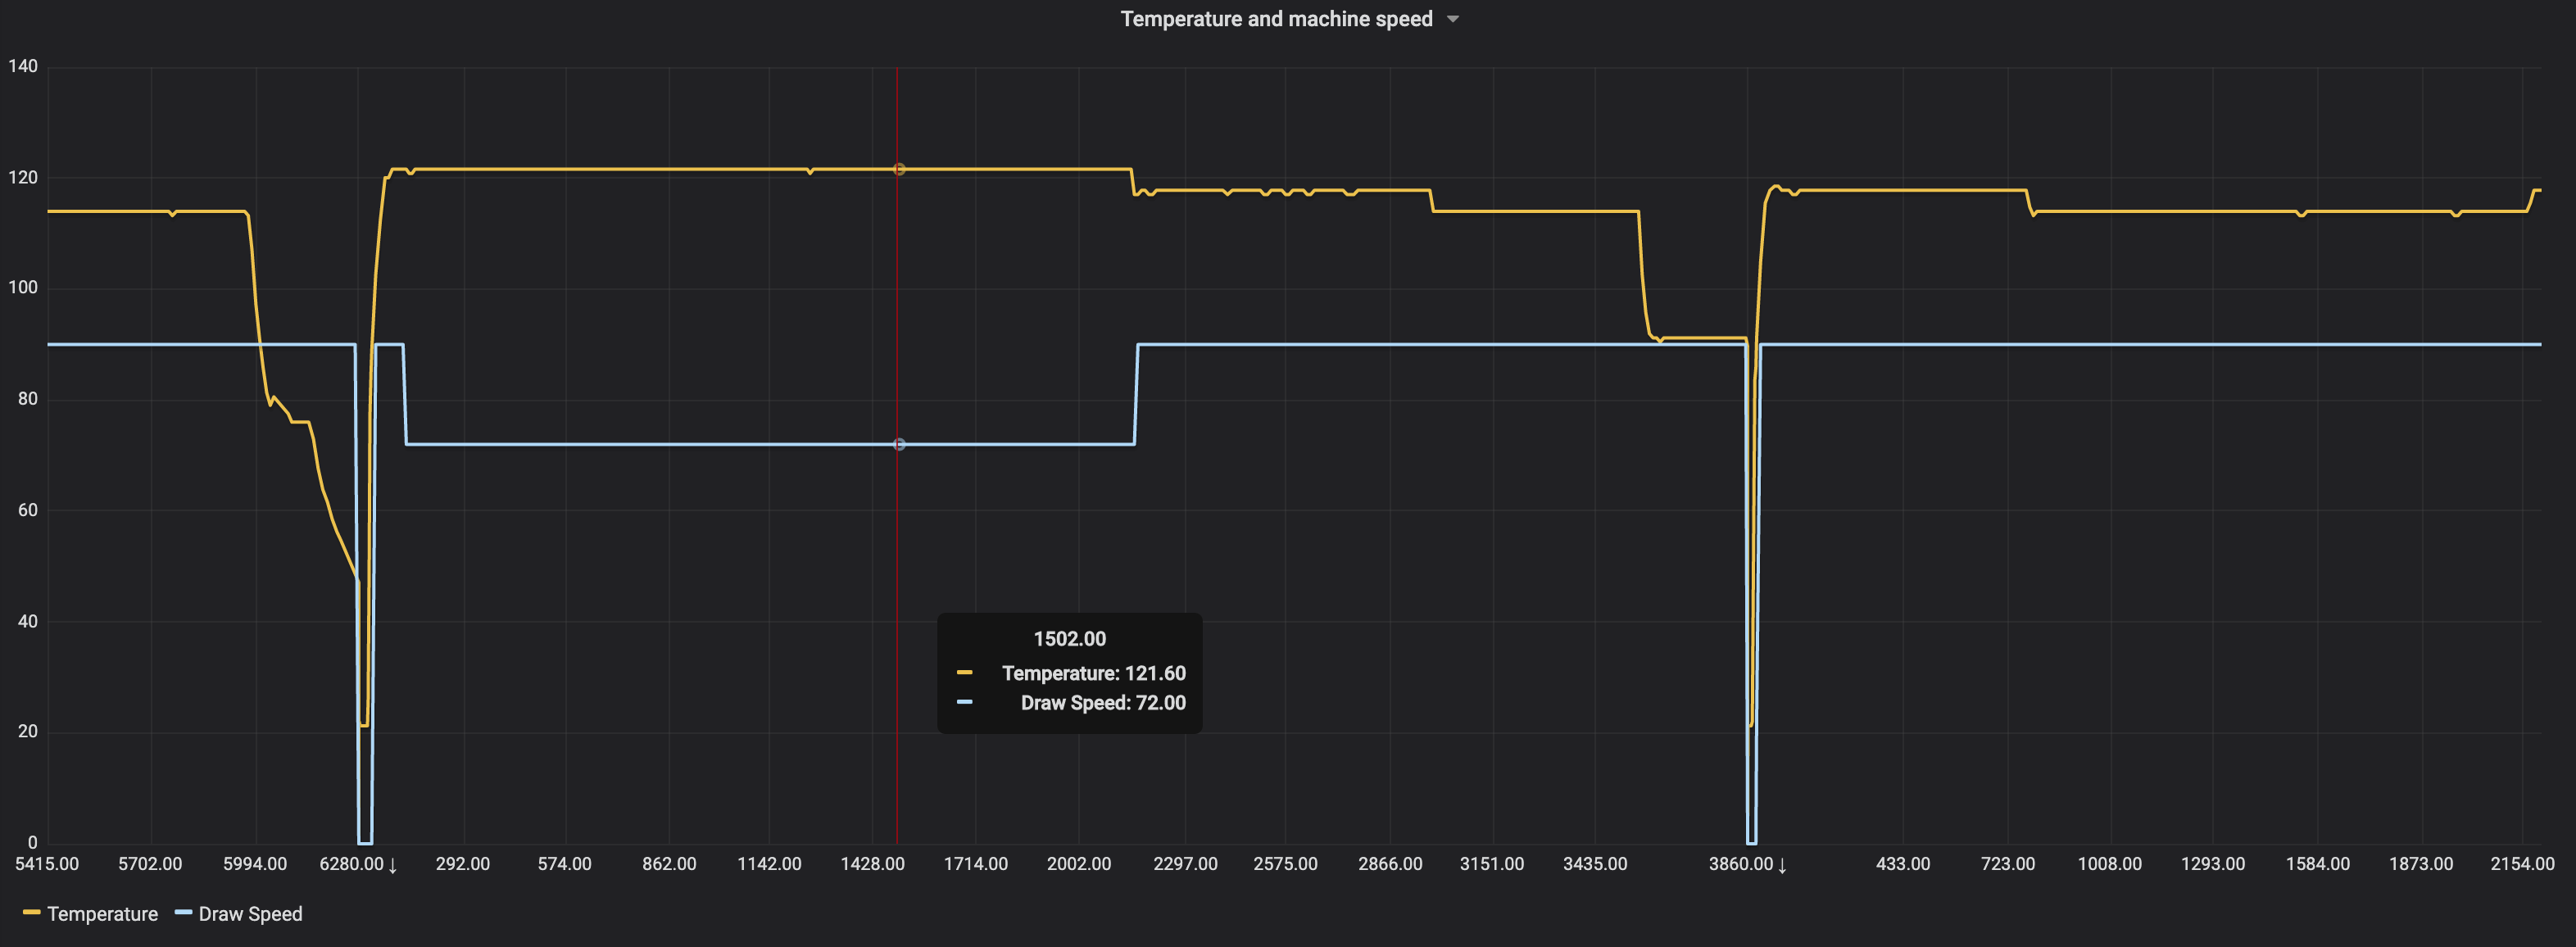
The Untimely Grafana plugin is a panel that facilitates working with distances on the x-axis (or anything else that isn't time).
You add queries to your visualization, then select the query that represents the x-axis. The different series will then be interlinked based on their timestamps.
It's based on the Grafana React example using Typescript.
Features
- Resets: whenever the x-axis value resets, dropping below a previous value, the graph values keep going
- Legend: the panel has a simple legend, similar looking to the default Grafana legend
- Tooltip: the panel has a simple tooltip, supporting multiple series, similar to the default Grafana tooltip
- Offset: when the x-values have a certain offset, you can define this
Usage and tips
- Use the decimal formatting to choose how many decimals should be in the ticks and on the tooltip
- When you have resets, choose the 'max' selector for your x-axis series and the 'min' selector for the other series
- A little downwards arrow next to a value denotes that there is a reset
- Version
- 0.3.1
- Dependencies
- Grafana >=8.3.2
- Developer
- factry
- Last Updated
- January 26, 2023