Plugins 〉Interactive Tree Panel


Interactive Tree Panel
Interactive Tree Plugin
Welcome to the Interactive Tree Plugin, your solution for creating interactive Tree diagrams in Grafana 10.4+.
How it Works
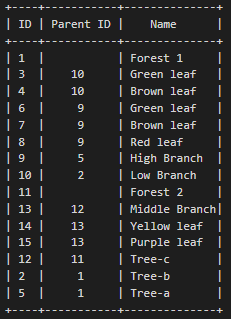
The Interactive Tree Panel is designed to visualize hierarchical data effortlessly. To use it effectively, the following fields need to be mapped:
- Node ID: Identifies each node uniquely.
- Parent ID: Specifies the parent node's ID for each node.
- Node Label: Describes the name or label of each node.
Don't worry if you have additional fields; the panel can handle them seamlessly. In the panel settings, you can customize the column names corresponding to Node ID, Parent ID, and Node Name.
The panel starts by identifying rows with NULL in the Parent ID field; these are considered root nodes. It then recursively adds child nodes by matching the Node ID of a root node with the Parent ID of other nodes.
Panel options
When configuring the panel, you have several customization options at your disposal:
Tree options
Node ID field name: Every row of data results in a node. Set the field containing the ID of the node.
Node label field name: Set the field that will be used to render the label of the node.
Node parent ID field name: Set the field that contains the parent ID of the nodes.
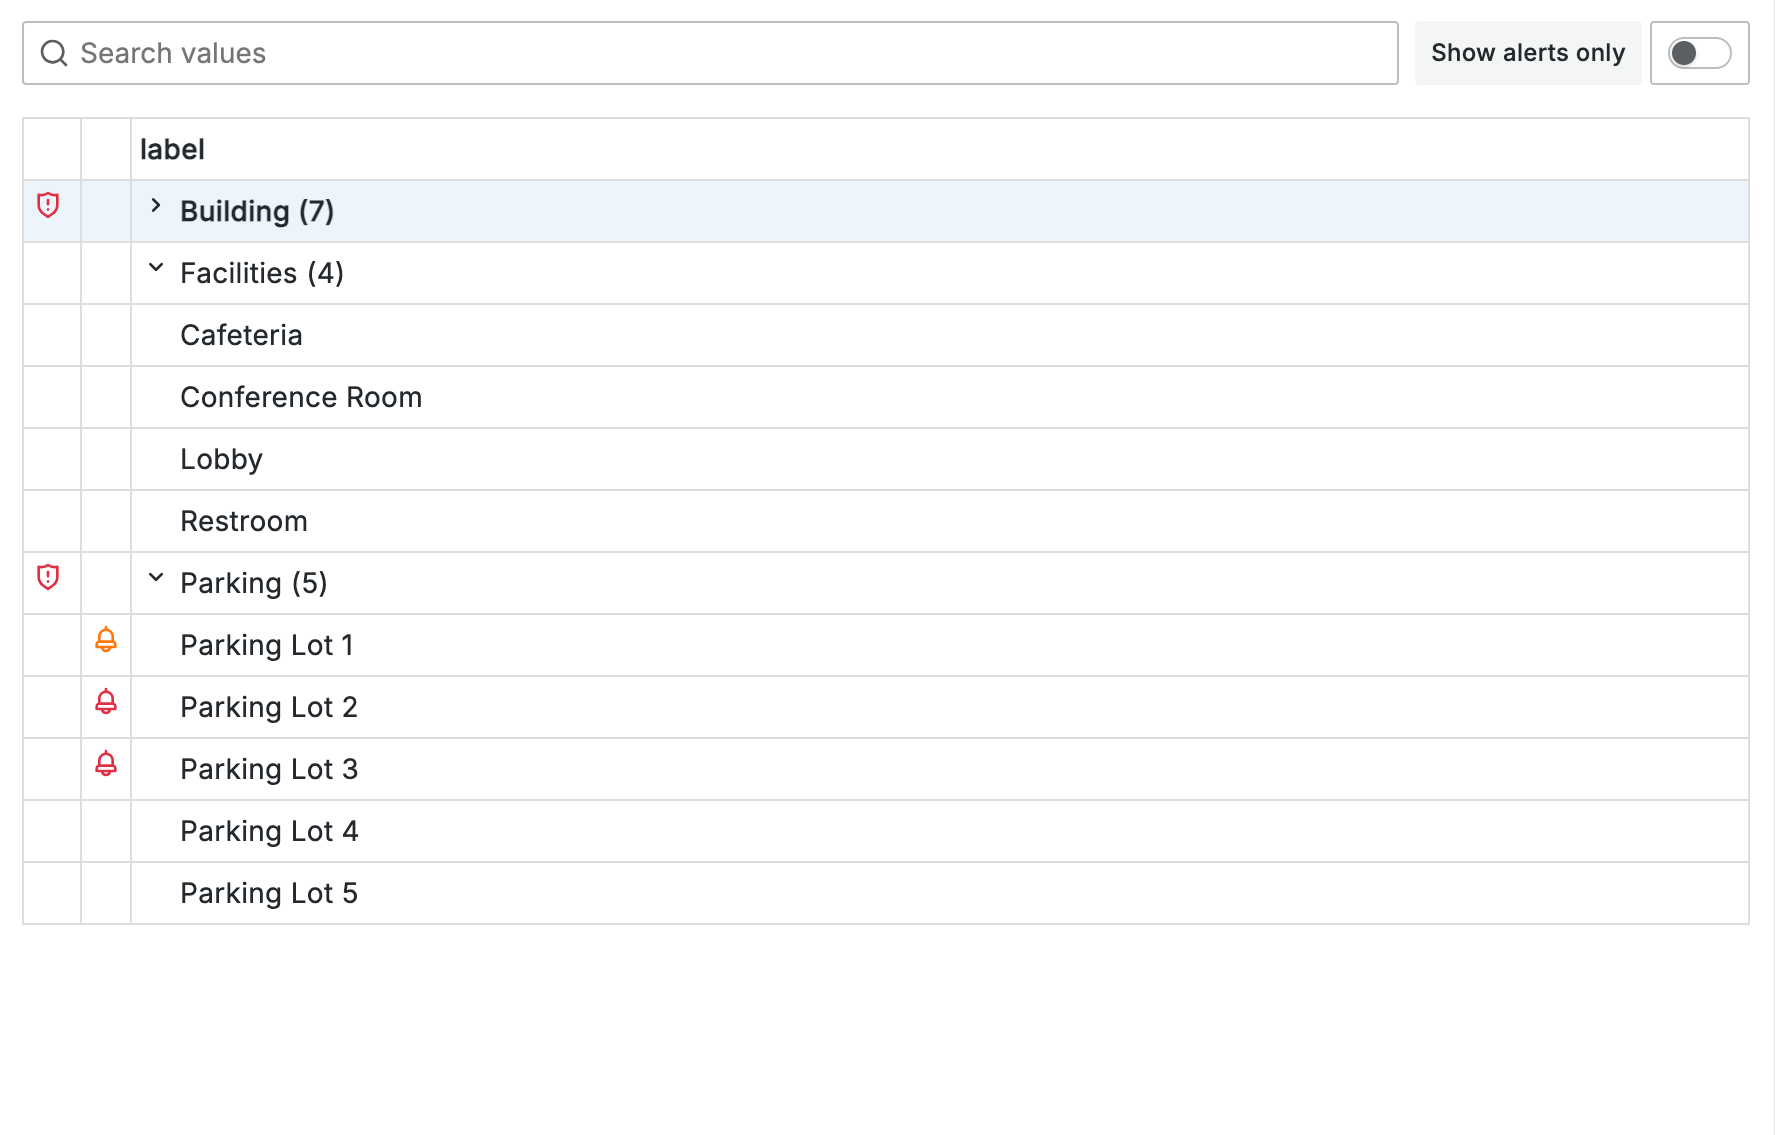
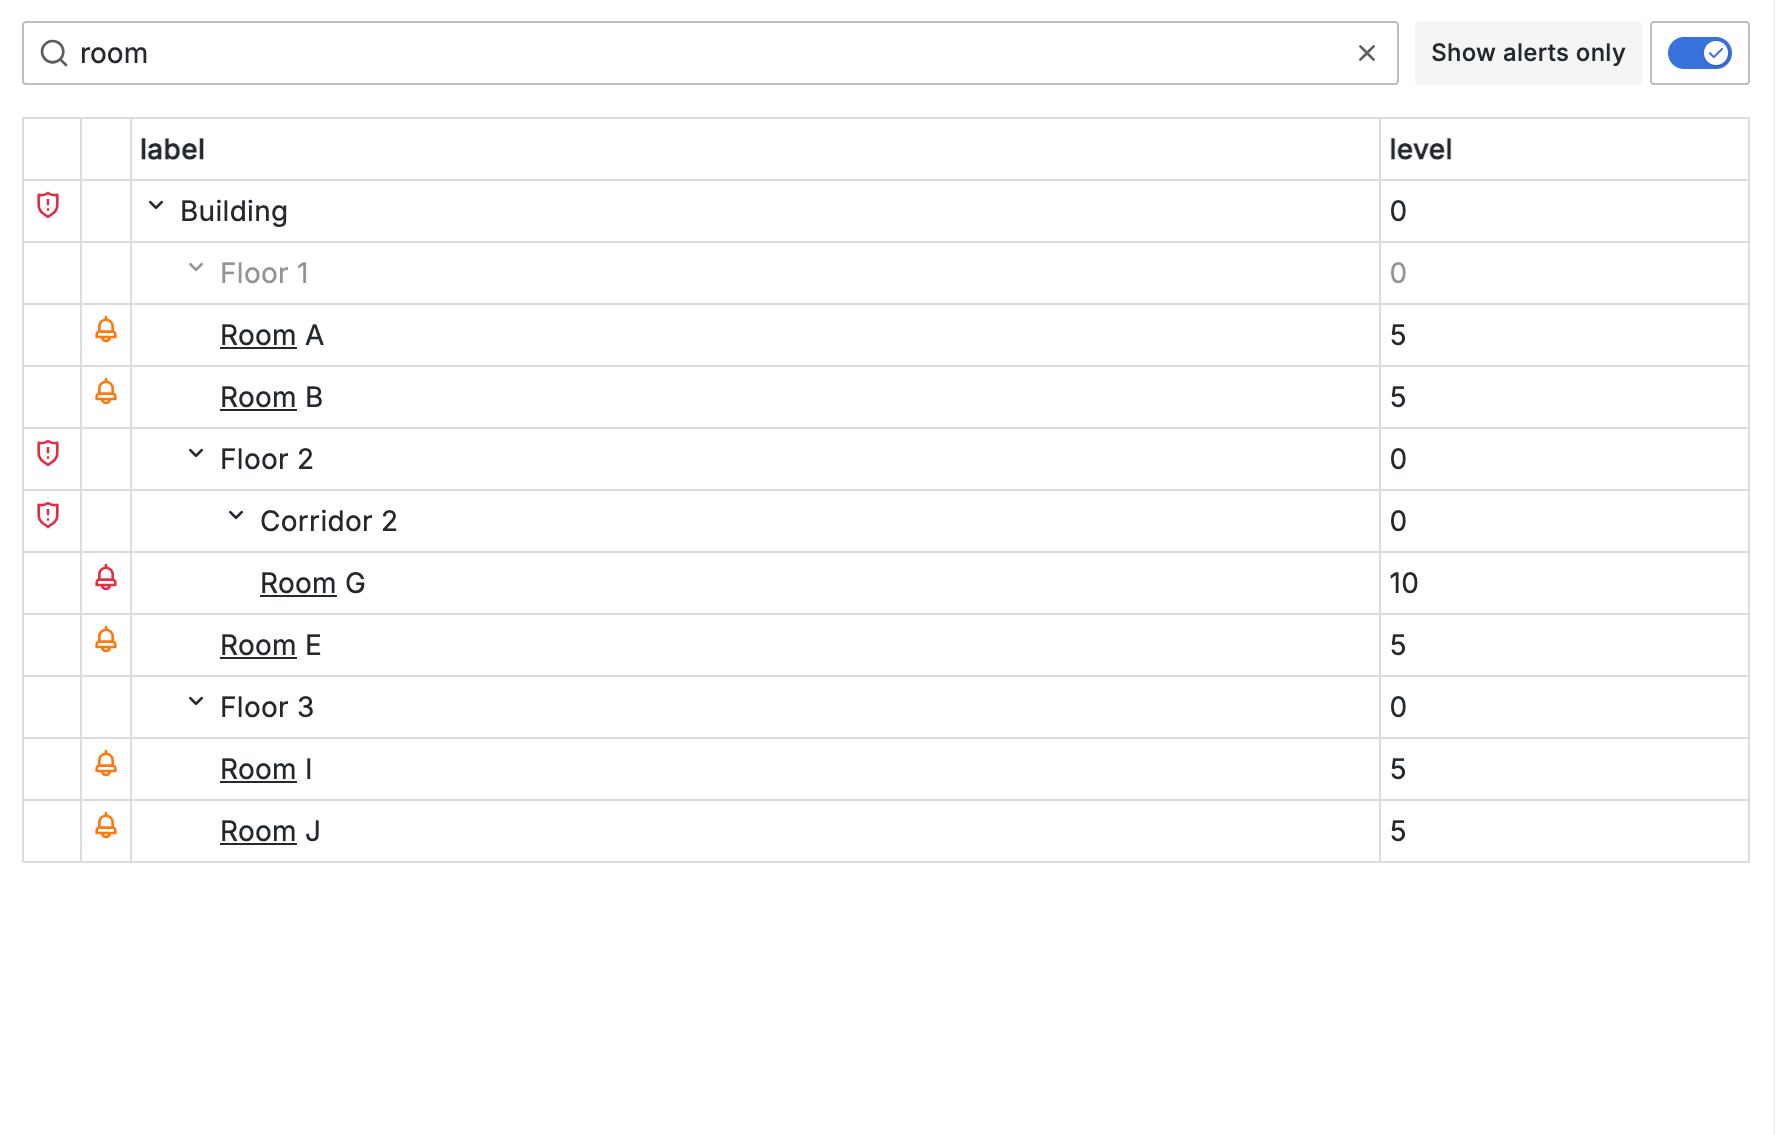
Additional fields: Comma separated list of extra field names to display. This will transform the tree into a table.
Support disabled nodes: Disabled nodes will be displayed greyed-out and are neither selectable nor expandable.
Node disabled field name: Set the field that indicates if a node is disabled. Supports: boolean = true, string = true, both indicating a disabled node.
Expanded levels: Number of levels that are initially expanded. Applied after save and apply (page refresh).
Show item count: Display the number of first-level child nodes between parenthesis after the label.
Node ID field name: Every row of data results in a node. Set the field containing the ID of the node.
Node label field name: Set the field that will be used to render the label of the node.
Node parent ID field name: Set the field that contains the parent ID of the nodes.
Additional fields: Comma separated list of extra field names to display. This will transform the tree into a table.
Support disabled nodes: Disabled nodes will be displayed greyed-out and are neither selectable nor expandable.
Node disabled field name: Set the field that indicates if a node is disabled. Supports: boolean = true, string = true, both indicating a disabled node.
Expanded levels: Number of levels that are initially expanded. Applied after save and apply (page refresh).
Show item count: Display the number of first-level child nodes between parenthesis after the label.
Order in each level: Ascending, descending or source.
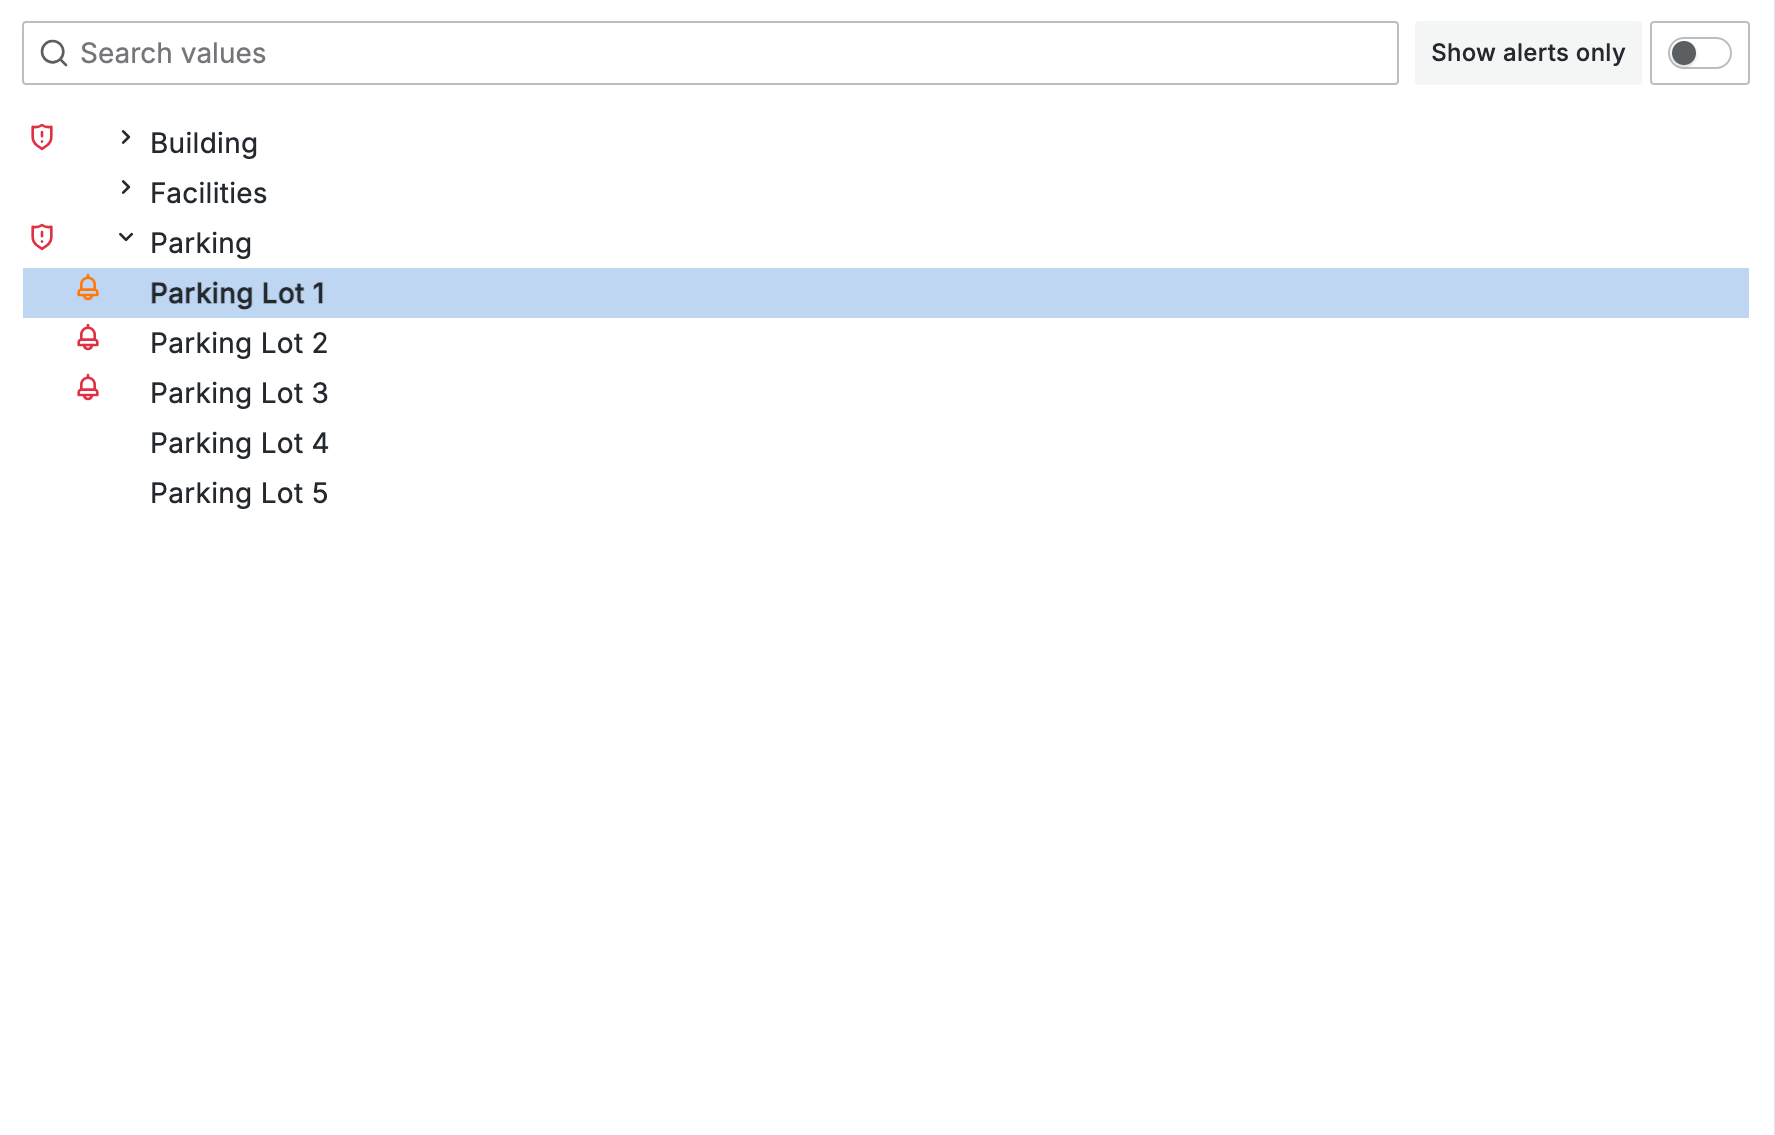
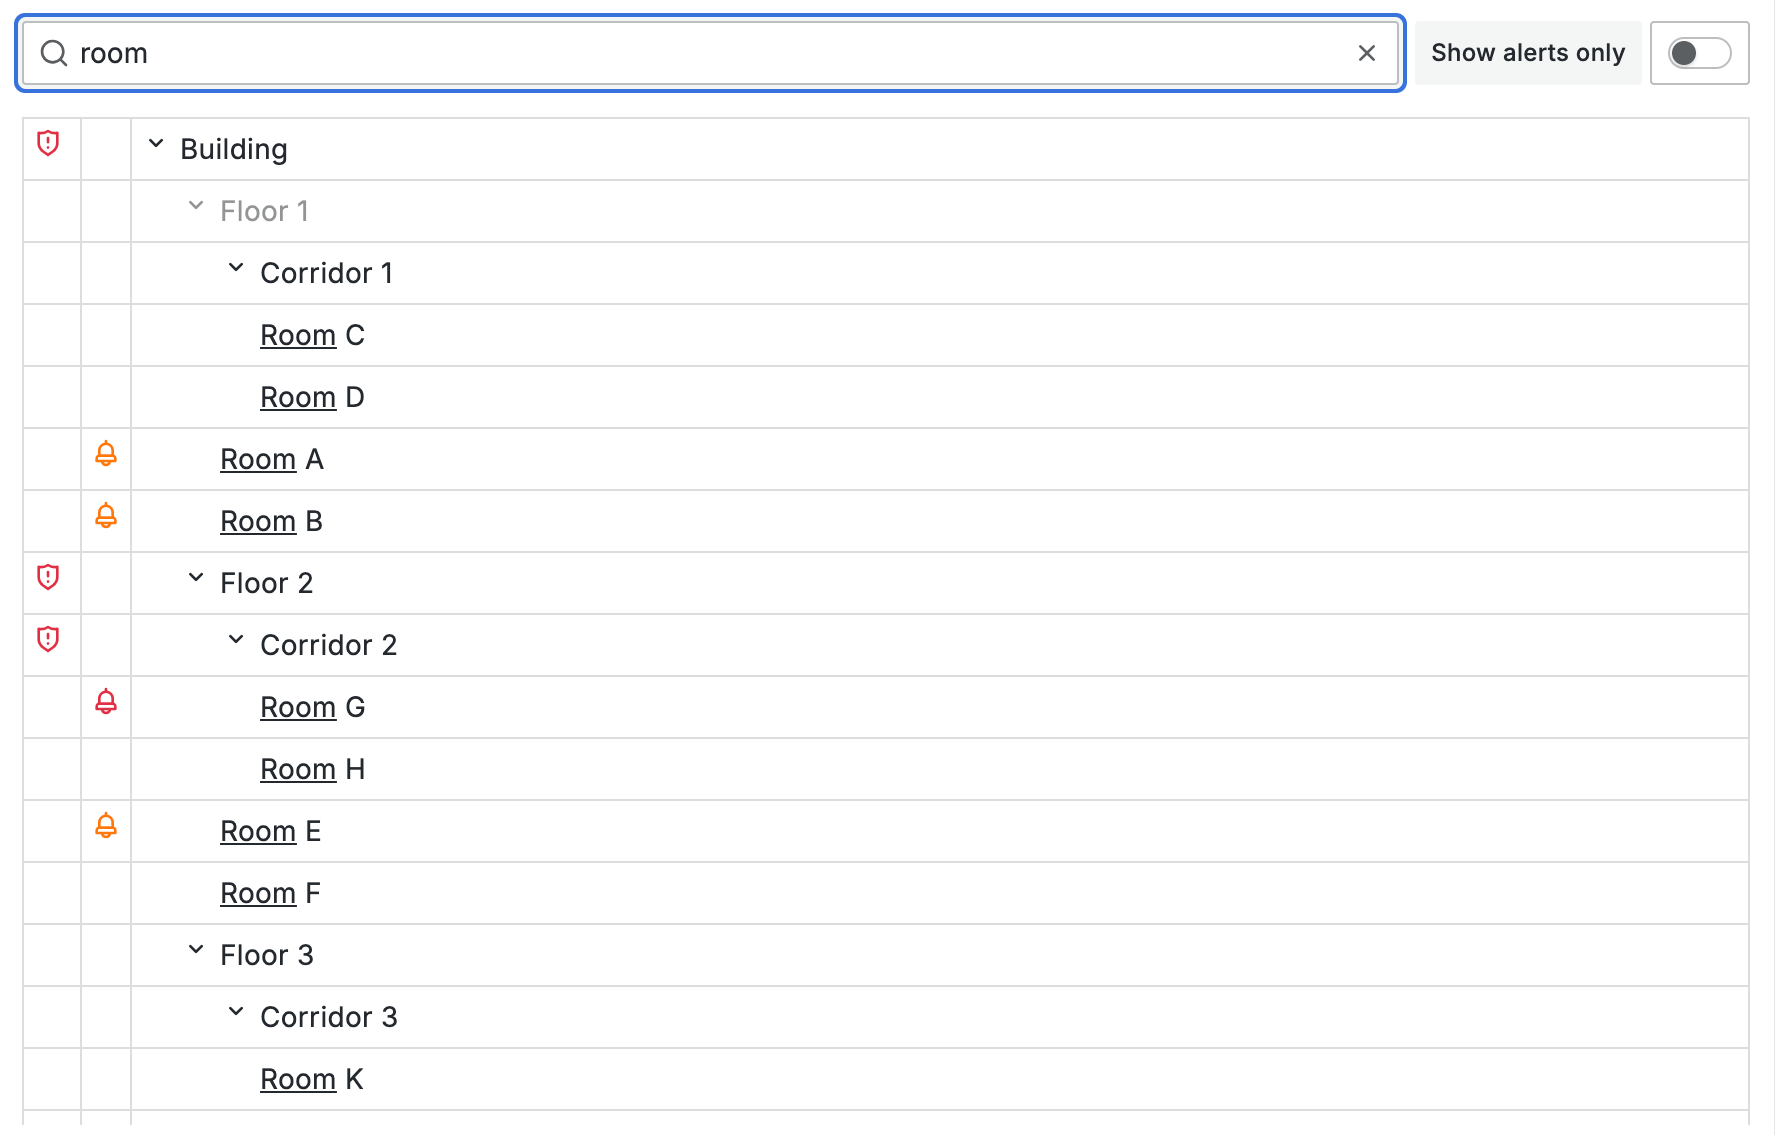
Search options
- Show Search: @@TODO
- Search input placeholder text: Placeholder text to display in the search input field.
- Icon filter: Enables a toggle button that will filter on nodes containing icons and their parents.
- Icon filter label: Label to display for this toggle button.
Toggle and select options
- Toggle mode: How Chevron and Label clicking is handled. with
no togglemake sureExpanded levelsis high enough. - Allow multi select using Ctrl-Click or Shift-Click: Select different nodes by holding down the Ctrl key or visible ranges using the Shift key.
- Show checkbox: Select different nodes by using a checkbox in front of the label.
- Enable select/deselect all Add an option to the list to select or deselect all nodes at once.
- Include disabled nodes in select/deselect all Select or deselect disabled nodes when select/deselect all checkbox is clicked.
- Click mode: How interaction with the tree is handled.
Set dashboard variablewill store the id of the clicked node(s) in a dashboard variable.Data linkwill open a URL when a node is clicked.Bothwill store the id of the clicked node(s) in a dashboard variable and shows an icon that will open a URL when clicked. - Dashboard variable name: Name of the dashboard variable in which the id of the clicked node(s) is/are stored.
- Data link URL: URL to open when a node is clicked. Use the
__datavariable to access the node data. for example:${__data.fields.link:raw}${__data.fields.label:percentencode}. - Open in new tab: When selected, clicking a link will open in a new tab instead of navigating away.
Table options
- Show grid lines: When selected, the grid lines will be visible.
- Show column headers: When selected, the column headers will be visible.
- Compact mode: Reduce the amount of space around table cells to make the table more compact.
Value mapping
- Value mappings: Map values to text and/or colors using one or more mappings.
Icon mapping
An icon can be displayed in front of a node, based on a field and criteria. This allows showing different icons based on different criteria. The icon color can be set using a different field and/or other criteria, allowing different colors for the same icon. The first match will be used.
- Icon field name: Field name that contains the data to calculate the icon.
- Value to icon mappings: Map values to icons using one or more mappings.
- Icon color field name: Field name that contains the data to calculate the icon color.
- Value to icon color mappings: Map values to icon colors using one or more mappings.
Parent icon mapping
A second icon, referred to as parent icon can be used to show a different icon on parent nodes, mainly useful when a node is collapsed. This icon is only visible when the node or one of the children already contains an icon.
- Icon field name: Field name that contains the data to calculate the parent icon.
- Parent icon map condition(s): Map values to parent icons using one or more mappings.
- Parent icon color field name: Field name that contains the data to calculate the parent icon color.
- Parent icon color map condition(s): Map values to parent icon colors using one or more mappings.
- Click mode: Action to perform when an icon on a parent node is clicked.
Expandexpands the node until all values that satisfy the parent icon map condition(s) are visible.Selectselects all enabled children that satisfy the parent icon map condition(s). - Click tooltip: Placeholder text to display in the search input field.
With the Interactive Tree Plugin, you can effortlessly create interactive and informative tree diagrams to visualize your hierarchical data. Explore the possibilities and make your data come to life!
Grafana Cloud Free
- Free tier: Limited to 3 users
- Paid plans: $55 / user / month above included usage
- Access to all Enterprise Plugins
- Fully managed service (not available to self-manage)
Self-hosted Grafana Enterprise
- Access to all Enterprise plugins
- All Grafana Enterprise features
- Self-manage on your own infrastructure
Install on Grafana Cloud
Plugins can be installed directly from within your Grafana instance or automated using the Cloud API or Terraform.
Learn more about plugin installationMarketplace plugins
This is a paid plugin developed by a marketplace partner. To purchase an entitlement, sign in first, then fill out the contact form.
Get this plugin
This is a paid for plugin developed by a marketplace partner. To purchase entitlement please fill out the contact us form.
What to expect:
- Grafana Labs will reach out to discuss your needs
- Payment will be taken by Grafana Labs
- Once purchased the plugin will be available for you to install (cloud) or a signed version will be provided (on-premise)
Thank you! We will be in touch.
For more information, visit the docs on plugin installation.
Installing on a local Grafana:
For local instances, plugins are installed and updated via a simple CLI command. Plugins are not updated automatically, however you will be notified when updates are available right within your Grafana.
1. Install the Panel
Use the grafana-cli tool to install Interactive Tree Panel from the commandline:
grafana-cli plugins install The plugin will be installed into your grafana plugins directory; the default is /var/lib/grafana/plugins. More information on the cli tool.
Alternatively, you can manually download the .zip file for your architecture below and unpack it into your grafana plugins directory.
Alternatively, you can manually download the .zip file and unpack it into your grafana plugins directory.
2. Add the Panel to a Dashboard
Installed panels are available immediately in the Dashboards section in your Grafana main menu, and can be added like any other core panel in Grafana.
To see a list of installed panels, click the Plugins item in the main menu. Both core panels and installed panels will appear.
Changelog
All notable changes to this project will be documented in this file. See standard-version for commit guidelines.
1.7.1 (2025-06-05)
Features
- in this release we've fixed some UI issues and added support for checkbox selection and a toggle to select/deselect all items
1.6.0 (2025-03-27)
Features
- in this release we added support for additional columns, value mappings and icons
1.5.1 (2025-02-21)
Bug Fixes
- in this release we now use the latest Grafana plugin template, upgraded the components used and support Grafana 10.4+
1.4.2 (2024-02-28)
1.4.0 (2024-02-21)
Features
- add escape key support on search input (114dd13), closes #13
- click mode, How interaction with the tree is handled (6f8990b)
- customizable toggle control option (08ffd0e)
- optional search bar (7f03802)
- search is expansion aware (66641cf)
- selected node apears bold (62768c3)
- support data links (c874ad2)
- support disabling of nodes (9b39ec6)
- validate circulair deps (detached branches (e4691c2)
Bug Fixes
- column names case insensitive (efb9745), closes #21
- disabled nodes should not show up as data links (bcaef91)
- disabled to only support true and 'true' (d27d431)
- keep expanded state when updating dashboard var (c4169ab)
- properly handle toggle mode race trace (d646f60)
- search clear button (26c2be6)
- search results as data links (5495d85), closes #13
- select fields by field name picker (eb11632)
- support case insensitive disabled true (f0662ce)
- support node with no link (d426f34)
- support null & undefined in data link variables (d915b97), closes #22
- toggle mode labels (6b4bd7f)
- update selected nodes if dashboard is update from within dashboard (bf41b7c)
1.3.1 (2023-10-27)
Bug Fixes
- add missing css for wrapping overflow (6a77b1e)
1.3.0 (2023-10-24)
Features
- Select nodes based on dashboard variable (7f7b090)
Bug Fixes
- remove tree-click-event-control-mode (578d391)
1.2.7 (2023-10-19)
Bug Fixes
- add automated release (fef641b)
1.2.0 (2023-10-17)
Features
- remove onClick handler to be more sandboxed (b5209bb)
1.1.0 (2023-10-17)
Features
- validate detached branches (a1cab8b)
- validate on unique ID values (ad8c4de)
- validate that parent exists (1a31244)
Bug Fixes
1.0.0 (Unreleased)
Initial release.