Plugins 〉DevOpsProdigy KubeGraf
DevOpsProdigy KubeGraf
DevOpsProdigy KubeGraf
Kubernetes plugin for Grafana
An updated version of the Grafana App for Kubernetes plugin (https://grafana.com/plugins/grafana-kubernetes-app), this plugin allows you to visualize and analyze your Kubernetes cluster’s performance. It demonstrates in graphics the main service metrics and characteristics of the Kubernetes cluster. It also makes it easier to examine the application’s life cycle and error logs.
Requirements
- Grafana > 5.0.0
- Prometheus + node-exporter + kube-state-metrics (version >= 1.4.0)
- Grafana-piechart-panel
Features
The plugin consists of three main info pages with detailed information about the Kubernetes cluster.
Applications overview
- Logic map of applications;
- Distribution of Kubernetes entities;
- List of pod entities with life metrics;
- Visual presentation of the application’s life cycle and its basic characteristics;
- Description of the ports that allow access services in the cluster.
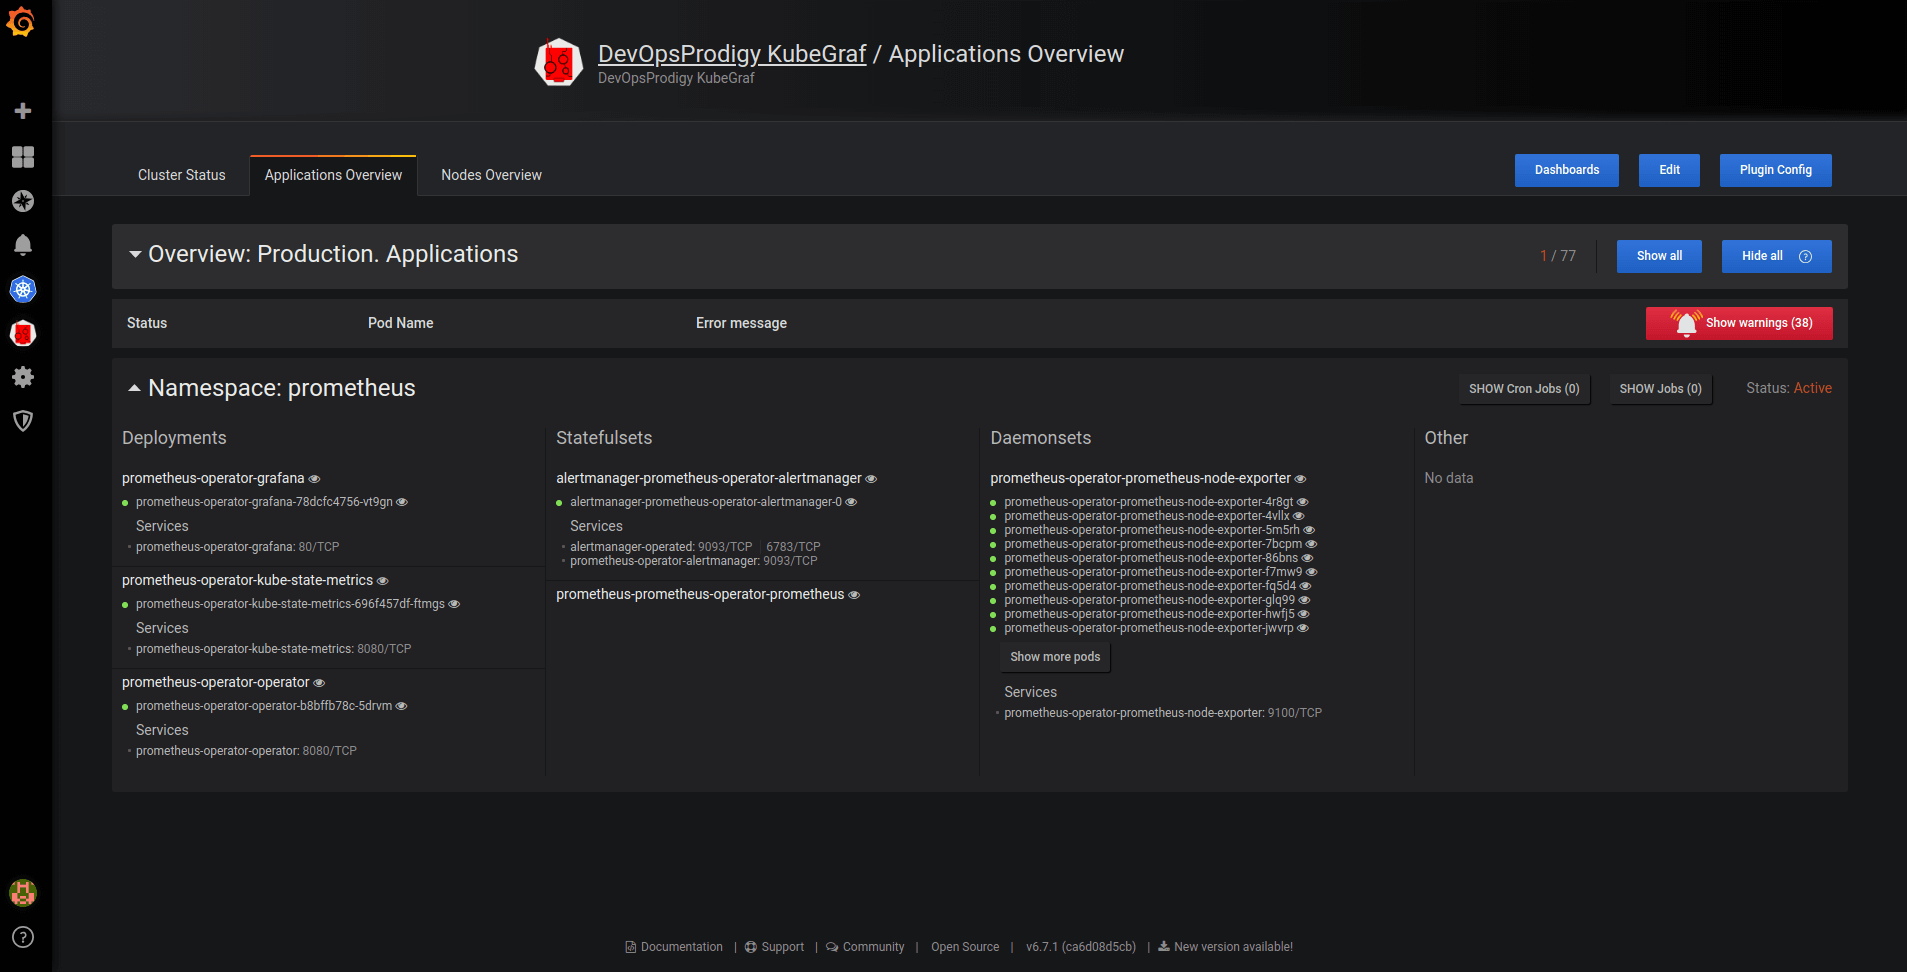
Pic. 1: Applications overview
Cluster status
- Summary about the status of the cluster and the nodes within it;
- Details of monitoring the application’s life cycle;
- Visual presentation of where the services in the cluster servers are located.
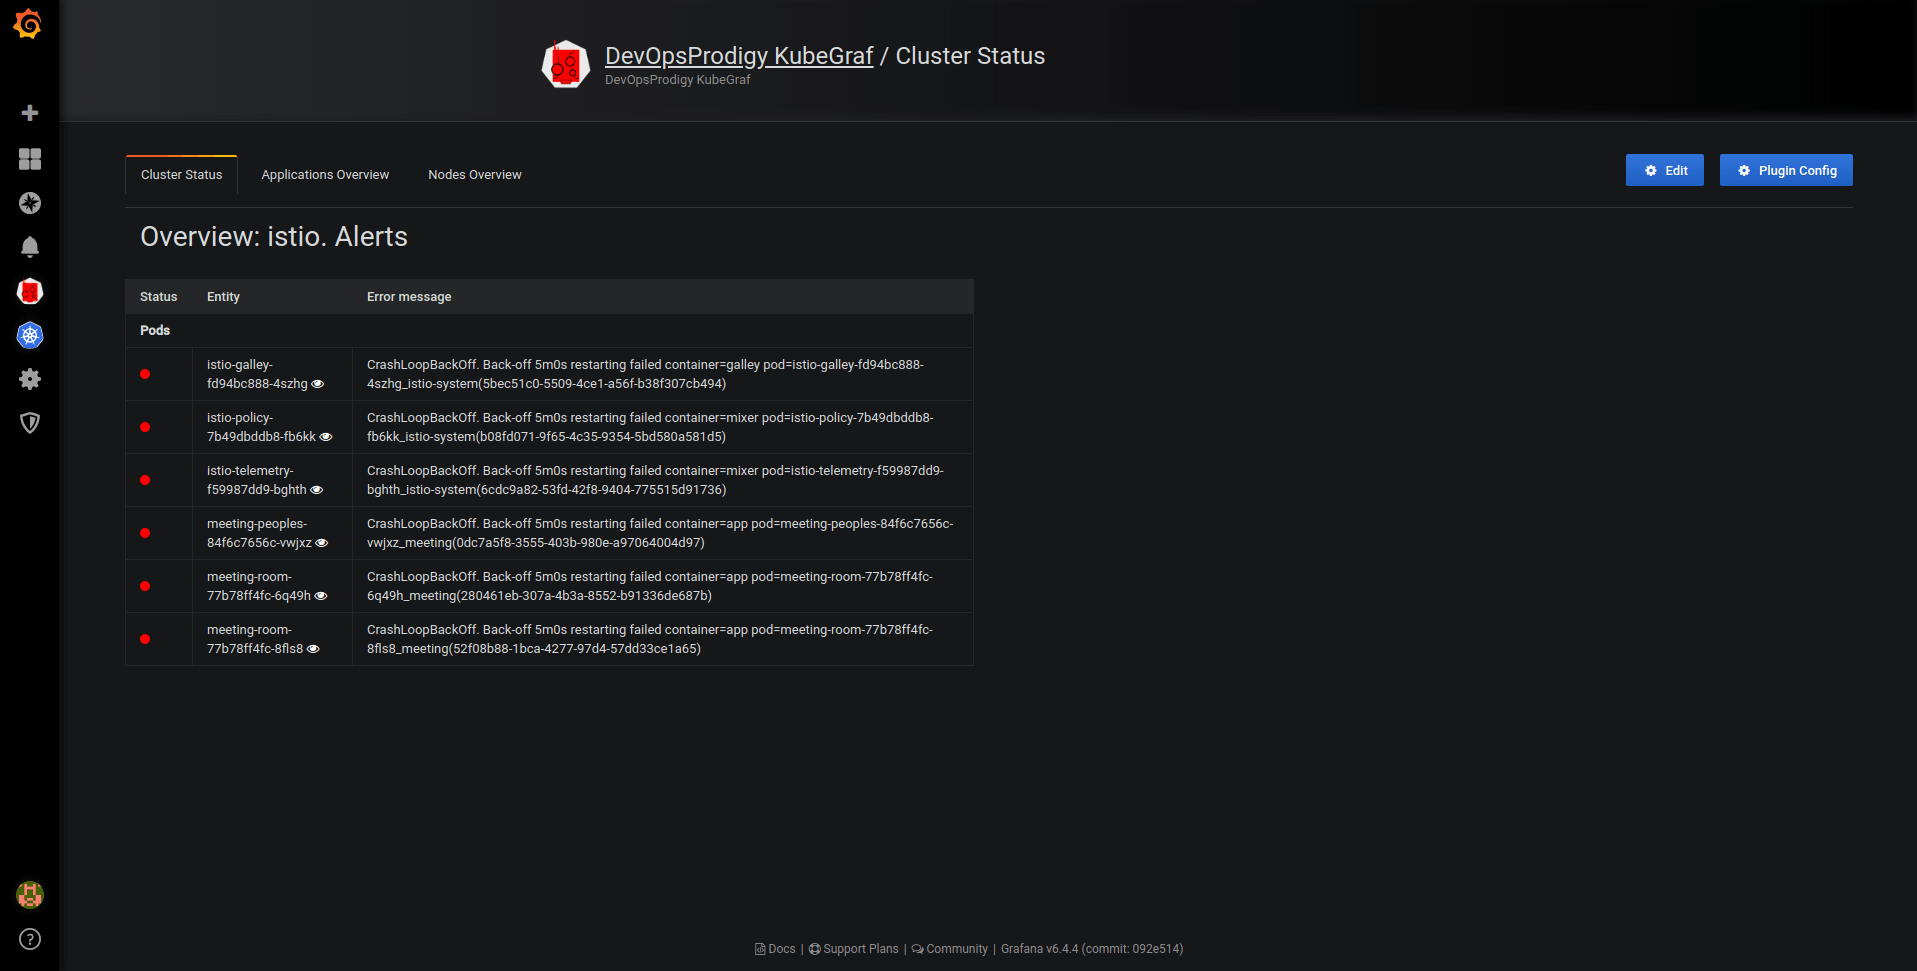
Pic. 2: Cluster status
Nodes overview
- Summary of cluster’s nodes;
- Information about used and allocated resources (RAM, CPU utilization) and the number of pods;
- Physical distribution of pods.
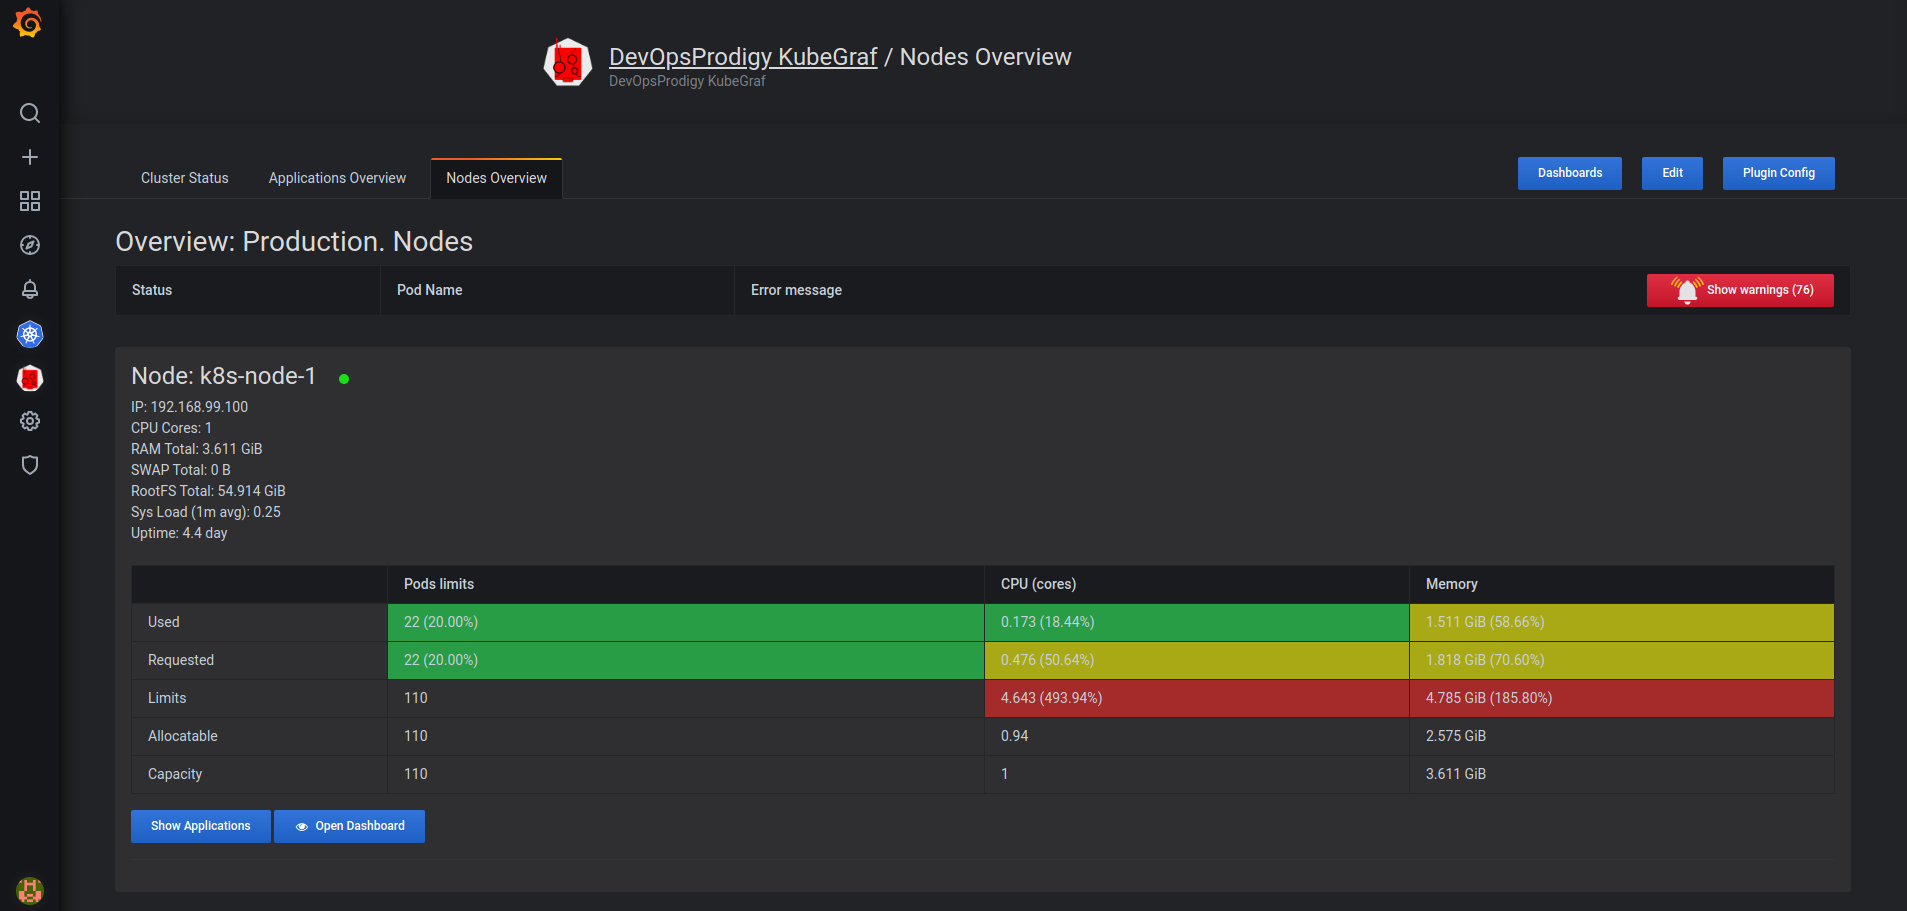
Pic. 3: Nodes overview
Dashboards
Besides providing general information on the main pages, the plugin allows you to track a cluster’s performance in graphs, which are located on five dashboards.
- node dashboard
This is a dashboard with node metrics. It displays the employment of resources like CPU utilization, memory consumption, percentage of CPU time in idle / iowait modes, and disk and network status.
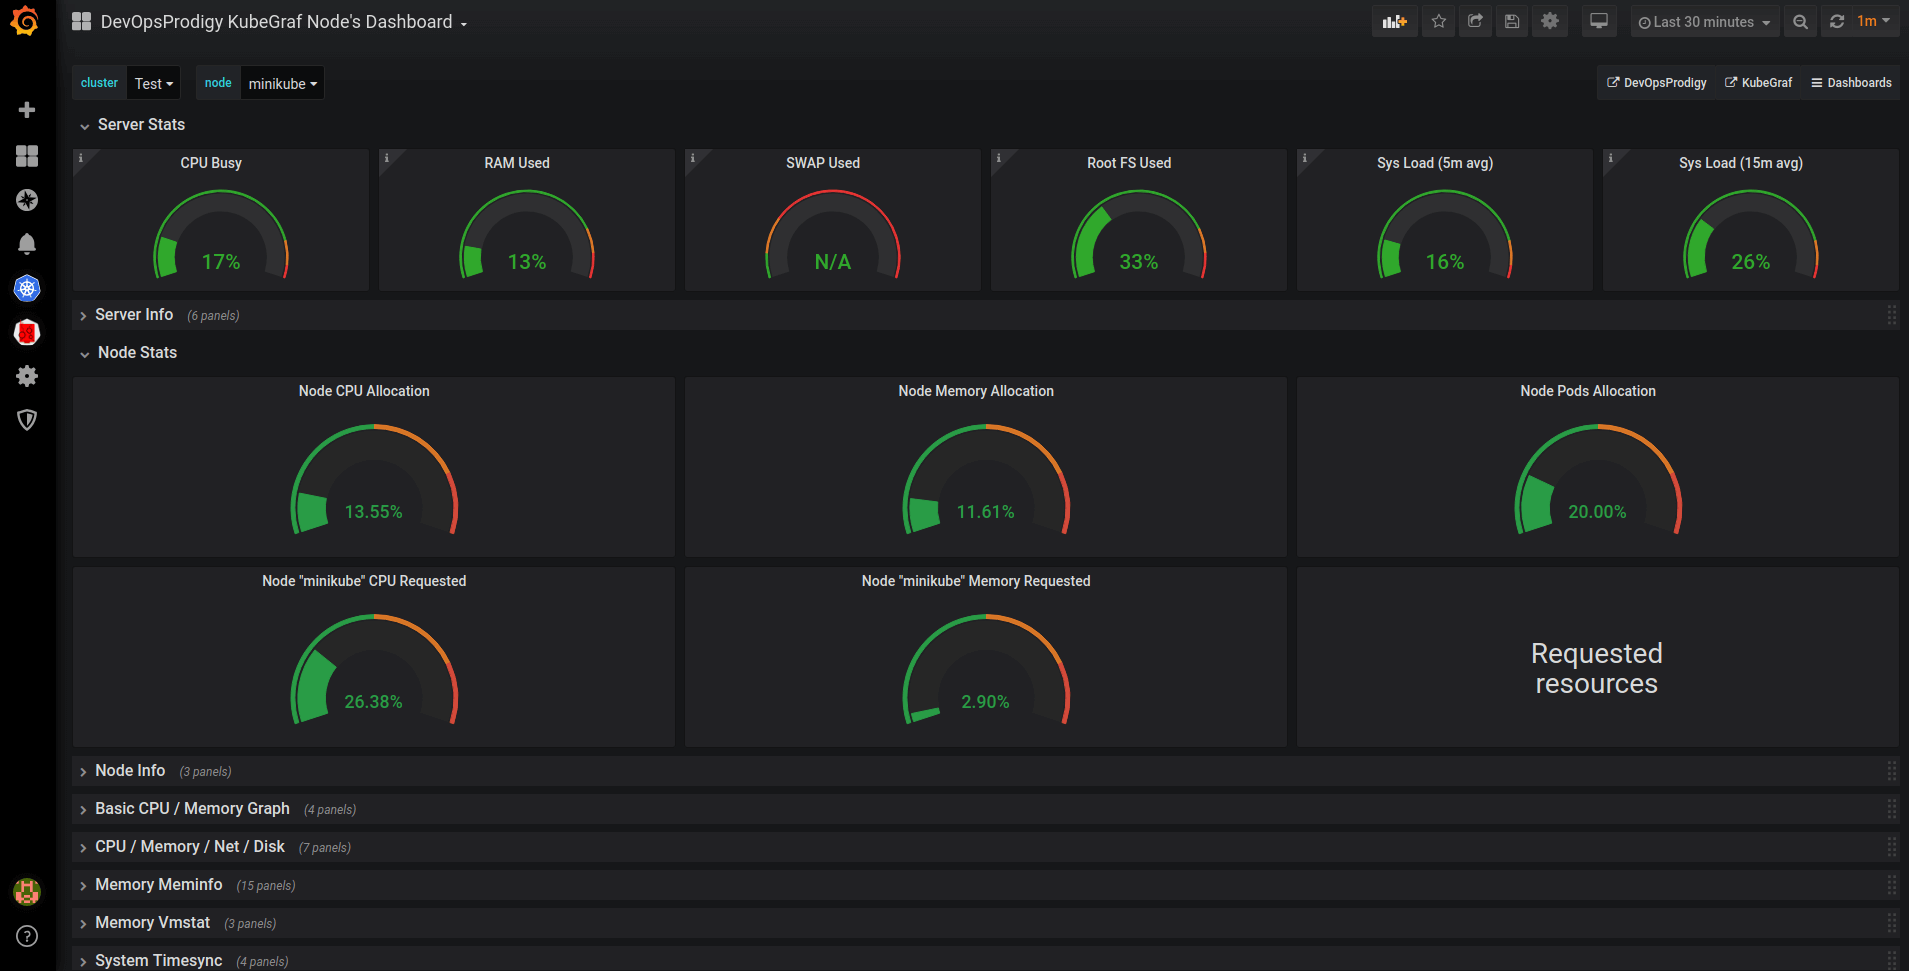
Pic. 4: Node dashboard
- pod resources
Displays how much of the resources the selected pod has used.
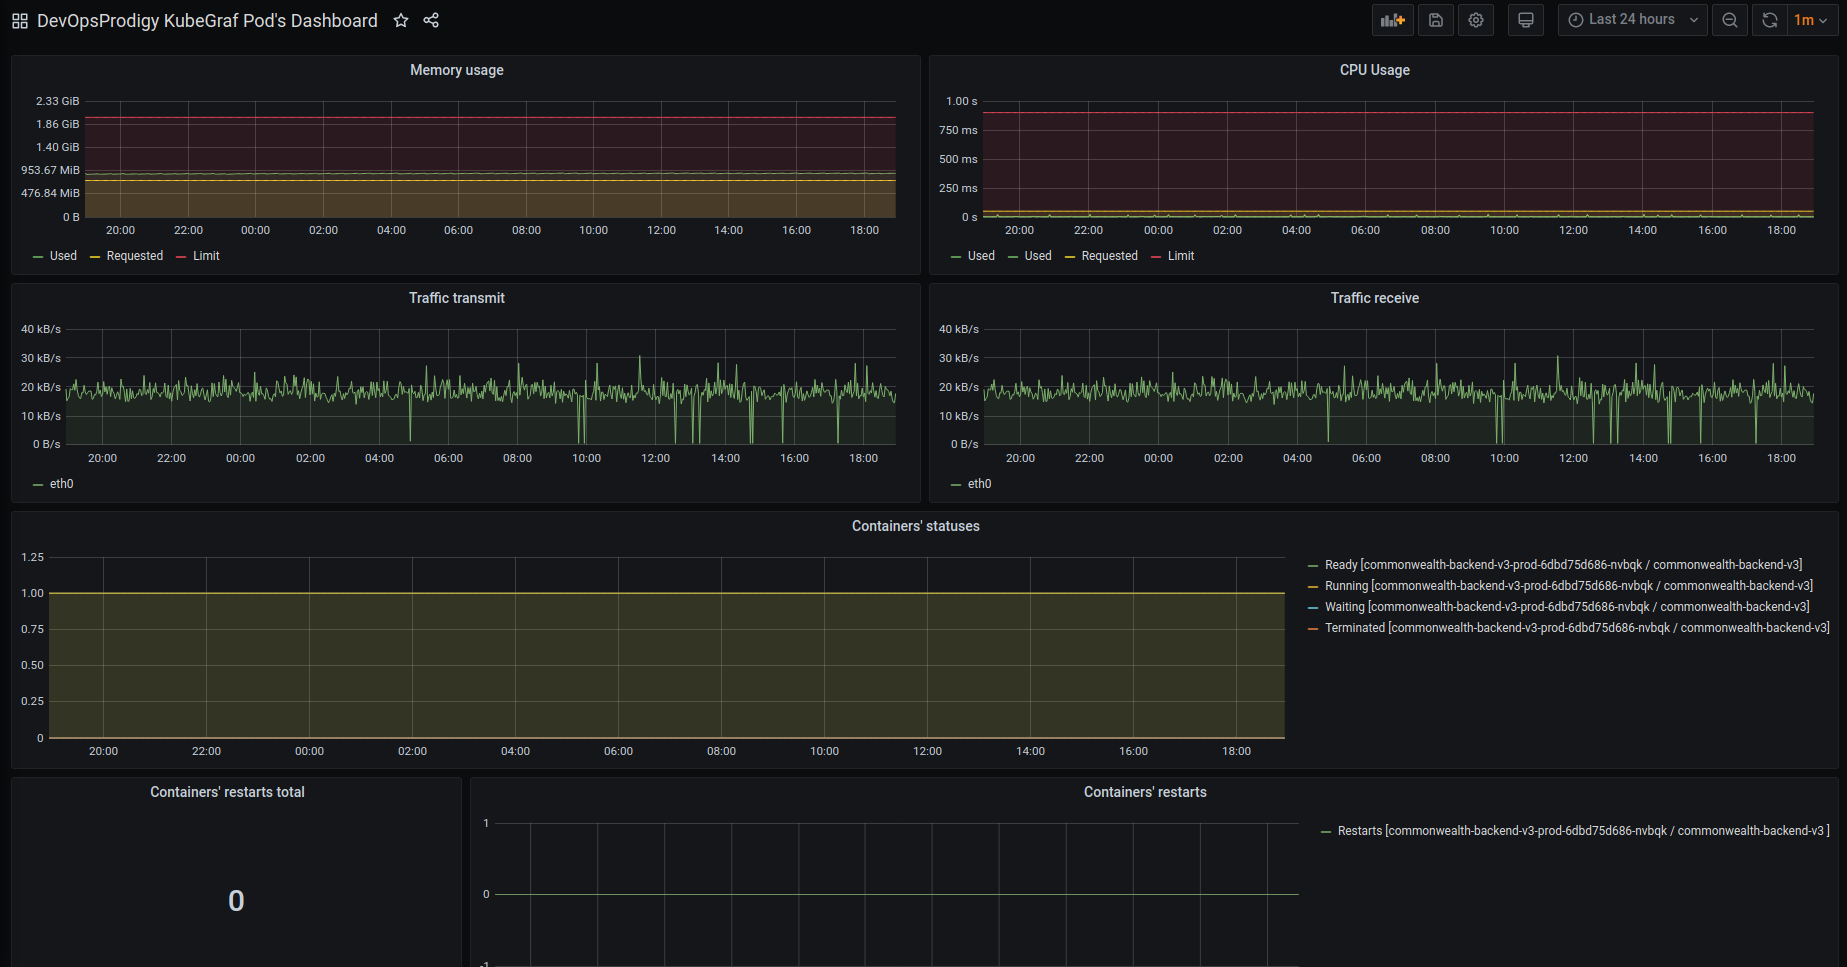
Pic. 5: Pod resources
- deployment dashboard
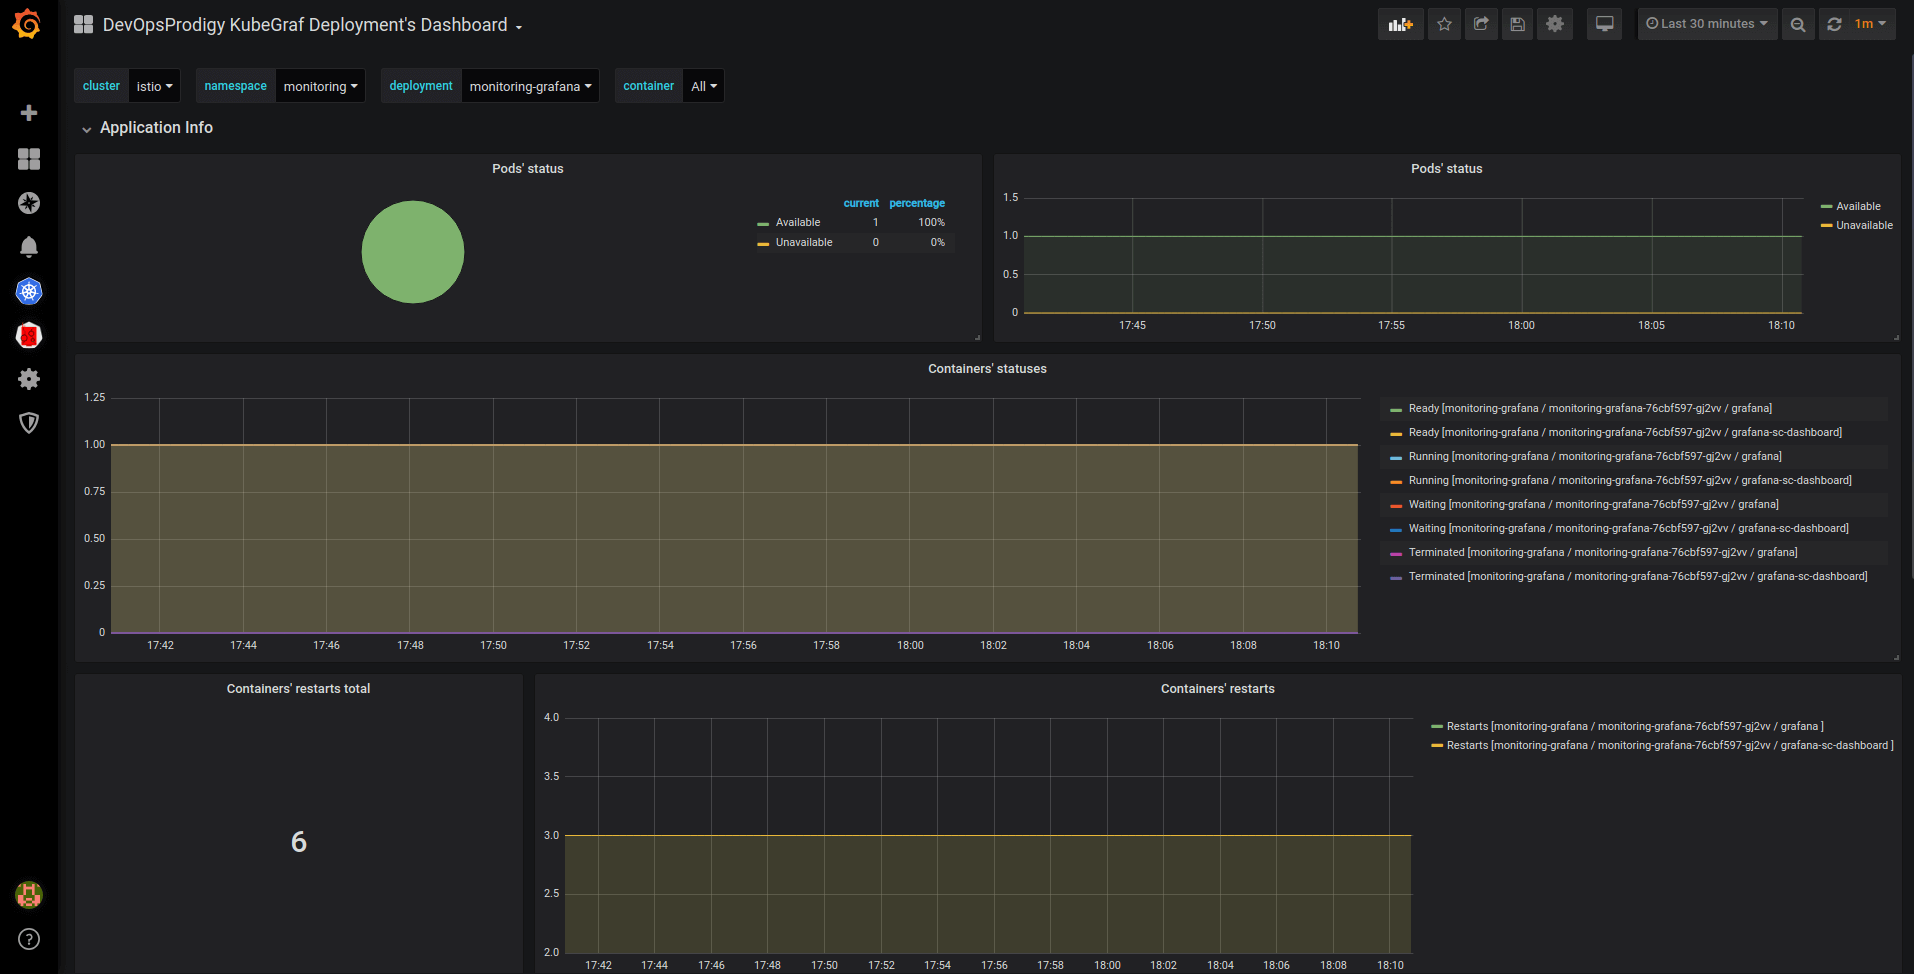
Pic. 6: Deployment dashboard
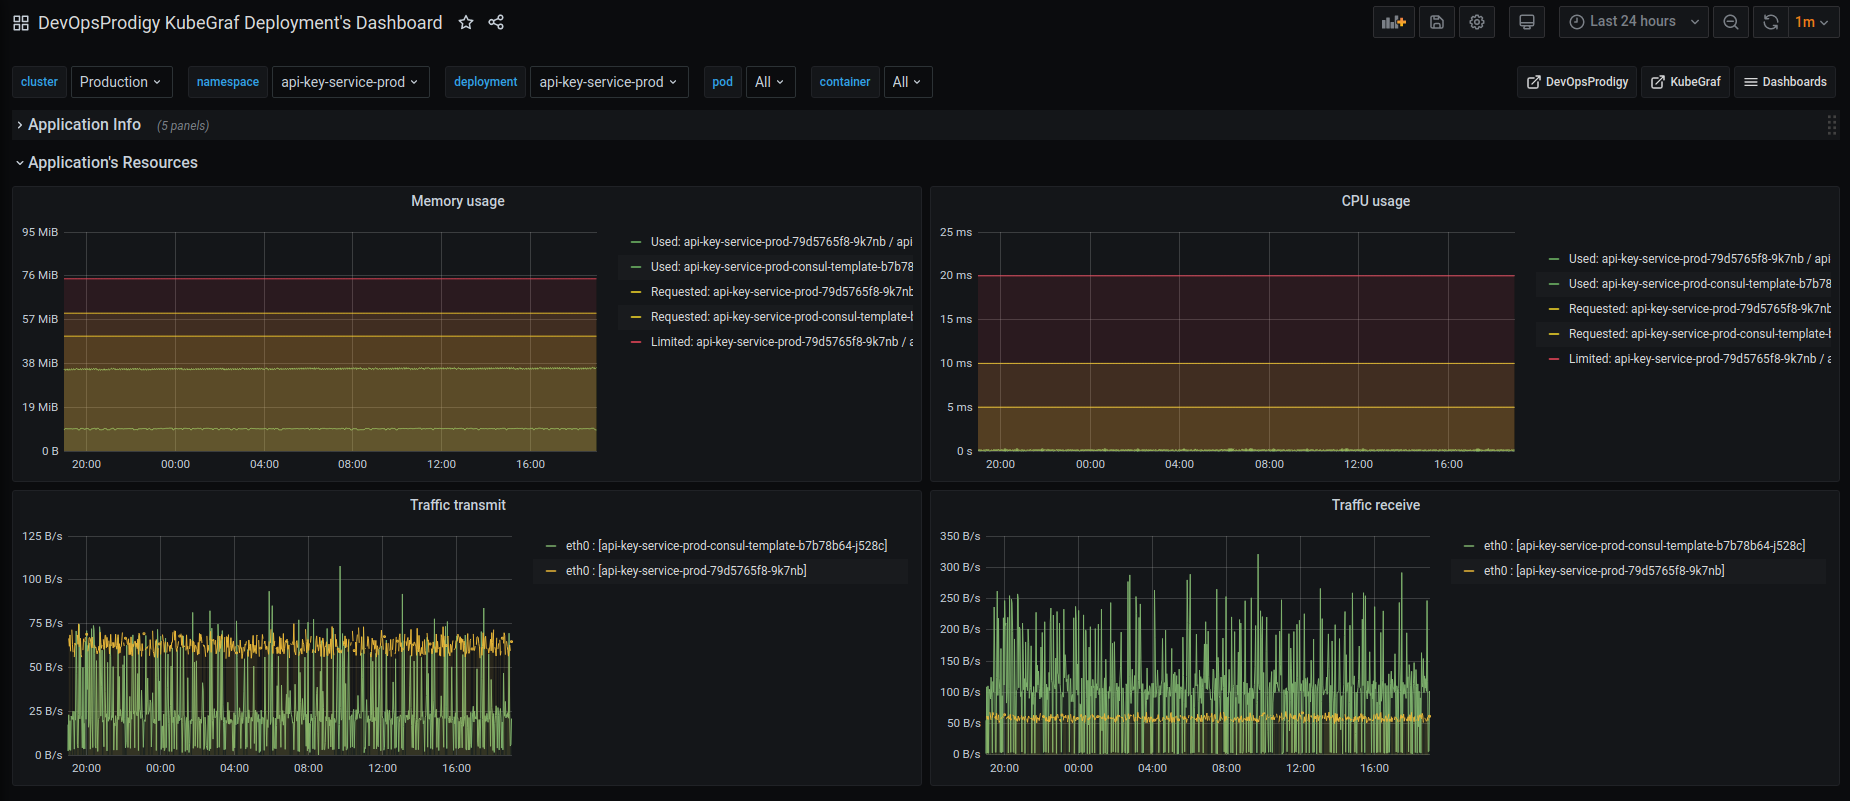
Pic. 7: Deployment dashboard
- statefulsets dashboard
- daemonsets dashboard
The above three dashboards show the number of available / unavailable application replicas and the status of containers in the pods of these applications, and trace containers’ restarts.
Installation
Go to the plugins directory in Grafana:
cd $GRAFANA_PATH/data/pluginsCopy the repository:
git clone https://github.com/devopsprodigy/kubegraf /var/lib/grafana/plugins/devopsprodigy-kubegraf-appand restart grafana-serveror
grafana-cli plugins install devopsprodigy-kubegraf-appand restart grafana-server.Create namespace "kubegraf" and apply Kubernetes manifests from kubernetes/ directory to give required permissions to the user
grafana-kubegraf:kubectl create ns kubegraf kubectl apply -f https://raw.githubusercontent.com/devopsprodigy/kubegraf/master/kubernetes/serviceaccount.yaml kubectl apply -f https://raw.githubusercontent.com/devopsprodigy/kubegraf/master/kubernetes/clusterrole.yaml kubectl apply -f https://raw.githubusercontent.com/devopsprodigy/kubegraf/master/kubernetes/clusterrolebinding.yaml kubectl apply -f https://raw.githubusercontent.com/devopsprodigy/kubegraf/master/kubernetes/secret.yamlCreate a
grafana-kubegrafuser private key and certificate on one of the master nodes:openssl genrsa -out ~/grafana-kubegraf.key 2048 openssl req -new -key ~/grafana-kubegraf.key -out ~/grafana-kubegraf.csr -subj "/CN=grafana-kubegraf/O=monitoring" openssl x509 -req -in ~/grafana-kubegraf.csr -CA /etc/kubernetes/pki/ca.crt -CAkey /etc/kubernetes/pki/ca.key -out /etc/kubernetes/pki/grafana-kubegraf.crt -CAcreateserialCopy /etc/kubernetes/pki/grafana-kubegraf.crt to all other master nodes.
or
Get the token
kubectl get secret grafana-kubegraf-secret -o jsonpath={.data.token} -n kubegraf | base64 -dGo to /configuration-plugins in Grafana and click on the plugin. Then click “enable”.
Go to the plugin and select “create cluster”.
Enter the settings of http-access to the Kubernetes api server:
- Kubernetes master's url from
kubectl cluster-info - Enter the certificate and key from step #4 "TLS Client Auth" section Or The token from step #4 in "Bearer token access" section
- Kubernetes master's url from
Open the “additional datasources” drop-down list and select the prometheus that is used in this cluster.
Grafana Cloud Free
- Free tier: Limited to 3 users
- Paid plans: $55 / user / month above included usage
- Access to all Enterprise Plugins
- Fully managed service (not available to self-manage)
Self-hosted Grafana Enterprise
- Access to all Enterprise plugins
- All Grafana Enterprise features
- Self-manage on your own infrastructure
Installing DevOpsProdigy KubeGraf on Grafana Cloud:
Installing plugins on a Grafana Cloud instance is a one-click install; same with updates. Cool, right?
Note that it could take up to 1 minute to see the plugin show up in your Grafana.
Installing plugins on a Grafana Cloud instance is a one-click install; same with updates. Cool, right?
Note that it could take up to 1 minute to see the plugin show up in your Grafana.
Installing plugins on a Grafana Cloud instance is a one-click install; same with updates. Cool, right?
Note that it could take up to 1 minute to see the plugin show up in your Grafana.
Installing plugins on a Grafana Cloud instance is a one-click install; same with updates. Cool, right?
Note that it could take up to 1 minute to see the plugin show up in your Grafana.
Installing plugins on a Grafana Cloud instance is a one-click install; same with updates. Cool, right?
Note that it could take up to 1 minute to see the plugin show up in your Grafana.
Installing plugins on a Grafana Cloud instance is a one-click install; same with updates. Cool, right?
Note that it could take up to 1 minute to see the plugin show up in your Grafana.
Installing plugins on a Grafana Cloud instance is a one-click install; same with updates. Cool, right?
Note that it could take up to 1 minute to see the plugin show up in your Grafana.
For more information, visit the docs on plugin installation.
Installing on a local Grafana:
For local instances, plugins are installed and updated via a simple CLI command. Plugins are not updated automatically, however you will be notified when updates are available right within your Grafana.
1. Install the Application
Use the grafana-cli tool to install DevOpsProdigy KubeGraf from the commandline:
grafana-cli plugins install The plugin will be installed into your grafana plugins directory; the default is /var/lib/grafana/plugins. More information on the cli tool.
Alternatively, you can manually download the .zip file for your architecture below and unpack it into your grafana plugins directory.
Alternatively, you can manually download the .zip file and unpack it into your grafana plugins directory.
2. Enable it
Next, log into your Grafana instance. Navigate to the Plugins section, found in your Grafana main menu.
Click the Apps tabs in the Plugins section and select the newly installed app.
To enable the app, click the Config tab. Follow the instructions provided with the application and click Enable. The app and any new UI pages are now accessible from within the main menu, as designed by the app creator.
If dashboards have been included with the application, they will attempt to be automatically installed. To view the dashboards, re-import or delete individual dashboards, click the Dashboards tab within the app page.
1.5.2 (2021-03-18)
Bug Fixes
- Fix the memory usage metrics of pods on all dashboards and static pages #56
- Fix the compatibility with new versions of kube-state-metrics #55
1.5.1 (2021-03-02)
Bug Fixes
- Fix the issue about that only Admin can see clusters' list #54
1.5.0 (2020-12-16)
New Features
- Indicate when limits or requests are not setup for application
- Add cpu/memory limits of containers to Nodes' overview page
- Indicate cpu/memory usage of pod depending on the requests & limits on Nodes' overview page
- Add cpu/memory limits of containers to deployments/statefulsets/daemonsets/pods dashboards
- Hide empty namespaces on deployments/statefulsets/daemonsets dashboards
- Add NAMESPACE for k8s-manifests #44
- Sort alerts via priority
- Little navigations improvements
- Add hide-button for alerts' table
Bug Fixes
- Compatibility with Grafana >= 7.3.* #48
- Show memory/cpu usage of pod on pod's dashboard #41
- Fix white theme on new versions of Grafana
- Fix legends on all dashboards
1.4.2 (2020-07-13)
Bug Fixes
1.4.1 (2020-06-19)
Bug Fixes
- Fix integration nodes' metrics with different node-exporter installations
1.4.0 (2020-05-13)
New Features
- Add integrations with node-exporter-full-dashboard
- Add server' stat to nodes-overview page
- Redesign of applications-overview page
Bug Fixes
- Disks operations' legend in different dashboards
- Improve compatibility with MacOS
- Compatibility with Grafana 6.6.* , 6.7.* , 7.0.*
- Fix orgid on dashboards' links
1.3.0 (2020-02-12)
New Features
- Add requested resource metrics (CPU, memory) to node's dashboard
- Add order for pods (by cpu, memory) at Nodes overview page
- Add disk metrics to dashboards
- Migrate to Webpack
- Parse error messages from Events (you need to update ClusterRole)
- Add namespaces update on static pages
- Compatibility with different metric's labels (pod/pod_name, container/container_name)
Bug Fixes
- Fix Save&Test button
- Cluster delete
1.2.0 (2019-12-20)
New Features
- Navigation improvement:
- Hide all button (for nodes and namespaces)
- Show one node or namespace (by click with ctrl)
- Summary-row in namespace section in nodes-overview page
- Add restarts to pod's resource dashboard
- Add resource graphs to deployment's, daemonset's & statefulset's dashboards
- Add sidecars' resources to pod's, deployment's, daemonset's & statefulset's dashboards
Bug Fixes
- Plugin's config link
- Node's cpu usage correct value
- Node's memory usage correct value
- N/A labels in nodes-overview page
- Compatibility with different prometheus' installations #14
- List of clusters on grafana 5.x.x
1.1.1.1 (2019-10-10)
Bug Fixes
- Grafana v6.4.x support
1.1.1 (2019-09-30)
Bug Fixes
- Bearer token access on Grafana version 5.x.x #10
- Viewer & editor modes' fix
1.1.0 (2019-09-25)
New Features
- k8s v1.16 support (Deployments, Daemonsets and Statefulsets migrate to use the apps/v1 API)
- Bearer token access (restart your grafana-server after update) #5 #4
Bug Fixes
- Node._getBytes now works with Mi #7
- Grafana v6.3.5 minor fixes (markdown, styles)
- Try-catch on http-requests
1.0.1 (2019-09-14)
Bug Fixes
- Readonly access via cert and key #6


