
Plugins 〉glpi


The glpi plugin has been deprecated and is no longer maintained.
glpi
GLPI app for Grafana
Introduction
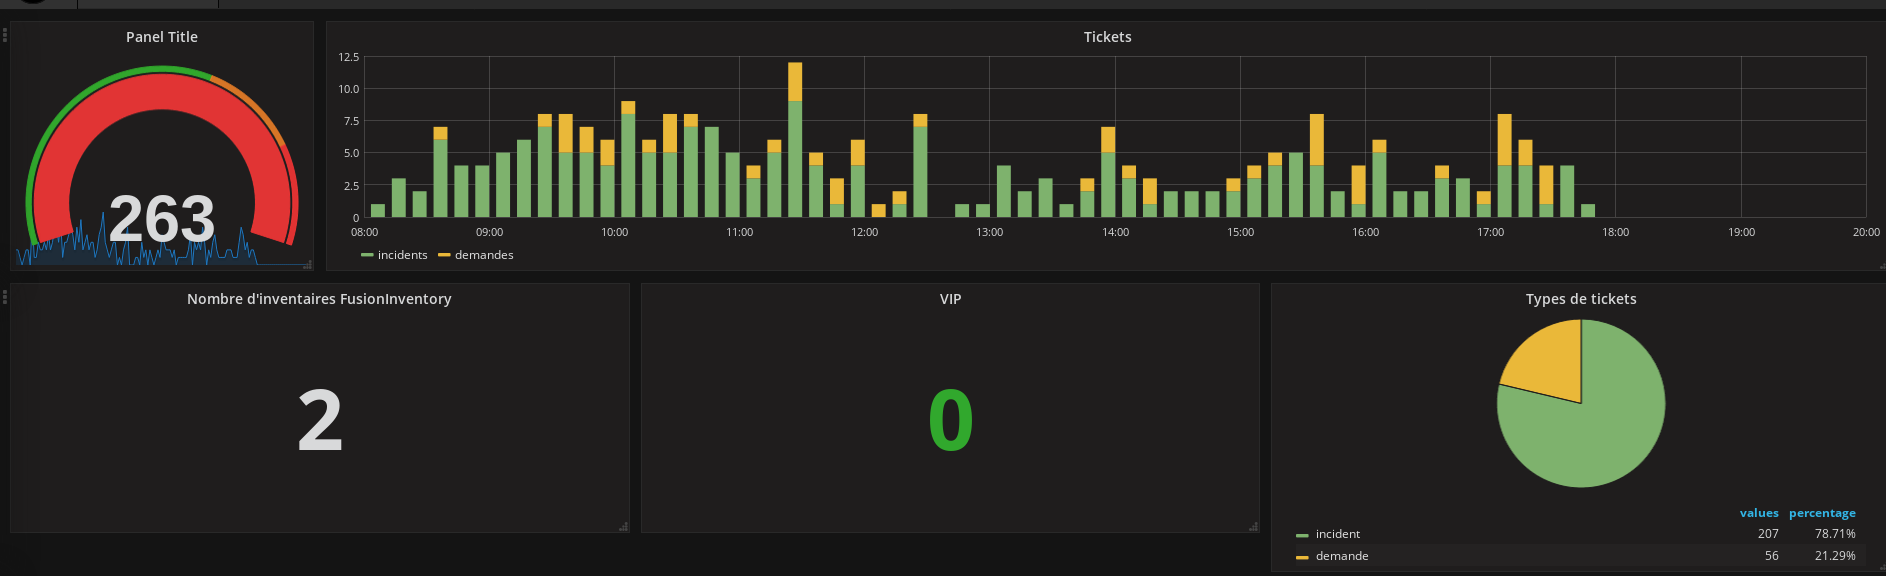
This application gets information in GLPI (Gestion Libre de Parc Informatique) thanks to the REST API added in version 9.1. You will be able to have graphs, singlestat, tables... of your data (tickets, devices, users...).
screenshot
This is an example:
Datasource
For the GLPI datasource, you will need:
- the URL of the GLPI API (like http://127.0.0.1/glpi/apirest.php)
- the App-token, you can generate and get it in GLPI in the menu Setup > General > API
- the User token, you can generate and get it in the user account/preferences panel in GLPI (named API Token)
- In the menu Setup > General > API, Enable Rest API and Enable login with external
GLPI Webserver
On your GLPI webserver, you need active the CORS. Documentation about CORS
Apache
Header set Access-Control-Allow-Origin "*"
Header set Access-Control-Allow-Methods "GET, POST, OPTIONS, PUT, DELETE"
Header set Access-Control-Allow-Credentials true
Header set Access-Control-Allow-Headers "X-Requested-With, Content-Type, Origin, Authorization, Accept, Client-Security-Token, Accept-Encoding, App-Token, Session-Token"
NGINX
more_set_headers 'Access-Control-Allow-Origin: *';
more_set_headers 'Access-Control-Allow-Methods: GET, POST, OPTIONS, PUT, DELETE';
more_set_headers 'Access-Control-Allow-Credentials: true';
more_set_headers 'Access-Control-Allow-Headers: Origin,Content-Type,Accept,Authorization,App-Token,Session-Token';
Dashboard
You can get a simple dashboard here

Table panel
Create a new Table panel and then edit the panel. Select the GLPI datasource and add a new Query in the panel Metrics.
The configuration will require:
- Query: do a search into GLPI and copy paste the URL here
- Alias: the alias name of this query, it will appear in the panel
- Timerange based on: define on which GLPI date field you will get the data. This field is used by the timerange defined in top of grafana
- Count element: if the panel is a Table, select yes, otherwise keep to no
- Is it a table?: to display the query result as a Table, check this option else uncheck.
When Is it a table is checked, the query result will be displayed as a table and you can define up to 6 columns to be displayed. For each column in the table, select the query result field and the name of the column.
When Is it a table is not checked, the query result is considered as a usual Grafana timeseries and it will displayed as is. See Grafana table panel for more information.
Single stat panel
Problem with server access
If you have the message: There isn't an active API client matching your IP address in the configuration (ip, ip) where you have 2 IPs and the same, you need apply a patch into GLPI:
diff --git a/inc/api.class.php b/inc/api.class.php
index 3ae2966ce..a4a18dc9e 100644
--- a/inc/api.class.php
+++ b/inc/api.class.php
@@ -105,6 +105,10 @@ abstract class API extends CommonGLPI {
   // retrieve ip of client
   $this->iptxt = Toolbox::getRemoteIpAddress();
 $spl = explode(',', $this->iptxt);
 if (count($spl) > 1) {
    $this->iptxt = $spl[0];
 }
 $this->ipnum = (strstr($this->iptxt, ':')===false ? ip2long($this->iptxt) : '');

 // check ip access
Bugs / features
If you have a bug repoort or request feature, you can open issues in the github repository
Professional support
Do you need professional support, training, others?
Please contact the DCS company / send a mail to dcs.glpi@dcsit-group.com
Changelog
1.3.0
- add Apache / NGINX configuration in the readme
- add more instructions in the readme to configure API into GLPI
- add link of a user dashboard in the readme
- add the patch of GLPI in the readme when use the datasource in mode
server - fix PHP timezone in the datasource
- update dependencies (and so fix some vulnerabilities)
- fix a bug in number elements displayed in the singlestat panel
1.2.0
- allow to get a query count without selecting a date field
- fix #16: no more need to force grunt for rebuilding
- fix #17: fix error when receiving integer values not formated in strings
- fix some typos
- dev: allow to set/unset browser console log
1.1.0
- compatibility with GLPI 9.2
- autofill the field
Timerange based onin the query - when adding a new query, add by default a ticket query instead
undefined - get correct values in the tooltip when the mouse is hovering the graph
- enhance error message when defining the datasource
- add the possibility to have the count of elements by hour of the day with the panel
histogram
1.0.0
First version
Grafana Cloud Free
- Free tier: Limited to 3 users
- Paid plans: $55 / user / month above included usage
- Access to all Enterprise Plugins
- Fully managed service (not available to self-manage)
Self-hosted Grafana Enterprise
- Access to all Enterprise plugins
- All Grafana Enterprise features
- Self-manage on your own infrastructure
Installing glpi on Grafana Cloud:
Installing plugins on a Grafana Cloud instance is a one-click install; same with updates. Cool, right?
Note that it could take up to 1 minute to see the plugin show up in your Grafana.
Installing plugins on a Grafana Cloud instance is a one-click install; same with updates. Cool, right?
Note that it could take up to 1 minute to see the plugin show up in your Grafana.
Installing plugins on a Grafana Cloud instance is a one-click install; same with updates. Cool, right?
Note that it could take up to 1 minute to see the plugin show up in your Grafana.
Installing plugins on a Grafana Cloud instance is a one-click install; same with updates. Cool, right?
Note that it could take up to 1 minute to see the plugin show up in your Grafana.
Installing plugins on a Grafana Cloud instance is a one-click install; same with updates. Cool, right?
Note that it could take up to 1 minute to see the plugin show up in your Grafana.
Installing plugins on a Grafana Cloud instance is a one-click install; same with updates. Cool, right?
Note that it could take up to 1 minute to see the plugin show up in your Grafana.
Installing plugins on a Grafana Cloud instance is a one-click install; same with updates. Cool, right?
Note that it could take up to 1 minute to see the plugin show up in your Grafana.
For more information, visit the docs on plugin installation.
Installing on a local Grafana:
For local instances, plugins are installed and updated via a simple CLI command. Plugins are not updated automatically, however you will be notified when updates are available right within your Grafana.
1. Install the Application
Use the grafana-cli tool to install glpi from the commandline:
grafana-cli plugins install The plugin will be installed into your grafana plugins directory; the default is /var/lib/grafana/plugins. More information on the cli tool.
Alternatively, you can manually download the .zip file for your architecture below and unpack it into your grafana plugins directory.
Alternatively, you can manually download the .zip file and unpack it into your grafana plugins directory.
2. Enable it
Next, log into your Grafana instance. Navigate to the Plugins section, found in your Grafana main menu.
Click the Apps tabs in the Plugins section and select the newly installed app.
To enable the app, click the Config tab. Follow the instructions provided with the application and click Enable. The app and any new UI pages are now accessible from within the main menu, as designed by the app creator.
If dashboards have been included with the application, they will attempt to be automatically installed. To view the dashboards, re-import or delete individual dashboards, click the Dashboards tab within the app page.