
Plugins 〉Chartwerk

Registration is open! Join us in a city near you to preview new LGTM Stack features, attend technical deep dive sessions, and leave with what you need to advance your observability roadmap.
Grafana Cloud
- Grafana, of course
- 10k series Prometheus metrics
- 50 GB logs
- 50 GB traces
- 2,232 app o11y host hours
- ...and more
Create free account
No credit card needed, ever.
Introducing
Frontend Observability
Our hosted service for real user monitoring. Gain precise, end-to-end user insights.
- Reduce metric cardinality by 30-50%
- Pay only for metrics you use
- Centralize control over your data in Grafana Cloud
Gain insight into unused metrics and optimize metric cardinality with the new cardinality management dashboards and Adaptive Metrics
Chicago, Mar 11
Grafana Cloud demos. Community success stories. Advance your observability roadmap.
Join Us


Panel
community
Chartwerk

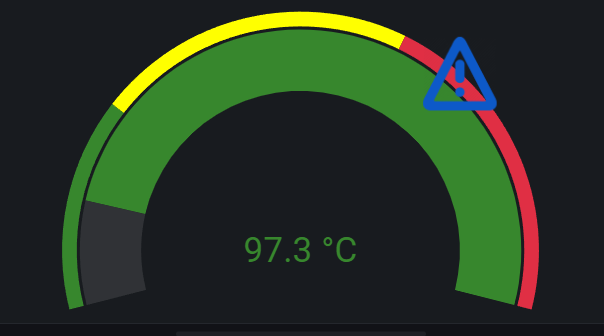
Grafana Chartwerk Panel (beta)
![]()
Grafana Chartwerk Panel renders metrics using Chartwerk libraries. For now, it can render as Gauge. We are working on adding new visualizations.
Features
- 3 types of visualizations:
- Gauge
- Line Chart (coming soon)
- Bar Chart (coming soon)
- Gauge: dynamic thresholds and min / max
- Gauge: conditional icons displaying
- Gauge: reversed direction
How to use
- Create a new panel and select Chartwerk as the visualization
- Add queries with unique aliases
- Go to the Options Tab and setup panel:
- Choose visualization type
- Select metric in the Value -> Metric dropdown (by default, the first metric is used)
Options [Gauge]
- Visualization:
- Pod: option to select chart type
- Value:
- Metric: select metric query from dropdown
- Extemum:
- Min:
- type number for static minimum value OR
- enable "Use metric" toggle switch to select metric as minimun
- default value: 0
- Max:
- type number for static maximum OR
- enable "Use metric" toggle switch to select metric as maximum
- default value: maximum of metric query
- Min:
Demo
see demo