Plugins 〉Chartwerk


Chartwerk

Grafana Chartwerk Panel (beta)
![]()
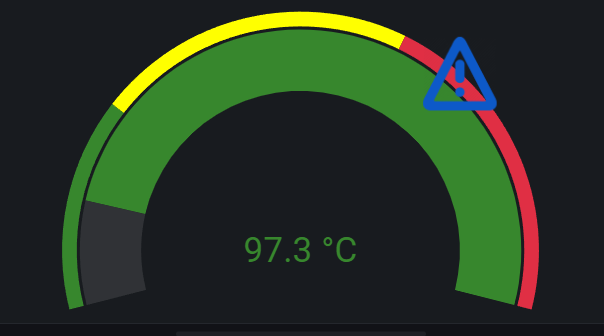
Grafana Chartwerk Panel renders metrics using Chartwerk libraries. For now, it can render as Gauge. We are working on adding new visualizations.
Features
- 3 types of visualizations:
- Gauge
- Line Chart (coming soon)
- Bar Chart (coming soon)
- Gauge: dynamic thresholds and min / max
- Gauge: conditional icons displaying
- Gauge: reversed direction
How to use
- Create a new panel and select Chartwerk as the visualization
- Add queries with unique aliases
- Go to the Options Tab and setup panel:
- Choose visualization type
- Select metric in the Value -> Metric dropdown (by default, the first metric is used)
Options [Gauge]
- Visualization:
- Pod: option to select chart type
- Value:
- Metric: select metric query from dropdown
- Extemum:
- Min:
- type number for static minimum value OR
- enable "Use metric" toggle switch to select metric as minimun
- default value: 0
- Max:
- type number for static maximum OR
- enable "Use metric" toggle switch to select metric as maximum
- default value: maximum of metric query
- Min:
Demo
see demo
Grafana Cloud Free
- Free tier: Limited to 3 users
- Paid plans: $55 / user / month above included usage
- Access to all Enterprise Plugins
- Fully managed service (not available to self-manage)
Self-hosted Grafana Enterprise
- Access to all Enterprise plugins
- All Grafana Enterprise features
- Self-manage on your own infrastructure
Install on Grafana Cloud
Plugins can be installed directly from within your Grafana instance or automated using the Cloud API or Terraform.
Learn more about plugin installationMarketplace plugins
This is a paid plugin developed by a marketplace partner. To purchase an entitlement, sign in first, then fill out the contact form.
Get this plugin
This is a paid for plugin developed by a marketplace partner. To purchase entitlement please fill out the contact us form.
What to expect:
- Grafana Labs will reach out to discuss your needs
- Payment will be taken by Grafana Labs
- Once purchased the plugin will be available for you to install (cloud) or a signed version will be provided (on-premise)
Thank you! We will be in touch.
For more information, visit the docs on plugin installation.
Installing on a local Grafana:
For local instances, plugins are installed and updated via a simple CLI command. Plugins are not updated automatically, however you will be notified when updates are available right within your Grafana.
1. Install the Panel
Use the grafana-cli tool to install Chartwerk from the commandline:
grafana-cli plugins install The plugin will be installed into your grafana plugins directory; the default is /var/lib/grafana/plugins. More information on the cli tool.
Alternatively, you can manually download the .zip file for your architecture below and unpack it into your grafana plugins directory.
Alternatively, you can manually download the .zip file and unpack it into your grafana plugins directory.
2. Add the Panel to a Dashboard
Installed panels are available immediately in the Dashboards section in your Grafana main menu, and can be added like any other core panel in Grafana.
To see a list of installed panels, click the Plugins item in the main menu. Both core panels and installed panels will appear.
Changelog
0.5.1
Added
- Gauge: Additional Metric
Fixed
- Repeatable option link issue
- Bar-pod hover error