
Plugins 〉Datatable Panel


Datatable Panel


Grafana Datatable Panel

![]()

![]()
![]()
This panel plugin provides a Datatables.net table panel for Grafana 10.x/11.x/12.x.
This table includes features for metric thresholds, value mapping, aggregations, and per-cell filtering.
Features
- Multiple options for row and cell thresholds
- Scrolling and Paging options with horizontal scroll as needed
- Search and highlight cell content
- Filters per column
- Click through urls based on cell data
- URLs inside row text can be "clicked"
- Rows can have a click-through URL
- Multi-Column Sorting
- Horizontal scrolling enabled when columns are wider than panel
Screenshots
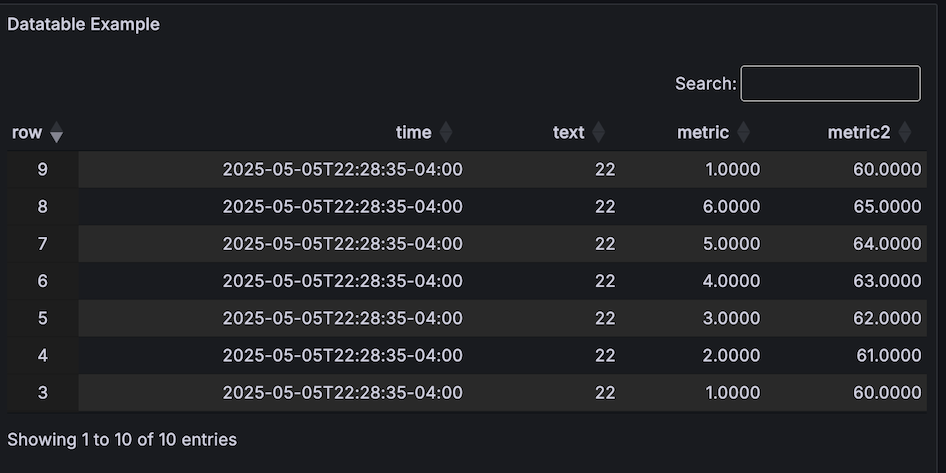
Scrolling Enabled - Dark Theme
By default the panel enables scrolling for the data, use the Enable Paging option to use the paging method.
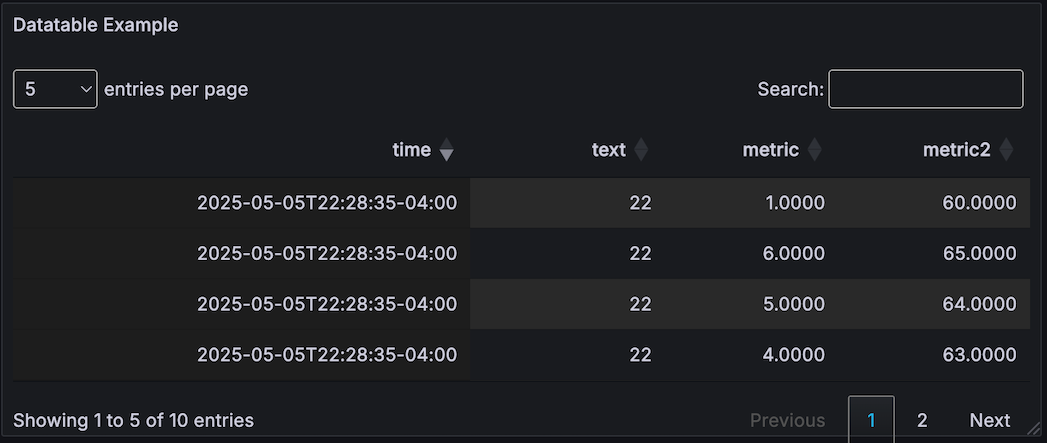
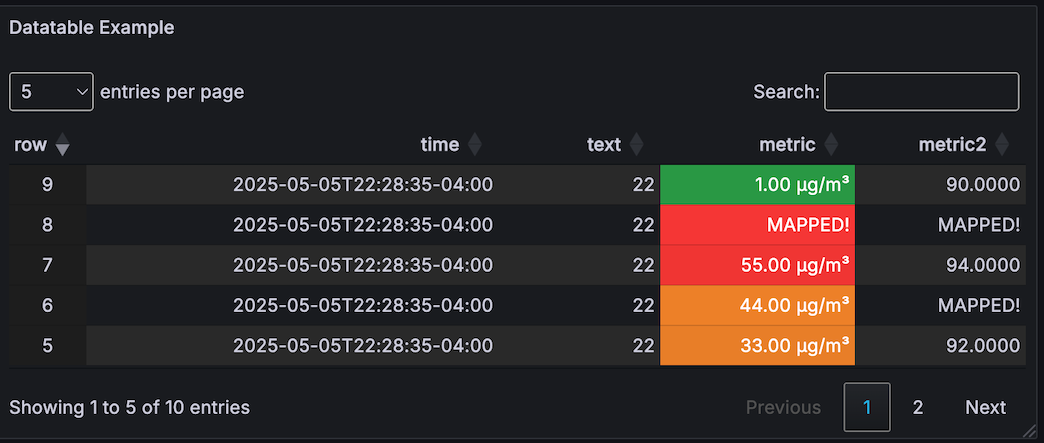
Paging Enabled - Dark Theme
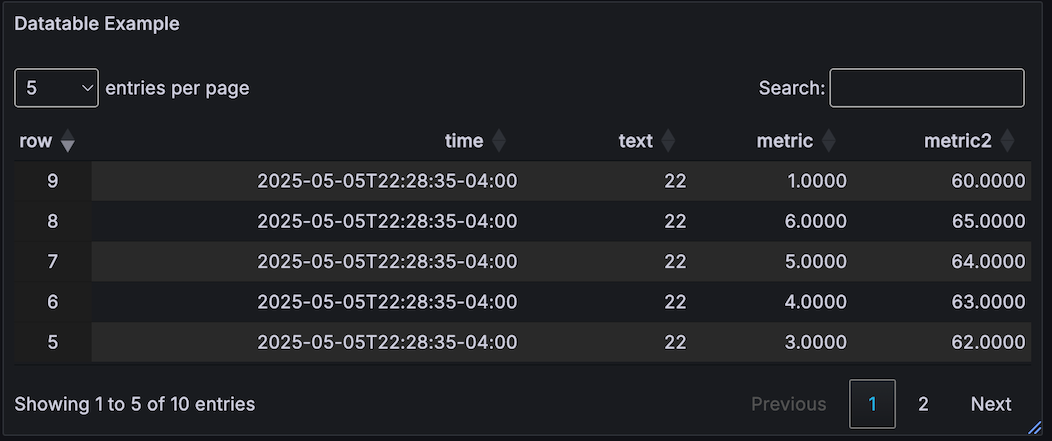
Paging with Numbered Rows and Compact Style - Dark Theme
Thresholds - Dark Theme
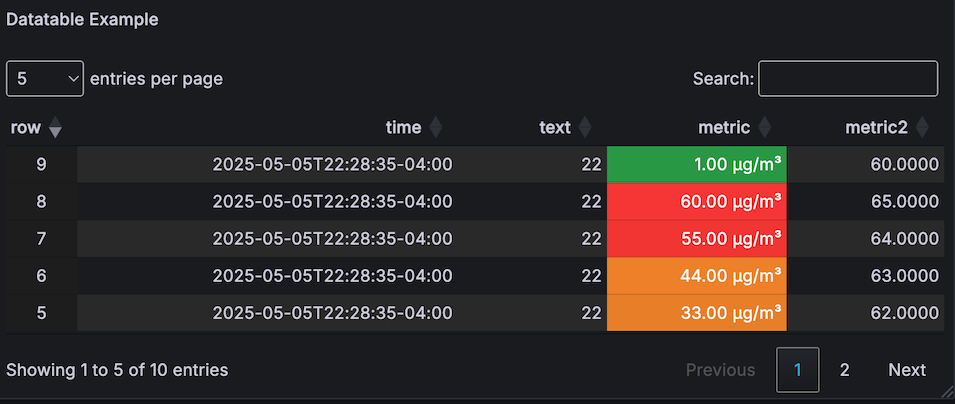
Value Maps and Range Maps - Dark Theme
Value and Range Maps can be applied to modify the cell visual text, and threshold applied to the metric value that was mapped.
Options
There are multiple sections for configuring the data in the editor.
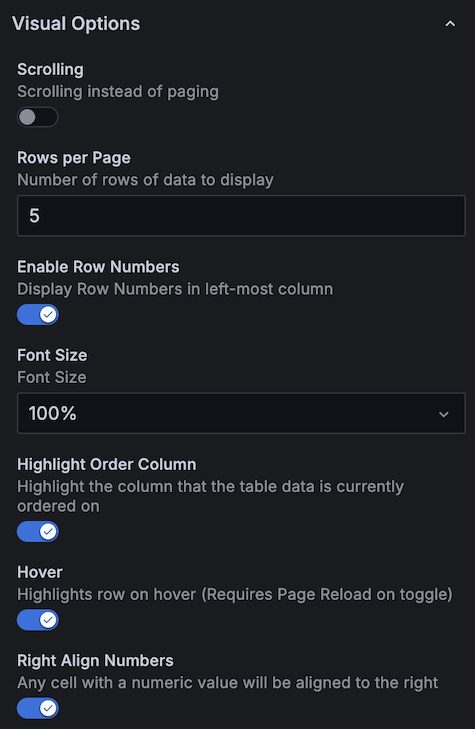
Visual Options
Scrolling and Paging Modes
Scrolling Mode
When scrolling is enabled, the table supports vertical and horizontal scrolling of the data.
Paging Mode
When scrolling is disabled, the panel switches to paging mode with controls that will skip through data at specific intervals.
Entries per page
The number of rows displayed can be set with the entries per page selector at the top left of the panel.
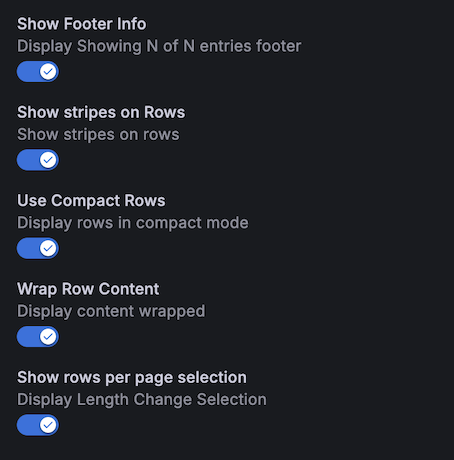
Show rows per page
Show rows per page selection
Other options
| Option | Meaning |
|---|---|
| Enable Row Numbers | Adds left column showing row numbers |
| Font Size | Adjust font size of text in table |
| Highlight Order Column | When the column order is modified, this highlights it |
| Hover | Highlight row under mouse |
| Right Align Numbers | All cells with numbers will be aligned to the right |
| Show Footer Info | Displays number of rows |
| Show Stripes on Rows | Alternating stripes for even/odd rows |
| Use Compact Rows | Reduce space used to display data |
| Wrap Row Content | Auto-wraps text to fit in column width |
Search Options
Data Options
Fill Empty Data with Custom Value
When there is no data available for a cell, a custom value can be substituted with this setting enabled.
Transform
Selects how to convert the source data to a compatible panel format.
| Transform Type | |
|---|---|
| Timeseries to Columns | This is the typical method |
| Timeseries to Rows | Converts to rows (wide data) |
| Timeseries Aggregations | Provides selectable aggregations for metrics |
| Last/Mean/Min/Max etc | |
| JSON Data | Converts JSON to table format |
| Table | Generic table format to datatable |
Column Aliasing
Override the name displayed for a column. Each column can be selected and an alias provided.
Column Width Hints
Provide a width "hint" in percentage or pixels ( 100px or 10% ). Note: The table will autosize as needed, but will use the hints provided.
Column Sorting
Sort table by specified column number in ascending/descending order. Multiple sorting options can be applied.
NOTE: When these sorting rules are in place, the table cannot be manually sorted.
Column Styles
There are four styles that can be applied to the datatable.
NOTE: The first style that matches "wins" and all other style matches are ignored.
Support for multiple styles is a future enhancement, where a string and a metric style can be applied to the same cell.
Date Style
This lets you convert "unix epoch" numerical timestamps to a readable format.
String Style
Matching column names can have a clickthrough applied to them.
Once the url is specified, additional options are displayed that provide additonal "macros."
Additional you can specify if the URL should be open in a new tab or new window, and specify a custom target.
Pattern Macros
Split By RegEx - the cell content of the matching column is split by this regex which can then be used within the URL.
For example, a column named text with a RegEx '/text/', and a split by as space /\s/. The content of the cell split can be referenced by:
$__pattern_N - where N is the position of the split
Cell Macros
$__cell_N - the content of cell N within the same row
$__cell - the content of the current cell
Time Macros
$__keepTime - provides the from=now-24h&to=now time option of the dashboard
$__from - provides the raw from time of the dashboard
$__to - provides the raw to time of the dashboard
Example URLs with Macros
Keep Time
https://myinstance.grafana.net/d/dashboard-example?$__keepTime
expands to:
https://myinstance.grafana.net/d/dashboard-example?from=now-24h&to=now
Use specific cell as template variable
https://myinstance.grafana.net/d/dashboard-example?$__keepTime&var-SERVER=$__cell_2
expands to:
https://myinstance.grafana.net/d/dashboard-example?from=now-24h&to=now&var-SERVER=ServerA
Use current cell as template variable
https://myinstance.grafana.net/d/dashboard-example?$__keepTime&var-SERVER=$__cell
expands to (the current cell contains Server B), params are encoded:
https://myinstance.grafana.net/d/dashboard-example?$__keepTime&var-SERVER=Server%20B
Use split by regex pattern as template variable
https://myinstance.grafana.net/d/dashboard-example?$__keepTime&var-SERVER=$__pattern_2
Where cell content contains Error on ServerC, and split by is /\s/
expands to:
https://myinstance.grafana.net/d/dashboard-example?$__keepTime&var-SERVER=ServerC
Hidden Style
Matching columns will be "hidden" from the table
Metric Style
The metric style enables the ability to show thresholds on a per-row/per-cell basis.
Metric/Regex: Specify the metric or RegEx pattern to match multiple metrics. This is populated with the available columns. Decimals: Set the number of decimals to be displayed Unit Format: Set the unit to be applied to the metric
Thresholds
These thresholds are the same as polystat, where multiple ranges can be specified and custom colors assigned.
Thresholds are expected to be sorted by ascending value, where
T0 = lowest decimal value, any state
TN = highest decimal value, any state
Initial state is set to "ok"
A comparison is made using "greater than or equal to" against the value
If value >= thresholdValue state = X
Comparisons are made in reverse order, using the range between the Nth (inclusive) threshold and N+1 (exclusive)
  InclusiveValue = T(n).value
  ExclusiveValue = T(n+1).value
When there is no n+1 threshold, the highest value threshold T(n), a simple inclusive >= comparison is made
Example 1: (typical linear)
    T0 - 5, ok
    T1 - 10, warning
    T2 - 20, critical
  Value >= 20 (Value >= T2)
  10 <= Value < 20  (T1 <= Value < T2)
  5 <= Value < 10   (T0 <= Value < T1)
Example 2: (reverse linear)
    T0 - 50, critical
    T1 - 90, warning
    T2 - 100, ok
  Value >= 100
  90 <= value < 100
  50 <= value < 90
Example 3: (bounded)
    T0 - 50, critical
    T1 - 60, warning
    T2 - 70, ok
    T3 - 80, warning
    T4 - 90, critical
    Value >= 90
    80 <= Value < 90
    70 <= Value < 80
    60 <= Value < 70
    50 <= Value < 60
The "worst" state is returned after checking every threshold range
Row-based threshold coloring
"Row" coloring uses the "highest" threshold color of all columns
Cell based threshold background coloring
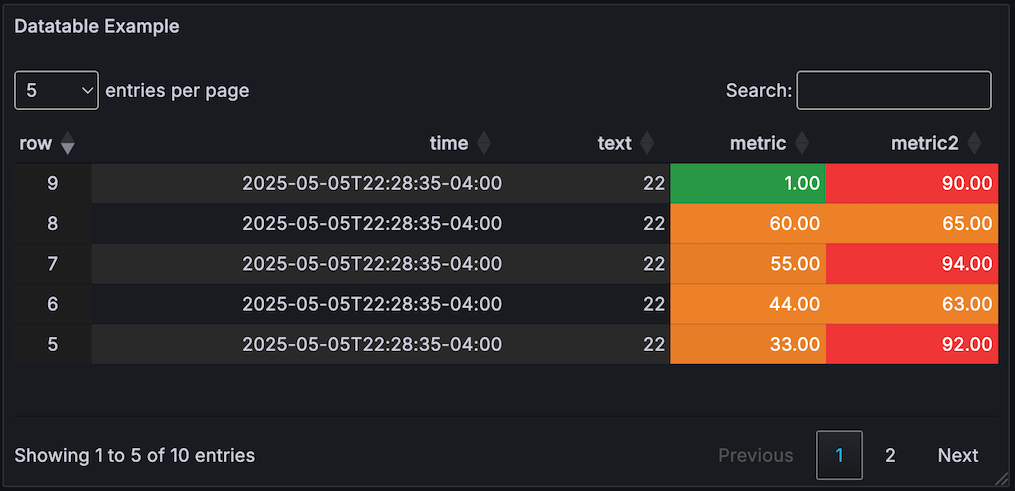
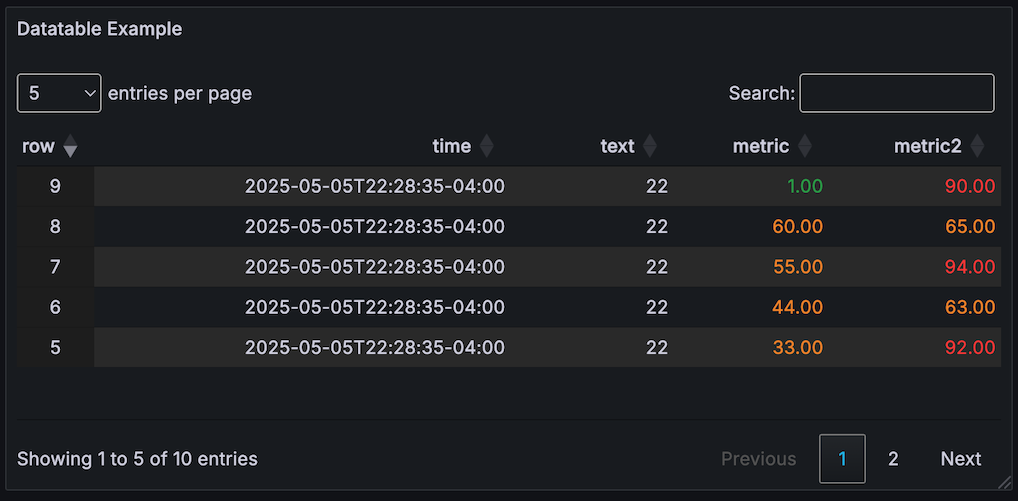
Cell based threshold value coloring
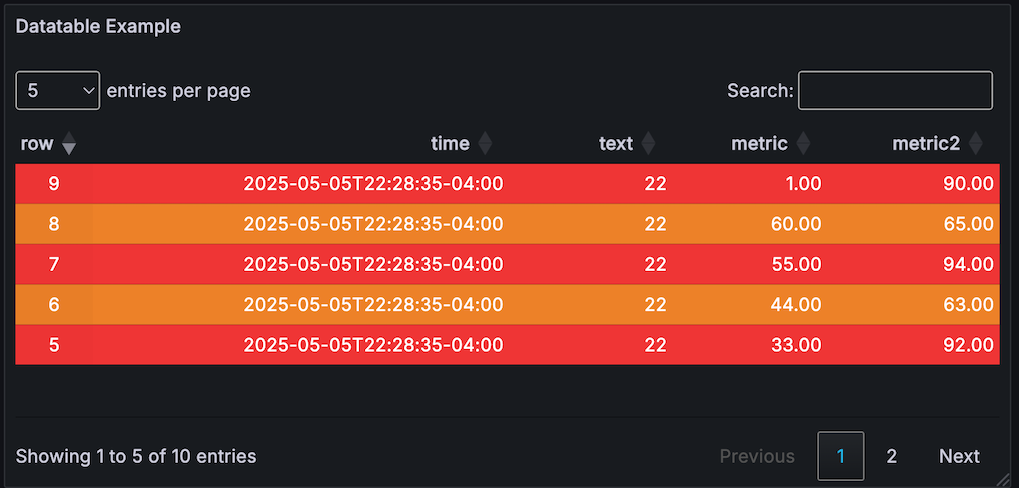
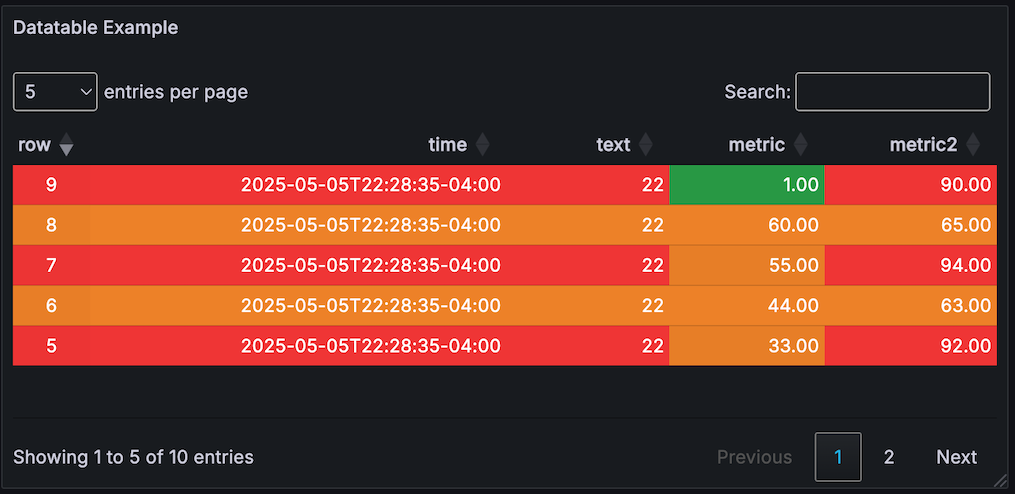
RowColumn threshold coloring
This option sets the row color to the "highest" threshold found for all cells in row.
It also sets the color for each cell according to the threshold (you can tell which columns actually exceeded the threshold).
This means - a row can have an overall color, with each cell indicating it's real threshold color.
Acknowledgements
This panel is based on the "Table" panel by GrafanaLabs
Special thanks to Esteban Beltran for his help porting from Angular!
Grafana Cloud Free
- Free tier: Limited to 3 users
- Paid plans: $55 / user / month above included usage
- Access to all Enterprise Plugins
- Fully managed service (not available to self-manage)
Self-hosted Grafana Enterprise
- Access to all Enterprise plugins
- All Grafana Enterprise features
- Self-manage on your own infrastructure
Installing Datatable Panel on Grafana Cloud:
Installing plugins on a Grafana Cloud instance is a one-click install; same with updates. Cool, right?
Note that it could take up to 1 minute to see the plugin show up in your Grafana.
Warning
Plugin installation from this page will be removed in February 2026. Use the Plugin Catalog in your Grafana instance instead. Refer to Install a plugin in the Grafana documentation for more information.
Installing plugins on a Grafana Cloud instance is a one-click install; same with updates. Cool, right?
Note that it could take up to 1 minute to see the plugin show up in your Grafana.
Installing plugins on a Grafana Cloud instance is a one-click install; same with updates. Cool, right?
Note that it could take up to 1 minute to see the plugin show up in your Grafana.
Warning
Plugin installation from this page will be removed in February 2026. Use the Plugin Catalog in your Grafana instance instead. Refer to Install a plugin in the Grafana documentation for more information.
Installing plugins on a Grafana Cloud instance is a one-click install; same with updates. Cool, right?
Note that it could take up to 1 minute to see the plugin show up in your Grafana.
For more information, visit the docs on plugin installation.
Installing on a local Grafana:
For local instances, plugins are installed and updated via a simple CLI command. Plugins are not updated automatically, however you will be notified when updates are available right within your Grafana.
1. Install the Panel
Use the grafana-cli tool to install Datatable Panel from the commandline:
grafana-cli plugins install The plugin will be installed into your grafana plugins directory; the default is /var/lib/grafana/plugins. More information on the cli tool.
Alternatively, you can manually download the .zip file for your architecture below and unpack it into your grafana plugins directory.
Alternatively, you can manually download the .zip file and unpack it into your grafana plugins directory.
2. Add the Panel to a Dashboard
Installed panels are available immediately in the Dashboards section in your Grafana main menu, and can be added like any other core panel in Grafana.
To see a list of installed panels, click the Plugins item in the main menu. Both core panels and installed panels will appear.
Change Log
All notable changes to this project will be documented in this file.
[2.0.2] - 2025-05-29
- Fixes playwright tests
[2.0.1] - 2025-05-29
- Fixes loss of styles when sorting by column interactively
- Fixes crashing bug on bad data input
- Removed empty src/README.md
[2.0.0] - 2025-05-20
Ported to React, not published
[1.0.4] - 2023-09-11
- Updates for compatibility with v10.x
- Packages updated
- Signature Fixed
- Minor bug fix
- NOTE: this plugin will be migrated to React soon!
[1.0.3] - 2020-12-05
- NEW: Added mark plugin to highlight matching text in search results (from PR #98)
- NEW: Align Number to right option (default is on)
- FIX: Crash when regex formatter is empty: Issue #124
- Plugin is now signed
[1.0.2] - 2020-06-26
- NEW: column filtering option
- Sorting is working correctly now Issues: #104
- Row/Column coloring working again Issue: #100
- Formatting working (general appearance problems) Issue: #105
- Now loads with older versions of Grafana Issue: #97
- Template variables inside links can now reference other cell content of same row number (Issue: #87)
[1.0.1] - 2020-05-02
- pulled in file_export from older version of grafana for compatibility
- add dependency file-saver require my file_export
- v7 no longer suppolies isUTC setting from dashboard, test and default to false
[1.0.0] - 2020-04-21
- Added option to use orthogonal data option to sort by value and not formatted value
- Remove moment package
- Updated to use new @grafana/toolkit build process
- Packages updated
- FIX: column index sorting was wrong when row numbers set true
- FIX: light theme search area now more visible
- NEW: time macros $__from, $__to, $__keepFrom will be replaced in clickable urls
[0.0.9] - 2019-09-07
- Fix stringToJsRegex reference error
[0.0.8] - 2019-09-07
- update packages
[0.0.7] - 2019-07-26
New features/bugfixes by contributor jmp0x00, thanks!! Conversion to typescript Updated all packages CircleCI added to publishing
(previous) Changelog
| Version | Changes |
|---|---|
| 0.0.1 | first release |
| 0.0.2 | NEW: Added option for a cell or row to link to another page |
| NEW: Supports Clickable links inside table | |
| BUGFIX: Fixed missing CSS files | |
| BUGFIX: CSS files now load when Grafana has a subpath | |
| NEW: Added multi-column sorting - sort by any number of columns ascending/descending | |
| NEW: Column Aliasing - modify the name of a column as sent by the datasource | |
| NEW: Column width hints - suggest a width for a named column | |
| 0.0.3 | BUGFIX: Saving State should now work - wrong option was in the datatable constructor |
| NEW: Export options for Clipboard/CSV/PDF/Excel/Print | |
| BUGFIX: Columns from datasources other than JSON can now be aliased | |
| BUGFIX: No data now clears table (issue #5) | |
| 0.0.4 | NEW: Now autoscrolls horizontally if number of columns is wider |
| than the rendered panel (issue #6) | |
| 0.0.5 | BUGFIX: SystemJS path changes for Grafana > 4.6 |
| 0.0.6 | BUGFIX: Compatibility for v5 |
| 1.0.0 | Update packages and convert to toolkit |