Plugins 〉Mosaic


Mosaic


Mosaic Plot
![]()
Documentation can be found here
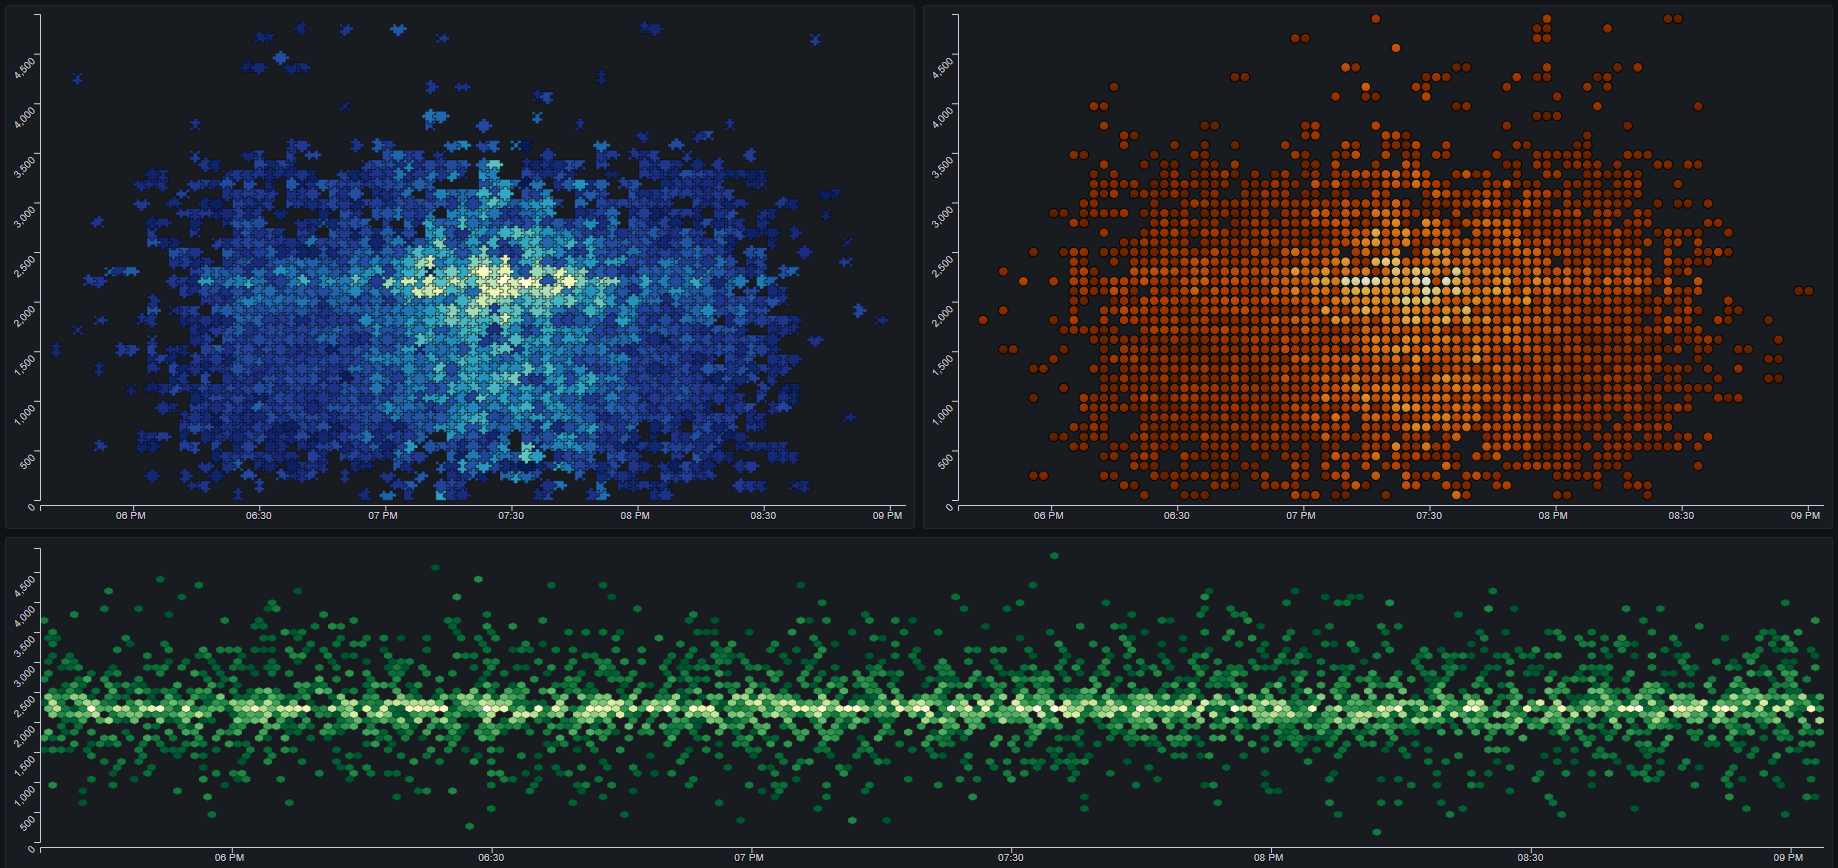
Mosaic Plot is a Grafana panel plugin for visualizing large datasets as heatmaps
Mosaic Plot differs from existing heatmap panels by providing several additional features as well as by providing many more styling options
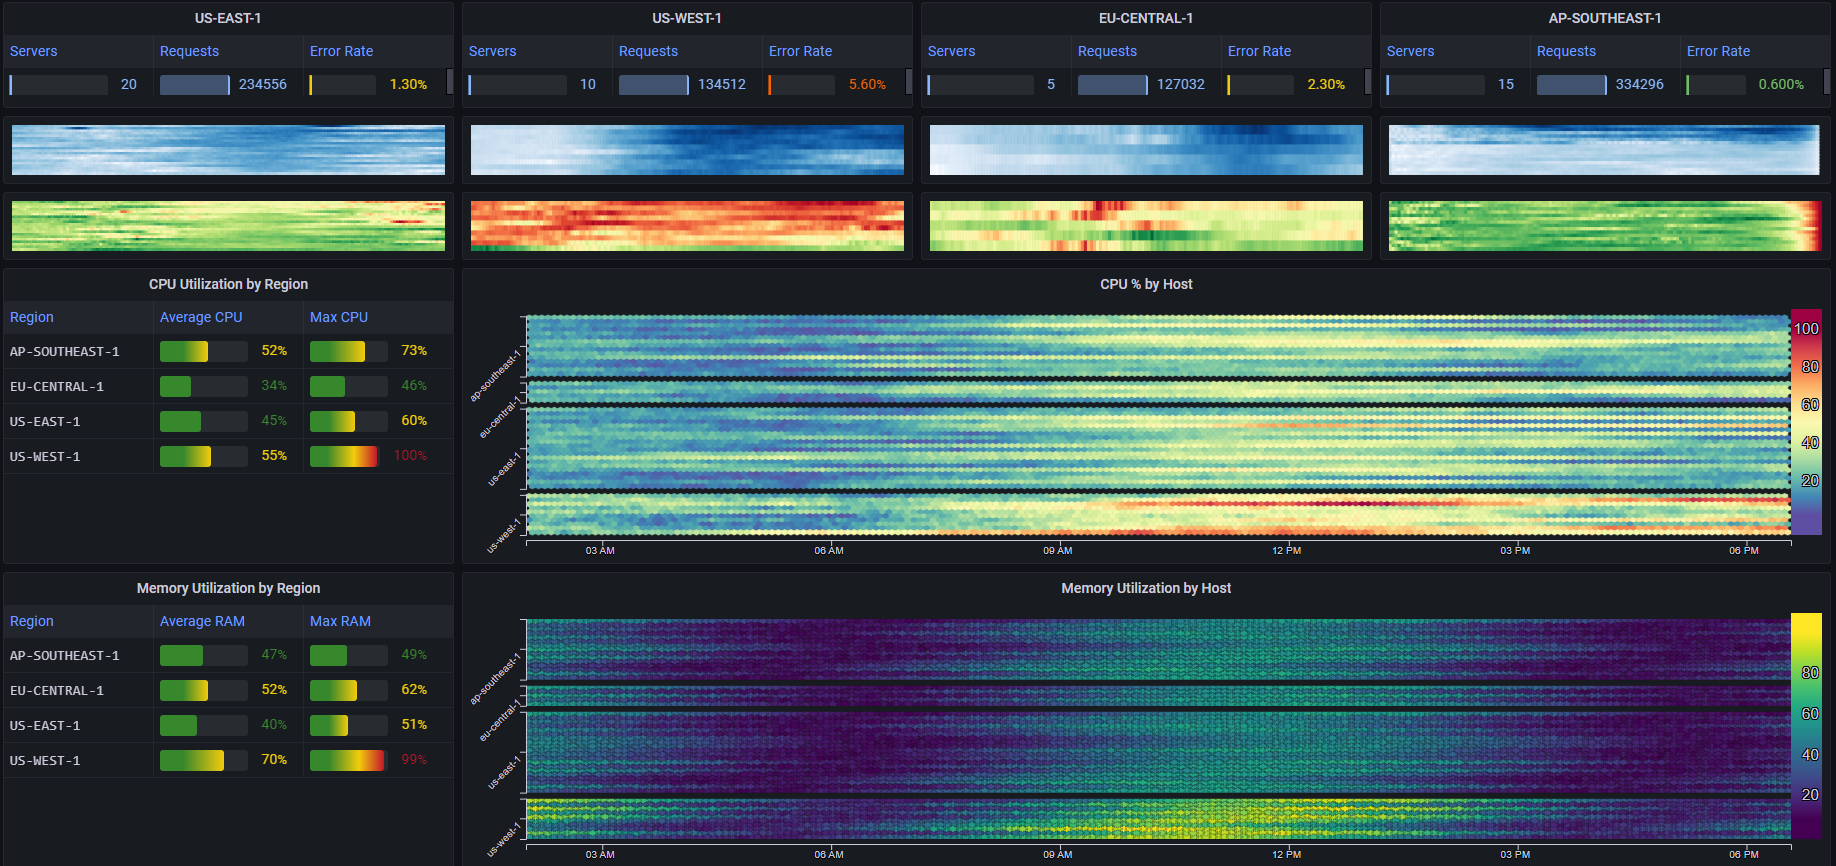
Besides visualizing regular heatmaps, Mosaic Plot can be used to plot regular timeseries data with high cardinalities in a very space-efficient manner
Mosaic Plot can be configured to be very compact, allowing a user to show a very large amount of data while taking up only a minimum porition of a dashboard's "real estate"


![]()
![]()
![]()
Grafana Cloud Free
- Free tier: Limited to 3 users
- Paid plans: $55 / user / month above included usage
- Access to all Enterprise Plugins
- Fully managed service (not available to self-manage)
Self-hosted Grafana Enterprise
- Access to all Enterprise plugins
- All Grafana Enterprise features
- Self-manage on your own infrastructure
Install on Grafana Cloud
Plugins can be installed directly from within your Grafana instance or automated using the Cloud API or Terraform.
Learn more about plugin installationMarketplace plugins
This is a paid plugin developed by a marketplace partner. To purchase an entitlement, sign in first, then fill out the contact form.
Get this plugin
This is a paid for plugin developed by a marketplace partner. To purchase entitlement please fill out the contact us form.
What to expect:
- Grafana Labs will reach out to discuss your needs
- Payment will be taken by Grafana Labs
- Once purchased the plugin will be available for you to install (cloud) or a signed version will be provided (on-premise)
Thank you! We will be in touch.
For more information, visit the docs on plugin installation.
Installing on a local Grafana:
For local instances, plugins are installed and updated via a simple CLI command. Plugins are not updated automatically, however you will be notified when updates are available right within your Grafana.
1. Install the Panel
Use the grafana-cli tool to install Mosaic from the commandline:
grafana-cli plugins install The plugin will be installed into your grafana plugins directory; the default is /var/lib/grafana/plugins. More information on the cli tool.
Alternatively, you can manually download the .zip file for your architecture below and unpack it into your grafana plugins directory.
Alternatively, you can manually download the .zip file and unpack it into your grafana plugins directory.
2. Add the Panel to a Dashboard
Installed panels are available immediately in the Dashboards section in your Grafana main menu, and can be added like any other core panel in Grafana.
To see a list of installed panels, click the Plugins item in the main menu. Both core panels and installed panels will appear.
Changelog
1.0.14
Fixed axis labels when using light theme (https://github.com/boazreicher/mosaic-plot/issues/3)
1.0.13
Updated data format options to support usecases with a single data frame (https://github.com/boazreicher/mosaic-plot/issues/2)
1.0.10
Added the soft-max option (https://github.com/boazreicher/mosaic-plot/issues/1)
1.0.0 (Unreleased)
Initial release.