Plugins 〉BMC Helix


The BMC Helix plugin has been deprecated and is no longer maintained.
BMC Helix
BMC Helix Datasource
This is a Grafana datasource for fetching Metrics, Events & logs from Helix Monitor, Helix Remediate & Helix Optimize products
Requirements
Grafana 7.3.1+ is required.
BMC Helix v21.02+ license/subscription is required
Features
- Supports Lucene queries to fetch Events & Logs
- Supports Promql & Metricql to fetch Metrics data
- Utilizes BMC Helix REST API's
- Secured authentication via access key and secret key
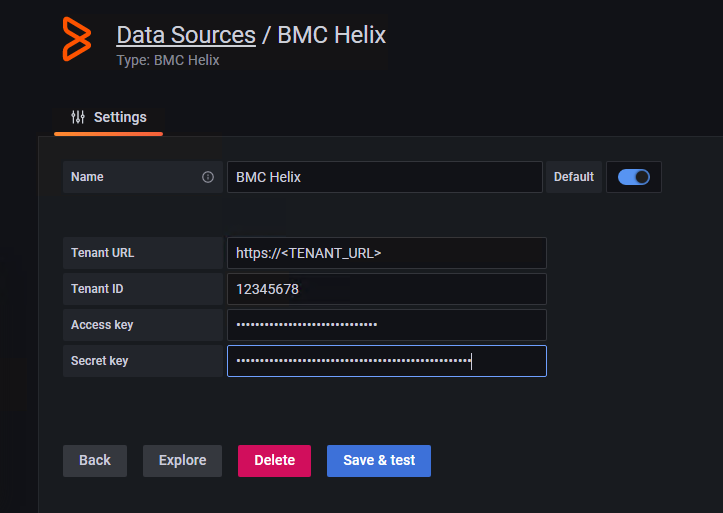
Configuration
This datasource uses the Instana REST API to query the underlying data services.
First of all you will need to generate an Access key & Secret key in BMC Helix portal (Keys)
Configure Retrived values as shown below
Usage
Query Types
The following query types are available:
CloudSecurity
Use this query type to fetch compliance data of the devices in your environment.
Events
Use this query type to fetch event data on the devices in your environment.
Metric
Use this query type to fetch the performance metrics data of the devices in your environment.
Log
Use this query type to fetch the log data from BMC Helix Log Analytics in your environment.
Query Editor
This section describes the each query editor.
Cloud Security
The following image displays the CloudSecurity query type:
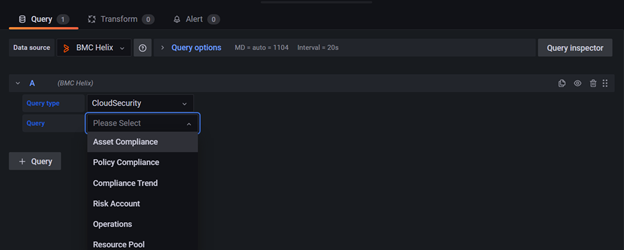
This query type requires the following data:
| Field | Description |
|---|---|
| Query Type | Use this field to select the query type |
| Query | Use one of the following queries to build a panel. The options for each query type are different Asset Compliance, Policy Compliance , Compliance Trend, Risk Account, Operations, Resource Pool |
Events / Log
The following image displays the Events query type:
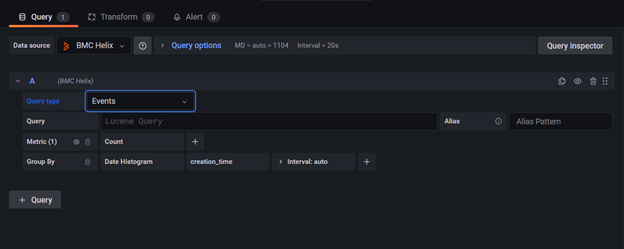
This query type requires the following data:
| Field | Description |
|---|---|
| Query Type | Use this field to select the query type |
| Query | Use a Lucene query syntax here, and it also supports typeahead |
| Metric | Click this field to select a metric for the query. For example, Average, Min, Max, and so on |
| Group by | Select a clause to group your data in the panel. |
<br>
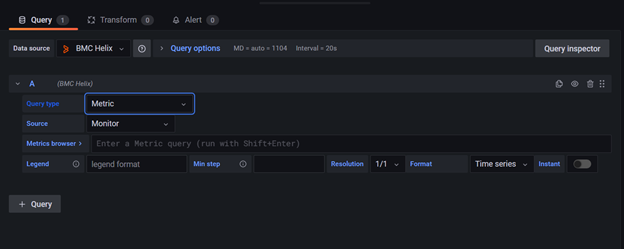
Metrics
The following image displays the Metric query type:
| Field | Description |
|---|---|
| Query Type | Use this field to select the query type |
| Metrics | Add a metrics query to this field. You can also form your metric query through query builder. Click the Metrics Browser field to access the query builder. |
| Legend | Add a legend to appear in the panel. You can use a variable here. For example, the value of the {{hostname}} variable is replaced with the host name in the panel. |
| Min step | Add a threshold for a lower limit of the Prometheus query. This setting is absolute, and cannot be changed by the value in the Resolution field. |
| Resolution | Sets the parameter for each pixel to correspond to one data point of a Prometheus range query. Use lower resolutions for better performance. |
| Format | Select one of the following formats for the panel: Time Series , Table , Heatmap |
| Instant | Use this radio button to return only the latest value for the requested time series. Instant queries return results faster than the normal range queries. |
Sample Dashboards
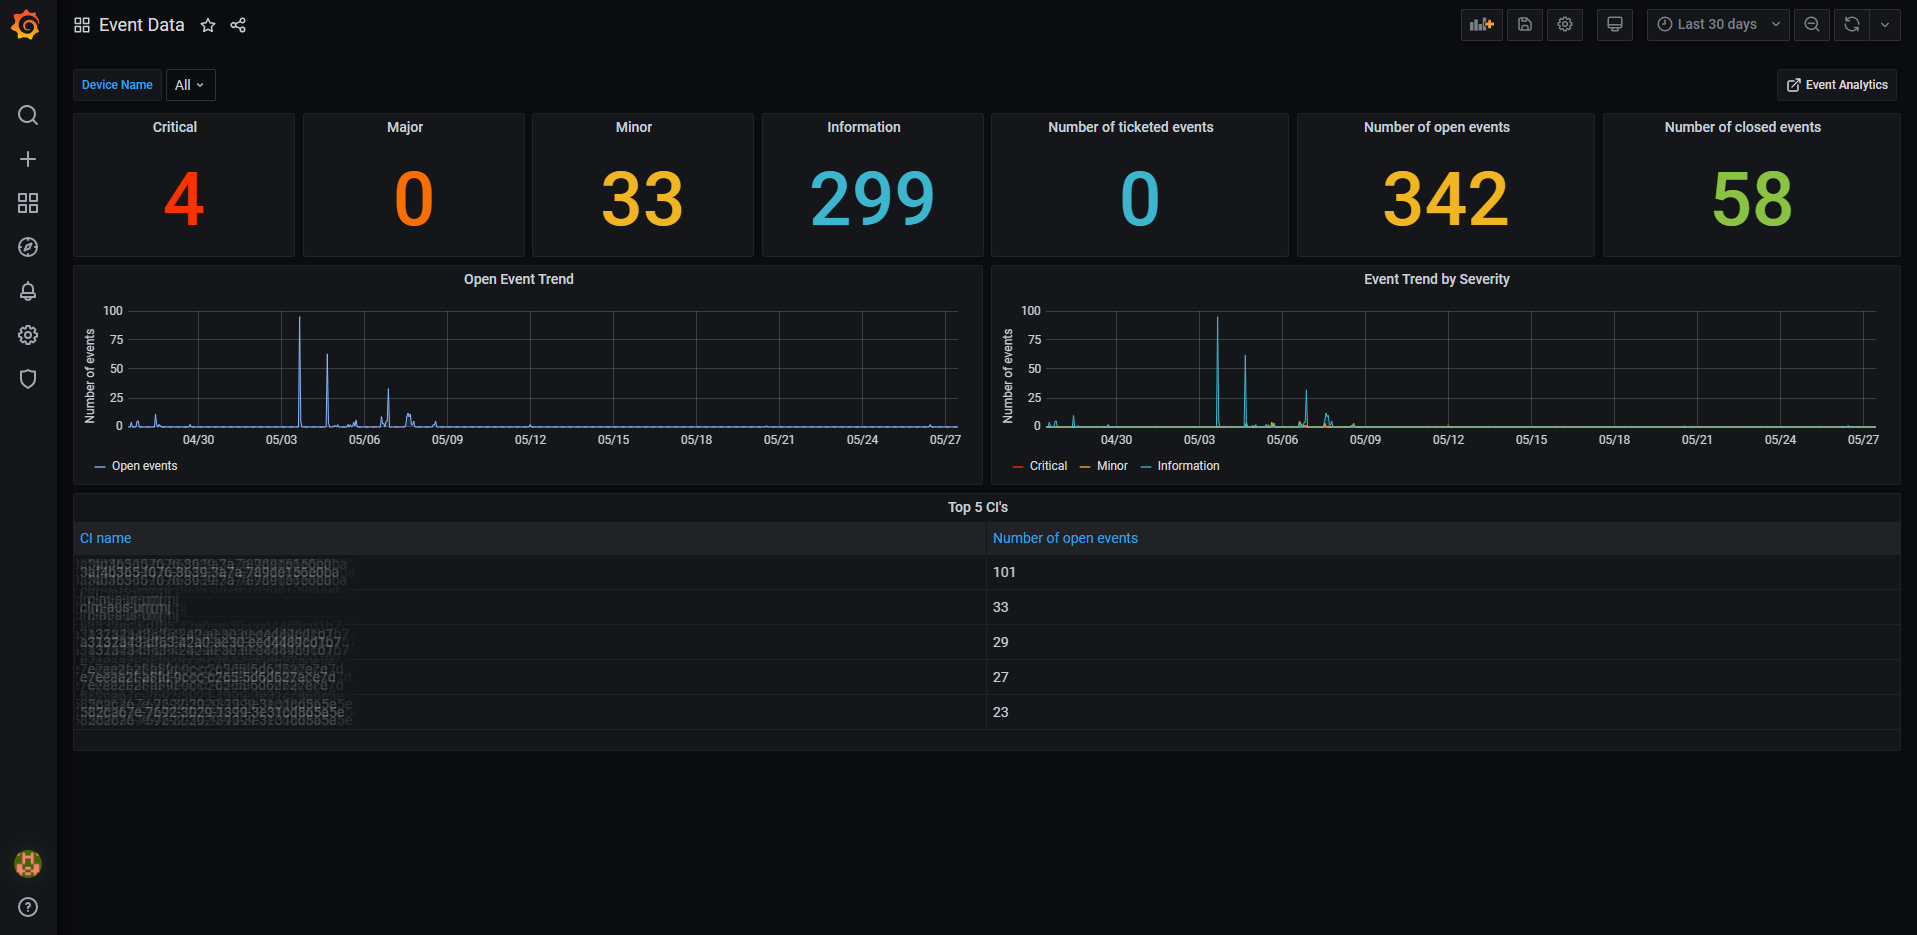
Events Dashboard
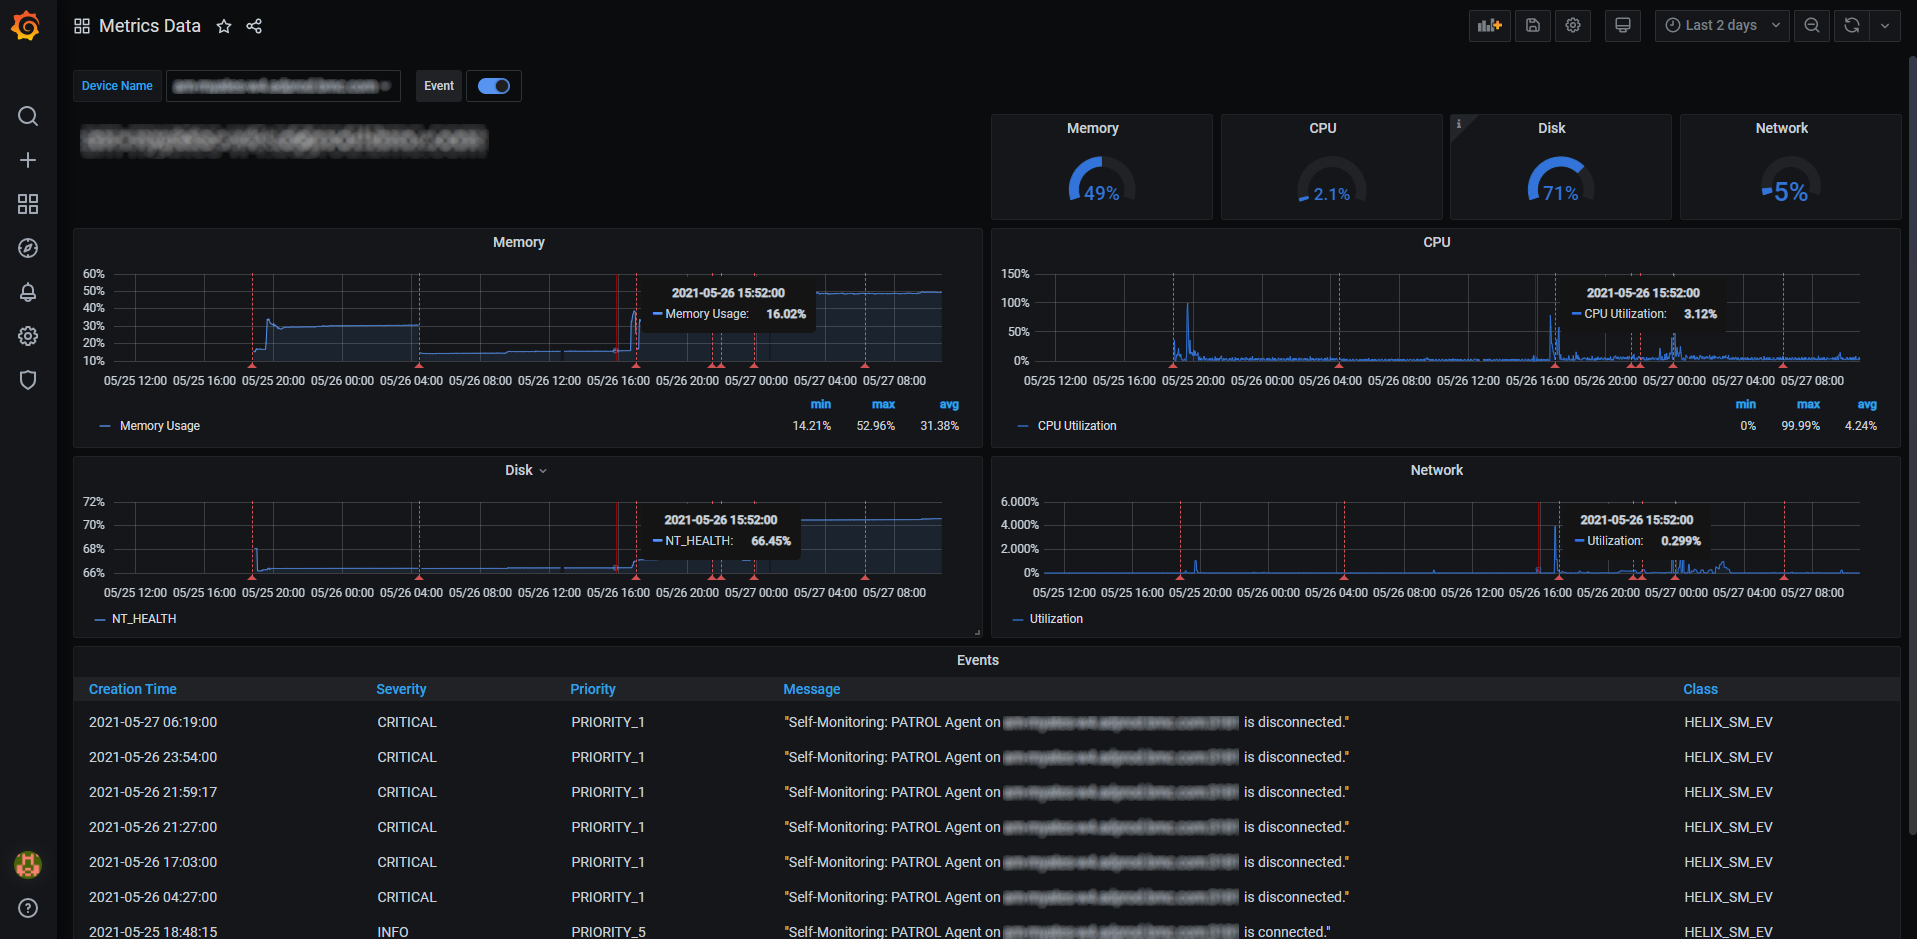
Metrics Dashboard
Grafana Cloud Free
- Free tier: Limited to 3 users
- Paid plans: $55 / user / month above included usage
- Access to all Enterprise Plugins
- Fully managed service (not available to self-manage)
Self-hosted Grafana Enterprise
- Access to all Enterprise plugins
- All Grafana Enterprise features
- Self-manage on your own infrastructure
Install on Grafana Cloud
Plugins can be installed directly from within your Grafana instance or automated using the Cloud API or Terraform.
Learn more about plugin installationMarketplace plugins
This is a paid plugin developed by a marketplace partner. To purchase an entitlement, sign in first, then fill out the contact form.
Get this plugin
This is a paid for plugin developed by a marketplace partner. To purchase entitlement please fill out the contact us form.
What to expect:
- Grafana Labs will reach out to discuss your needs
- Payment will be taken by Grafana Labs
- Once purchased the plugin will be available for you to install (cloud) or a signed version will be provided (on-premise)
Thank you! We will be in touch.
For more information, visit the docs on plugin installation.
Installing on a local Grafana:
For local instances, plugins are installed and updated via a simple CLI command. Plugins are not updated automatically, however you will be notified when updates are available right within your Grafana.
1. Install the Data Source
Use the grafana-cli tool to install BMC Helix from the commandline:
grafana-cli plugins install The plugin will be installed into your grafana plugins directory; the default is /var/lib/grafana/plugins. More information on the cli tool.
Alternatively, you can manually download the .zip file for your architecture below and unpack it into your grafana plugins directory.
Alternatively, you can manually download the .zip file and unpack it into your grafana plugins directory.
2. Configure the Data Source
Accessed from the Grafana main menu, newly installed data sources can be added immediately within the Data Sources section.
Next, click the Add data source button in the upper right. The data source will be available for selection in the Type select box.
To see a list of installed data sources, click the Plugins item in the main menu. Both core data sources and installed data sources will appear.
<!-- 2.0.0 START -->
2.0.0 (2022-16-01)
Features and enhancements
- Log: Use new query type log to fetch the log data from BMC Helix Log Analytics in your environment.
3.0.0 (2022-22-04)
Features and enhancements
- Query Editor moved to React from Angular.
- Events / Log: Upgraded the event query type UI. And added typeahead support for event query.
- Metrics: Upgraded the metric query type UI. Added metrics browser, to help user create the query with query builder.