Plugins 〉Flow


Flow


Flow
SVG flowchart visualization

The Flow plugin provides side-by-side metric visualization on SVG diagrams. You provide the SVG diagram along with configuration on how you want the diagram to behave. The panel then combines these with your time-series data to bring your diagram to life.
Example 1
Example 2
Example 3
Target Audience
Dashboards detailing flow through distributed systems quickly get big and often benefit from some kind of lead in architecture diagram. This panel is aimed at supporting these diagrams. You create the SVG in a rich editor such as draw.io and then associate the data-series and thresholds via yaml config. As well as annotating the diagram with data, you can also add links allowing you to click on the different widgets and dive into an 'exploded' view of the selected component.
Think glass-cockpit with layers of detail; each layer giving ever increasing detail on system health. When creating dashboard suites such as these you often end up with many similar widgets that benefit from sharing the same threshold config. This panel actively supports this by allowing you to share thresholds and links, both within a panel and also across panels. It even goes one step further by allowing you to tailor threshold sets based off of grafana variable selections. This really helps make the thresholds relevant in all situations.
The panel isn't limited to just last-values. We've already paid the price of pulling in a time-range so this panel allows you to see the diagram at any of those points in time. Traverse the timeSlider back and forth to see your flows evolve. There is no grafana overhead for this because the data-series have already been fetched; we're just changing the point-of-interest.
Feature Set
The plugin content is defined with three data files:
- SVG: This defines the flowchart with controllable widgets identified via the cell IDs.
- PanelConfig: Defined in yaml, this associates the above cell IDs with time-series, thresholds, links and visualization config.
- SiteConfig: Defined in yaml, this provides cross-panel shared configuration such as thresholds, links, colors, etc.
The data files can be pasted into the panel, but they can alternatively be loaded from external URLs such as github. When first rendered the panel shows the flowchart at last-values. i.e. the end of the time-window. But this is movable. A Time-Slider at the bottom of the panel allows the full timeseries to be traversed so you can see how the flow evolves over the time window.
The supported visualizations are:
- label content
- label color
- fill color
- stroke color
- links
- connector flow animations
- fill level
- bespoke SVG element attribute drives
Note that tooltips have no inbuilt support in the panel, but can be defined in the SVG and will appear in the panel on-hover courtesy of the underlying framework. To set a tooltip in draw.io, select widget -> Edit -> Edit Tooltip; or select widget -> <ALT><SHFT>T.
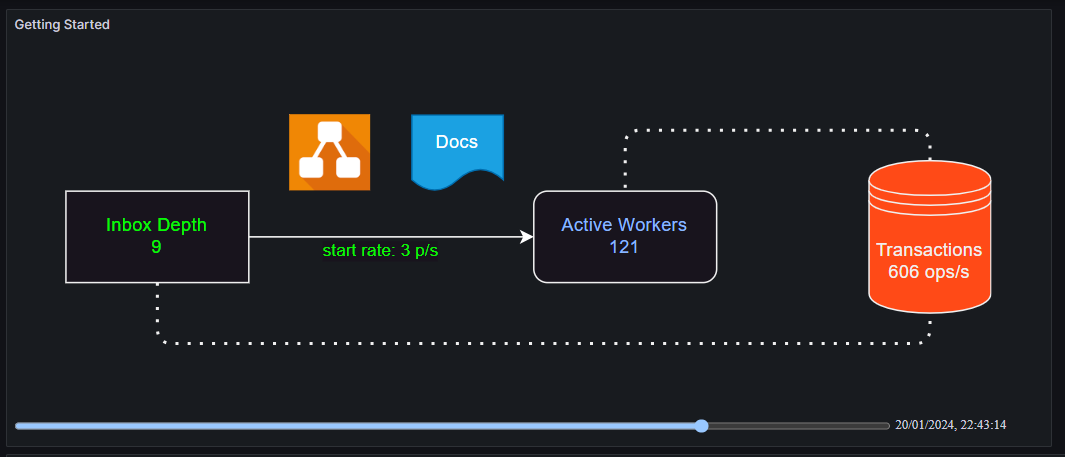
Getting Started
Create a Flow Panel in your dashboard. The initial setup loads the first example from this repo via urls. It also enables test-timeseries-enrichment. These test timeseries ensure the initial dashboard has some data to show. It gives you a working example straight out of the box.
Explore
- Scale:
- Change the size and shape of the grafana panel. See the SVG automatically scale to fill the content whilst maintaining aspect ratio.
- Time Slider:
- Drag the time-slider back and forth. See the flow labels, label colors, fill colors change according to the defined thresholds.
- Open the panel editor and deselect the time slider to see the SVG expand into the additional space and revert to last values.
- Open the panel editor and select time-slider 'Time' mode. In this mode the time-slider will drive other panel time-sliders and timeSeries shared-crosshairs.
- Links:
- Move the mouse over a cell. See the cursor change to a pointer. Click and dive off to the associated link.
- Move the mouse over the 'Active Workers' cell. note the mouse doesn't change as there is no associated link.
- SVG and Config References:
- Edit the SVG reference and see the SVG dissapear. Change it back and see it reappear.
- Edit the Panel Config reference and see the annotation dissapear. Change it back and see it reappear.
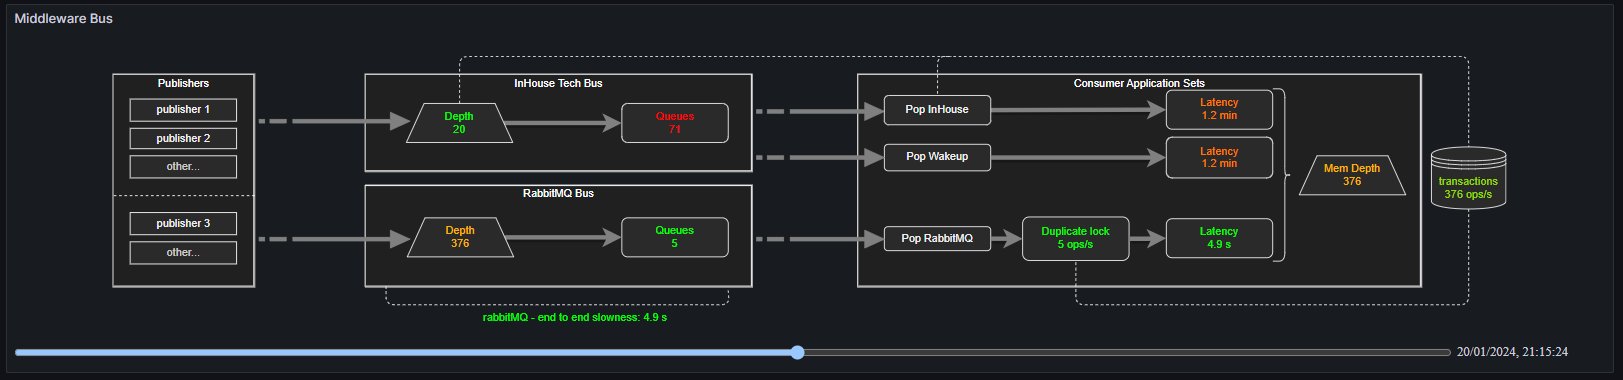
- Change the links over to the second example. This shows a bus middleware example and also demonstrates use of a the shared siteConfig file:
- svg: https://raw.githubusercontent.com/andymchugh/andrewbmchugh-flow-panel/main/examples/darkThemeSvg2.svg
- panelConfig: https://raw.githubusercontent.com/andymchugh/andrewbmchugh-flow-panel/main/examples/panelConfig2.yaml
- siteConfig: https://raw.githubusercontent.com/andymchugh/andrewbmchugh-flow-panel/main/examples/siteConfig.yaml
- Change the links over to the third example. This shows a selection of interacting queues. The cells have all been given threadHighlighting tags and the Highlighter legend is enabled allowing different sets of data to be highlighted to spot correlations:
- Change the links over to the fourth example. This shows connectors with flow animations. Flow speed is dynamically controlled from the incoming data. Whenever flow animations are defined a pause/play button is visible in the bottom left hand corner of the panel. Move the time-slider back and forth to see the flow rates adjust.
- Change the links over to the fifth example. This shows dynamic fill levels and bespoke attribute driving. It shows elements rotating and scaling and labels showing values dynamically calculated from a set of incoming mathjs formulas. Move the time-slider back and forth to see all the drives in action.
- Test Data Generation:
- Deselect generation and see the SVG change to unannotated. Reselect and see the color and values come back.
- Debugging: Note these steps all need you to open your browser console.
- Data: Press the button and expand the two log lines of Debugging Data raw and Debugging Data enriched. The raw view is the timeseries grafana has sent to the panel. The enriched view is the data after test-data has been included. In the enriched view every used time-series has a corresponding time series and the time series also shows the valuesIndex that has been chosen based on the time-slider position.
- Mappings: Press the button and you'll get log lines for abstract and verbose. The abstract line shows how SVG cell IDs have been assigned to time-series. The verbose line gives all of the SVG mapping information.
- Units: Press the button and expand out the log line showing the Category -> Subcategory -> {text, value} for every potential unit. The unit strings you enter in the yaml config are the values shown here.
- Colors: Press the button and see the available grafana theme hues. Each hue has mutiple shades. These color names can be used directly in the yaml. Alternatively you can enter short hex, long hex, rgb or hsl. All of these formats will be recognised and so will also work with gradient selected. If you want to enter html color names instead, they will be passed through to the SVG but they won't be understood by the panel and so gradient will have no effect.
- SVG: Press the button and see the serialized svg that is being displayed. Copy it out to compare to the passed in svg template or save away as a snapshot image.
- Timings: Press the button to instrument the next render pass. This allows you to see where the time is going:
- toDataFrame: The panel only understands the dataframe format so the first step is to convert incoming data into this format. If you aren't sure what format you are receiving, run the query in Query inspector and look at the response. i.e. a dataframe will contain a fields array whilst a time-series will contain a datapoints or points array. Note that moving the timeSlider requires a fresh render pass and the panel has no way of telling if the data received is the result of a fresh fetch. As such this step has to be repeated each time the timeSlider moves. However, it's only expensive if the incoming data is not in a dataframe format.
- transform: This converts the dataframes to the format needed by this panels interpolation. It's a light weight array restructuring.
- seriesExtend: This adds in the test time-series. You will only see this if test time series are enabled in the panel options.
- seriesInterpolate: This interpolates each of the time arrays to determine the correct index for the given timeSlider position.
- svgUpdate: This applies the label and threshold settings to the document.
- createJsx: This creates the JSX from the svg document html.
Using draw.io to create your SVG
Any tool can be used to maintain your SVG but draw.io is the tool used for all of these examples. draw.io is available online and also as an app download. When launching the online version or the desktop app, you must ensure the svgdata plugin is added by going to Extras->plugins->Add->svgdata.js. The plugin ensures the cell IDs get saved in the SVG file. Note that prior to September 2024 the online version could be launched with the argument the ?p=svgdata to automatically enable the plugin. That tail no longer works so you must now add the plugin as just described.
The cell IDs can be edited in-situ by selecting the cell then Edit->Edit Data->Double click on the ID value->edit the ID.
The draw.io IDs under the hood get given a preamble of cell-. To make this easier the panelConfig yaml allows the preamble to be set so the actual yaml data can reference the IDs as you've entered them. You can see the difference in the Mappings data as it shows your ID as well as the full svg ID.
The SVG can be entered directly into the panel or it can be referenced via url.
Using YAML to configure your Flowcharts
YAML offers a few useful features over other config formats. (1) It can be commented. (2) It supports anchors and aliases. Both of these features are really useful for long term maintainability. The yaml files can be entered directly into the panel or they can be referenced via url.
The panelConfig details the set of SVG IDs that are going to be driven and how they are going to be driven. It's particular to the panel.
The siteConfig details common settings that you are using across a suite of panels. It provides a way to define a system level theme, so all the panels respond in a similar way and can be maintained with single touch points. You don't have to use a siteConfig. All parameters can be defined in the panelConfig. The only reason for using a siteConfig is for when you are maintaining a suite of panels. The panelConfig and siteConfig urls will have grafana variables replaced prior to fetching the files. This gives you some level of multi-site configurability.
Grafana Variables can also be used to scale threshold definitions. i.e. if you have an environment variable you could scale the thresholds differently in dev and prod.
These links take you to yaml files where each of the settings are documented:
Environment Setup & Editing Workflow
Creating panels is best achieved by using using three IDEs together as a holistic set in the followng way:
- Install the draw.io app and add the svgdata plugin by going to Extras->plugins->Add->svgdata.js. Using the app rather than the online version makes it much easier to load and save from/to your local disk.
- Create a github repo for your svg and yaml files. This gives many things but the really big one is providing a central hub from where the files can be loaded and edited.
- Install VSCode for viewing and editing the above repo. It offers yaml syntax highlighting and gives a place to copy out the svg for pasting into the panel.
- With the above setup, follow an iterative workflow of:
- draw.io: Edit the svg -> save as svg. Note that if using Flow Animations or widgets containing embedded images you have to
Export as -> SVG...rather than just save. - vscode: Copy the svg -> paste into the grafana panel
- vscode: Edit the panelConfig yaml -> Copy the yaml -> paste the yaml into the grafana panel
- repeat With this workflow all three editors (draw.io/vscode/grafana) remain open and just act as specialised windows. Although you could edit yaml or the svg directly in the grafana panel, you'll find it much simpler to copy/paste into the panel and use the gihub repo as the underlying main version.
- draw.io: Edit the svg -> save as svg. Note that if using Flow Animations or widgets containing embedded images you have to
First Panel
Once your familiar with the controls creating your first proper panel boils down to this process:
- In draw.io, create an SVG and edit the cell IDs to meaningful names. Keep it minimal in the first instance.
- Copy an example panelConfig as that's setup with cellIds that are using testData. Edit the cellIDs to match your SVG IDs.
- Create your Flow panel and set it to be driven from your SVG and your panelConfig.
- See your SVG responding in the correct units to the test data.
- Develop your time-series query in its own time-series panel until you are happy with the result. Remember to alias the time-series to a meaningful name as you will use in your Flow panel.
- Copy your query into the Flow panel.
- Press 'Debugging Data' to see your query time-series coming through to the panel.
- Change your panel config dataRef to map the cell ID to your time-series name.
- Use the time-slider to see your value being correctly echoed in the SVG.
- Rinse / Repeat.
- Remember to switch of 'Test Data Generation' when finished so your panel doesn't suffer the overhead.
Feature Exploration
The API for all the panel features is detailed in the yaml_defs. The features are also demonstrated in the provisioning dashboards. The associated SVG and yaml files used in those dashboards, linked below in the Data Files column, are a good starting point to explore the feature drives. Note when clicking on the SVG links you initially land on the Preview tab. Just switch to the Code tab to be able to copy out the SVG.
To explore each feature, copy/paste the SVG and yaml data into your panel. That gives you a working starting point from which to explore as you read the associated API. Exploring these features is best done by following the workflow described above in Environment Setup & Editing Workflow. With the majority of them the functionality is best seen by moving the time-slider back and forth.
| Feature | Description | Setup | Data Files |
|---|---|---|---|
| Background Color | Background is normally left untouched but the panel yaml can define a darkTheme and a lightTheme color. If the yaml field is present the background color is driven. Go to user -> profile to change the theme from dark to light. | svg, panelConfig | |
| Bespoke Drive | The bespoke drive demonstrates how to drive any svg attribute via mathjs formulas. See the Bespoke Drive Example below for details. | Variable myVar | svg, panelConfig |
| Color Mappings for Themes | SVGs created in draw.io 26.0 and onwards contain both light and dark theme colors. The cell colors defined in thresholds allow you to specify a single color and the colorMappings allow you to adjust the value of that color for each theme. i.e. In the cell config specify red, amber and green on the thresholds. Then in the colorMappings specify the exact colors you want in each theme for red, amber and green. | svg, panelConfig, siteConfig | |
| Compound Color | This demonstrates compound colors, the ability to drive a cell color field based off of an aggregation of dataRefs. The panel shows labelColor, fillColor and strokeColor being driven based off of aggregation functions 'max' and 'min'. By default thresholds inherit their array position as their order but the order term can be explicitly set. The 'inverse' box demonstrates an inverted threshold order resulting in min-data displaying as max color. Where the single 'color' drive is defined alongside a compound drive, the single drive is prepended to the compound in element 0. This is demonstrated in the 'both' cell. | svg, panelConfig | |
| Decimal Points | This demonstrates the panel level decimalPoints overrides. Each box has a different decimalPoint setting at the cell level with the last box being undefined at the cell level and so falling back on the panel level default. | svg, panelConfig | |
| Fill Filter | Fill colors, when applied to simple shapes, provide a great way to visualize thresholds. But for more complex shapes, that contain a background with foregound detail, the fillColor needs to apply to one or the other, otherwise the detail gets lost. This is managed using the yaml fillColorElementFilter. It requires you to understand a bit about how your shape is constructed, but with that knowledge you can then specify which parts of the shape should be filled. The best way to introspect your shape is to view the SVG in Visual Studio after formatting it using the SVG formatter extension. Find your shape by searching on your cell-id and then explore the yaml filter based on what you see. | svg, panelConfig | |
| Fill Level | Fill levels are underpinned by the SVG clip-path feature. The yaml maps the data to fill percentages and that then drives an applied clip-path rect to achieve the desired fill level. The panel demonstrates the following features: (1) A range of ellipse, rect and path shapes all being filled correctly. (2) The four rects-in-a-cross demonstrate the four fill directions. (3) The 'blue' demonstrates a static fill color defined in the SVG. (4) The bottom four rects show the percentage capping, the optional 'off' setting and the own-dataref. Note that shapes with complex inner detail such as the DB and circle-inner-cross do not render perfectly as they contain multiple path elements and so have multiple overlapping clip and fill regions. | svg, panelConfig | |
| Flow Animation | draw.io has a line property called 'flow animation'. When selected the line animates in a particular direction at a particular rate to visualize flow. For these animations to be available in the panel you must use the draw.io Export As -> SVG rather than Save. The yaml data assumes directionality based on sign but that can be overriden by marking it as unidirectional. The animation duration is defined with three bounds: off, lower and upper. Whenever animations are present in the yaml data, a control is visible in the bottom left corner. This is on the timeSlider -> highlighter -> own section depending on visibility. The panel options also allows the initial animation state to be selectable. | svg, panelConfig | |
| Links and Clicks | This shows widgets with absolute and relative links, with and without time. The third row shows variable substitutions as defined in the site and panel config. The fourth row shows the ${cell.name} reserved variable substitution. This part of the yaml really only works with this repos provisioning setup as relative links have to be to something in the same site. It's included here because it does offer a set of worked examples to help demonstrate how the functionality is configured. Note that for time-variable forwarding to work, the from and to variables must be in the original url. The green rectangles at the bottom of the panel demonstate click actions. clickActions can set grafana variables and/or adjust the highlighter selection. The text in each box says what it will do. | Variables grafanaVariable, secondVar, testMulti, flowAnimDashboardID | svg, panelConfig, siteConfig |
| Stroke Color | This demonstrates stroke-color. It shows how shapes and lines can have their stroke component colored based on thresholds and incoming data. | svg, panelConfig | |
| Tabular Data and Query Namespacing | This demonstrates how to reference tabular data and use query namespacing. Usually data is in a time-series format. i.e. there's a column of time values and a column of corresponding data values. Sometimes though, people want to display scalar values that they've fetched in a tabular format. If only one row is fetched, no special treatment is needed as it presents the same as unchanging timeseries data. If more than one row of data exists, the individual cell values can still be referenced by using the dataRefTransform yaml. This yamls also allows you to switch on dataRef namespacing. When on, dataRefs get assigned a queryName preamble. | Query A should be set to queryType=listPublicFiles, path=testData. Query B should be set to queryType=RandomWalk | svg, panelConfig |
| Thread Highlighting | This demonstrates thread highlighting. The cells are tagged with attribute type and technology type allowing the data to be higlighted across these dimensions. The intent behind this is to make it easier to spot correlations. This example also shows how the highlighter state is available in the bespoke drive allowing you to adjust things like visibility based on selection. | svg, panelConfig | |
| Time Slider Mode | This panel setting controls time-slider collaboration across the dashboard. Explore this by creating two Flow panels and a Time-Series panel. In the dashboard settings enable 'Graph tooltip'->'shared crosshair'. With all this in place change the Flow panel 'Time Slider Mode' to 'Time'. Move the mouse over the time-series panel; see the sliders keep in sync. Move one of the time-sliders; see the shared-crosshairs respond. Change the mode to 'Position' in both Flow panels and adjust the time offset in one of them to be 24 hours. Move the sliders and see how their positions remain in sync, even though their time settings are 24 hour apart. | ||
| Units | This demonstrates normal units with associated grafana scaling alongside custom units specified using the unitsPostfix yaml field. It demonstrates normal ascii alongside unicode characters. | svg, panelConfig | |
| Value Mappings | This demonstrates value mappings via range based substitution of numbers at both the panelConfig level and the siteConfig level. Grafana variable substitutions are applied to the text values in the 'low' state. | Variable exampleVar | svg, panelConfig, siteConfig |
| Zoom Pan Pinch | This demonstrates the Zoom-Pan-Pinch configurability which supports enablement along with wheel activation keys. The activation keys are helpful as there's a clash of interests between dashboard scroll and panel zoom. | Pan / Zoom Enabled | svg, panelConfig |
Bespoke Drive Example
This panel demonstrates the bespoke drive in the following ways:
- Top Left Rect - scales with data around the top left corner
- Middle Rect - demonstrates rect label driven from bespoke data with grafana-variable replacement.
- Bottom Left Range Ring - scales with data around the center with aligned label again driven from a bespokeDataRef as shown by the value aliasing. label.
- Middle Clocks - Hands rotate around the centre demonstrating namespacing alongside normal stroke color drives. The second clock leverages the same formulas as the first clock but with different data, courtesy of dataRef name setup in the per-clock constants.
- Middle Bottom Arrow - Shows head (aka direction) configurability based off of data.
- Left 'column of rects' - Shows all the normal drives being driven from bespokeDataRefs as defined at the drive level.
- Right 'column of rects' - Shows all the normal drives being driven from bespokeDataRefs as defined at the cell level.
- Right Propeller - Shows two paths, one for each blade, rotating around a set origin, both with coherent fillLevel drives.
Troubleshooting FAQ
- After upgrading to draw.io 26.0 the color drives are no longer working and the colors in the SVG in general look wrong.
- This version of draw.io introduced theme colors. i.e. each color defined in the SVG is defined as a tuple of the color to use on a dark theme and the color to use on a light theme. This was a breaking change for this plugin that is fixed in Flow Panel version 1.17. You need to upgrade to that version of this plugin if you are using draw.io 26.0 or later. Note that even with the new version some SVG editing in draw.io may still be necessary as draw.io does not perfectly upgrade the color definitions. Once you have upgraded, your SVGs will correctly render in both dark and light themes.
- When I edit the SVG and resave nothing works anymore?
- This is most likely caused by not having the svgdata plugin loaded in draw.io which results in all the IDs being stripped off the SVG. If unsure look at the difference between the two versions of the SVG.
- My label isn't being driven even though 'Debugging Mappings' says it's correctly mapped?
- This is most likely caused by having a multi-line label in the SVG. Multi-line isn't drivable. Your labels can be multi-word but can't contain <CRs>.
- I've added a shape (rect, ellipse, etc.) and it maps correctly to yaml but the label doesn't appear?
- It's not enough to just add the shape. You must also double click in it and type some text to add a label. Then the label is drivable. In theory you could just add a space but if you do that you have no visual indication on your diagram as to whether the label element exists, where it's positioned, how it's formatted, etc. Everything may work as you want but if it doesn't your journey to understanding why will be much harder.
- My flow animation looks great in draw.io but doesn't work in the panel?
- This is most likely due to the way you saved the SVG. Flow animations have to be 'exported as svg' from draw.io, they can't just be 'saved as svg'.
- My widget renders well in draw.io but is missing detail in the panel or just not there?
- This is most likely due to the way you saved the SVG. More complex widgets have to be 'exported as svg' from draw.io, they can't just be 'saved as svg'.
- My widget renders well in draw.io and the panel but it looses all inner detail when I apply a fillColor?
- If fillColor is obliterating inner detail that's probably because the widget contains several internal SVG elements and fillColor should only be applied to a subset of them. An example of this would be the draw.io 'L3 switch'. To correct this you have to apply a fillColorElementFilter. Look at the examples under 'Fill Filter' in the 'Feature Exploration' section above.
- My timeseries is sparse and often the last value is null resulting in the widgets not showing a label value?
- By default the 'datapoint' selection is 'last' but this can be changed to 'lastNotNull'. In 'lastNotNull' mode the datapoint is walked back from the current time until it hits a non-null data value.
- I don't understand what to put into dataRef to see my data?
- dataRef is a general purpose name, short for data-reference. It doesn't map to a single 'grafana' term, but instead refers to the name grafana give your data when they present it to the plugin in a dataFrame format. How the name is determined by grafana is complex and datasource dependent. Given this, the easiest way to understand what to type for the value is to press 'Debugging Data'. This lists in the console your data as the plugin sees it. If you are having trouble understanding what in the log is 'your name', look for the test_data names such as "test-data-large-sin". Alongside it you should see your data. Once you understand how the data is coming through you can adjust your query to give it the name you actually want. first panel explains how to follow this process. The yaml_defs also explain what the term is.
- I've created my first yaml file and pasted it into the panel but the panel refuses to load it. I don't understand the console error...
- All yaml files should begin with the start-of-document marker '---'. Although this is optional in the yaml spec, it's mandatory in this space because the plugin has to decide whether the passed in string is a url or a yaml document. Without the '---' the content when pasted into the panel will likely be considered a url.
- If that doesn't solve the problem, just keep reducing your yaml down to a minimal example until you find the problem. Editing the file in a smart IDE just as VSCode makes this a lot simpler as it should highlight syntax errors for you.
- I've set the time-slider mode to 'Position' but the times in the panels aren't exactly the same, they are a few minutes apart?
- The time-slider time range in each panel is determined from the time-range in the query response. Only if no times are available from the queries does it fall back on the dashboard time-range. It's done this way so the slider can control the range of data which can be quite different from the dashboard time-range when time-offsets are used in the query configuration. The end result of this is that each panel will have a slightly different time-range depending on the query response. That means when using 'Position' to synchronize sliders the times will be more approximate. If not using time-offsets in queries, prefer the 'Time' mode. In that mode the times will exactly match. Only use 'Position' mode when using time-offsets.
Want to make changes?
Go to the Grafana Getting Started guide to get going with downloading a fork and setting up your test environment. Once up you'll find dashboards available (sourced from the provisioning directory) that act as demonstrators for the functionality.
Grafana Cloud Free
- Free tier: Limited to 3 users
- Paid plans: $55 / user / month above included usage
- Access to all Enterprise Plugins
- Fully managed service (not available to self-manage)
Self-hosted Grafana Enterprise
- Access to all Enterprise plugins
- All Grafana Enterprise features
- Self-manage on your own infrastructure
Install on Grafana Cloud
Plugins can be installed directly from within your Grafana instance or automated using the Cloud API or Terraform.
Learn more about plugin installationMarketplace plugins
This is a paid plugin developed by a marketplace partner. To purchase an entitlement, sign in first, then fill out the contact form.
Get this plugin
This is a paid for plugin developed by a marketplace partner. To purchase entitlement please fill out the contact us form.
What to expect:
- Grafana Labs will reach out to discuss your needs
- Payment will be taken by Grafana Labs
- Once purchased the plugin will be available for you to install (cloud) or a signed version will be provided (on-premise)
Thank you! We will be in touch.
For more information, visit the docs on plugin installation.
Installing on a local Grafana:
For local instances, plugins are installed and updated via a simple CLI command. Plugins are not updated automatically, however you will be notified when updates are available right within your Grafana.
1. Install the Panel
Use the grafana-cli tool to install Flow from the commandline:
grafana-cli plugins install The plugin will be installed into your grafana plugins directory; the default is /var/lib/grafana/plugins. More information on the cli tool.
Alternatively, you can manually download the .zip file for your architecture below and unpack it into your grafana plugins directory.
Alternatively, you can manually download the .zip file and unpack it into your grafana plugins directory.
2. Add the Panel to a Dashboard
Installed panels are available immediately in the Dashboards section in your Grafana main menu, and can be added like any other core panel in Grafana.
To see a list of installed panels, click the Plugins item in the main menu. Both core panels and installed panels will appear.
Changelog
1.20.1
Click Action Fixes
Allow setting of grafana-variable multi-values through array definition.
1.20.0
Click Actions
New panel config term "clickActions" introduced. Up till now cells have been clickable if they have a url link defined. This change extends clickability to include
- grafanaVariable setting. Similar to links, the values defined can contain other grafana variables or the reserved names for the cellName and dateRef.
- highlighter bar selection. On/Off click toggling is also supported.
SVG & YAML Relative Links
URL Links to the svg and yaml files have to be absolute. However as of this version, relative links can be defined by including a '${document.baseURI}' preamble on the link. i.e. ${document.baseURI}d/stuff => https::mygrafanahostname:3000/d/stuff.
1.19.0
Tabular Data and Namespaced Data Support
New panel config term "dataRefTransform" introduced. This provides two features:
- You can namespace a dataRef with the queryName (i.e. A.myTimeSeries). Doing this allows you to separate overlapping timeseries names returned by the different queries (i.e. A.myTimeSeries vs B.myTimeSeries).
- You can specify a row identifier column for the 'not-timeseries' tabular data usecase. This provides a way to address any cell in a returned data-table as its own dataRef.
Grafana variables in links
Grafana variables in links are now correctly substituted. This fixes a bug introduced around 1.17.
1.18.5
Time Slider Time String
The time-string on the time-slider has been changed to always display time using a 24 hour clock. This keeps it in common with the grafana time selector and the grafana time series panel x axis display. Before it used a browser format which meant with some language settings the string displayed using a 12 hour clock.
1.18.2
Gradient Support
Allow use of the following svg terms:
- tags: linearGradient, radialGradient
- attributes: gradientUnits, gradientTransform
The latest draw.io version (27.0.5) has started using these on certain exported widgets such as the 'hard disk' icon.
1.18.1
TimeSlider hookup with the shared tooltip/cursor http fix
Remove use of function introduced in 1.18.1 that was only available on https and localhost. It wasn't available on http.
1.18
TimeSlider hookup with the shared tooltip/cursor
To celebrate the panels 1st year anniversary which coincides with it reaching 1M downloads, this change adds a new panel option for the TimeSlider Mode. It has three values:
- Local - This is the existing behavior where the timeSlider applies to just this panel. It's the default mode so there is no change of behavior when upgrading.
- Time - In this mode the timeSlider 'time' value is shared. It synchronises with other shared timeSliders as well as timeSeries panel shared-crosshairs.
- Position - This mode is the same as 'Time' but the shared value is the slider 'position' rather than 'time'. 'Time' mode makes sense where all the panels are displaying a similar time-range. In this mode the 'Time' value will accurately reflect across all panels. 'Position' mode comes into its own where you have Flow panels with different time-offsets. i.e. one showing today and one showing the same day from one week ago. These kind of offsets are settable at the top of the Grafana query pane. By sharing the slider position rather than time you get a meaningful way to traverse the time-range in both panels, but note the actual time reflection will be more approximate as each panel has a unique time-range based off of the returned query data.
Note that a panel can participate in this sharing even when its timeSlider is deselected. As such you can have a suite of Flow Panels laid out on your dashboard with just a single timeSlider to control all the panels.
The mode selection is not affected by the dashboard 'Graph Tooltip' selection. These multi-panel updates have a performance cost so by keeping selection independent you can have Flow panels colaborate whilst not suffering the overhead of all the timeSeries panels joining in; and vice versa.
Logo Modification
Colors tweaked to improve legibility.
1.17.5
Pass Highlighter bar settings through to the bespoke drive
This change makes the 'highlighterSelection' and 'highlighterState' available to the bespoke drive math.js formulas in the utils object. Providing access to this information allows users to drive attributes such as visibility off of the highlighter setting. It also adds attributes 'opacity' and 'fill-opacity' to the list of attributes the bespoke drive is allowed to add to the svg.
This version also corrects some inefficiencies in bespoke formula evaluation repeats.
1.17.4
Fix Fill-Level Drive on Repeating Panels
This fixes a bug with fill-level drives on 'repeating grafana panels'. Before the fill-level from one panel drove the fill-level on all the repeats. With the fix they are now independent.
1.17.3
Fix url links variable substitution
This corrects a few bugs with variable substitutions in links. The link variables can now contain references to the reserved names (cell.name and cell.dataRef).
1.17.2
FillColor drive filter to support shapes with foreground detail
Complex shapes represented my more than one element (path, rect, etc.) sometimes need fillColor to be applied to just a subset of the elements that make up the shape. The draw.io 'L3 switch' is one such example that's represented using two 'rect' elements and two 'path' elements. Applying fillColor to all elements results in a loss of the foreground detail. This change introduces a new yaml term that allows you to filter the application of fillColor to make these complex shapes drivable.
New config terms in panelConfig:
- panelConfig:fillColorElementFilter
1.17.0
Light / Dark Theme Support with draw.io 26.0
draw.io 26.0 introduced light / dark theme support where all colors can be defined as tuples in the SVG. This version of draw.io requires this version of the panel plugin due to the change in how the dynamic color attributes need to be applied.
As well as making the plugin compatible with this draw.io version, it also fully exposes the theme support ensuring the SVG theme is kept in line with the selected grafana theme. As non-driven colors will now respond to theme selection, new colorMapping config terms have been added to allow you to define theme dependent colors. i.e. red in a dark theme can be mapped to light-red; whilst in a light theme it could be mapped to dark-red; etc.
New config terms in panelConfig:
- panelConfig:cellColorMappings New config terms in siteConfig:
- siteConfig:cellColorMappings
1.16.6
YAML maxAliasCount
The yaml loader recursive alias count has been increased from the library default by 100x to allow for larger more complex configuration whilst not exposing the dashboard to unreasonable load.
Downloads badge fix
Downloads badge corrected following recent github changes.
1.16.5
SVG formatting support improvements
Formatting of diagrams edited in the latest draw.io (v24.7.8) caused label layout problems; especially if the labels were multi-word. This should now be fixed by removing multi-spaces from labels at initialization and further limiting the application of whitespace style 'pre'.
TimeSlider label
Improvements made to the timeSlider timezone application and label positioning to remove artifacts seen when not using browser-time or the 24 hour clock.
Getting Started Docs Improvements
Three new sections have been added to the docs:
Environment Setup & Editing Workflow
1.16.4
SVG 'marker' element support
This change allows use of all the marker element attributes. Before they were being incorrectly stripped due to a bug in the underlying SVG purification. Use of 'markers' came to the fore with the availablity of the bespoke drive.
Flow Animation speed bias
Adds a new term to the flow animation drive that applies a power curve to the flow rate. Before the flow animation speed linearly ramped with data. Now speed ramps in at the rate of your choice.
New config terms in panelConfig:
- panelConfig:cells.cell-name.flowAnim.biasPower
1.16.3
SVG formating support
Using SVGs post formatting for better readability could cause label positions to shift. This is now fixed by limiting the scope of how style->whitespace is applied dynamically to labels.
1.16.2
Animation play/pause button optional
New panel level switch added to allow removal of the animation play/pause control.
Bespoke formulas fix
Bespoke formulas would only run if the cell also included a bespoke attribute 'get' or 'set'. This restriction has been removed so formulas can now be used stand-alone for computing new data terms for use in the other drives.
1.16.1
Single data point dataFrames
Support added for incoming data that doesn't have an associated time array, just a single data-point in the array.
Bespoke Attribute Drive
New mathjs based drive for SVG element attributes. This allows clients to do bespoke things such as transform their shape elements according to incoming data. Multiple incoming data sources can be combined in mathjs formulas to derive new values and these values can be used to drive attributes or as a source for any of the other fixed drives such as label, labelColor, etc. To ensure javascript can't be injected into the plugin the following bespoke attribute restrictions are in place:
- No attribute values beginning 'on' are drivable.
- Only attributes 'transform', 'transform-origin', 'visibility' can be added.
- Any other attribute value can be driven provided the attribute still exists after the svg has parsed through dompurify at initialization.
New config terms in panelConfig:
- panelConfig:cells.cell-name.bespoke
- panelConfig:cells.cell-name.bespokeDataRef
- panelConfig:cells.cell-name.label.bespokeDataRef
- panelConfig:cells.cell-name.labelColor.bespokeDataRef
- panelConfig:cells.cell-name.fillColor.bespokeDataRef
- panelConfig:cells.cell-name.strokeColor.bespokeDataRef
- panelConfig:cells.cell-name.flowAnim.bespokeDataRef
- panelConfig:cells.cell-name.fillLevel.bespokeDataRef
TimeSlider time range compatible with time-shift
Corrects the way the time-slider time range is initialized so that it now behaves correctly when used in conjunction with panel-query-options time-shift.
1.15.0
This version was never published but contained an earlier version of 1.16.0 that based the bespoke drive off of client defined javascript. That drive in the later version was re-written purely in terms of client defined mathjs.
1.14.0
Threshold Support for Text Data
This adds the ability to configure thresholds using regex patterns for text data. New config terms in siteConfig and panelConfig:
- siteConfig:thresholdPatterns
- panelConfig:cells.cell-name.labelColor.thresholdPatterns
- panelConfig:cells.cell-name.labelColor.thresholdPatternsRef
- panelConfig:cells.cell-name.strokeColor.thresholdPatterns
- panelConfig:cells.cell-name.strokeColor.thresholdPatternsRef
- panelConfig:cells.cell-name.fillColor.thresholdPatterns
- panelConfig:cells.cell-name.fillColor.thresholdPatternsRef
Link in the Same Tab
This adds the ability to configure links to open in the same tab rather than a new tab. It can be set at the cell, panel or site level. New config terms in siteConfig and panelConfig:
- siteConfig:linkWindow
- panelConfig:linkWindow
- panelConfig:cells.cell-name.link.sameTab
Link Variables
This adds the ability to define link url substitutions to simplify oft-repeated base urls or argument sets. New config terms in siteConfig and panelConfig:
- linkVariables
Zoom Pan Pinch Wheel Activation
This adds the ability to require an activation key such as 'Alt' to be pressed in order to enter panel zoom. There's a clash of interest between panel zoom and dashboard scroll which can be avoided by using this feature. New config terms in siteConfig and panelConfig:
- zoomPanPinch
Compound Colors
This feature allows a labelColor, strokeColor or fillColor to be driven based off an array of dataRef inputs. i.e you can choose the worst or the best color based off of a set of inputs. To support this a new field has been added to 'threshold' called 'order'. It defaults to the threshold-array index but can be explicitly driven in yaml. This is the term used to compare thresholds from different dataRefs. On the whole it won't be needed but it's inclusion means no implicit ordering has to cross all threshold definitions. New config terms:
- cells.cell-name.labelColors
- cells.cell-name.strokeColors
- cells.cell-name.fillColors
1.13.0
Fill Level
Adds support for driving fill levels. The yaml defines a data->percentage-fill mapping. Under the hood it's implemented using the SVG clip-path feature. The shapes bounding box is calculated and an additional clip-path rect is added to the SVG. This rect then gets driven based off of the incoming data. New config terms:
- cells.cell-name.fillLevel
Stroke Color
Adds support for driving stroke color. i.e. coloring the structural lines of shapes and connections. The yaml drive is identical in nature to the fillColor drive. New config terms:
- cells.cell-name.strokeColor
Grafana Variable Substitution in ValueMappings
Adds support for passing valueMappings text through grafana variable substitution. i.e. to substitute all values of a timeseries with a variable value: cell abc: valueMappings: - {text = "${myVariableName}"}
1.12.0
URL Grafana Variables
Adds support for grafana variables in the SVG URL. Before this was only available in the YAML URLs. It also corrects the variable change detection logic for all url variables to ensure we get a fresh fetch when relevant variables change.
String Data
This adds support for string timeseries for label drives. Color can still be driven by having number timeseries for colors and string timeseries for the label text. This is also compatible with value mappings.
Relative Links
Adds support for relative links. Before only absolute links were available.
1.11.0
Flow Animations
Adds support for draw.io line flow animations. In draw.io lines with 'Flow Animation' selected and the resulting SVG 'exported-as-svg' (not just saved as SVG) results in animated lines that are controllable via 'direction' and 'duration' attributes. This change adds yaml config to drive these animations off of data. When such config is present a play/pause button is always added to the panel to ensure the panel is usable by all. New config terms:
- cells.cell-name.flowAnimation
As well as provisioning dashboards, the above functionality is demonstrated in example 4:
- svg: https://raw.githubusercontent.com/andymchugh/andrewbmchugh-flow-panel/main/examples/darkThemeSvg4.svg
- panelConfig: https://raw.githubusercontent.com/andymchugh/andrewbmchugh-flow-panel/main/examples/panelConfig4.yaml
New test data added to facilitate testing of the flow-animations:
- test.testDataBaseOffset
- test.testDataExtendedZero
One Datapoint Interpolation fix
Fixes a bug with timeSeries interpolation which resulted in no data when the timeSeries only had a single datapoint.
Value Mappings Support
This allows you to configure a custom value based on data-match criteria. i.e. if your data is 0, 1, 2 you can use this configuration to replace the 'label' text with 'auto', open', 'closed'. The criteria you can use to match are:
- exact value match
- range match
- partial range match.
New panelConfig terms:
- cells.cell-name.label.valueMappings
- cells.cell-name.label.valueMappingsRef
1.10.0
Increases the range of SVG shape support by relaxing the expected DOM element hierachy.
1.9.0
Adds Accessibility in the form of Pan / Zoom to ensure the SVG is readable for the greatest range of people.
1.8.0
Corrects the source of the time-field from the incoming dataFrame. Before it relied on the name being toLower('time'). Now it correctly looks up the type and breaks out on first match with type time. This fixes use with datasources like ElasticSearch where the field name defaults to '@timestamp'.
1.7.0
Improves scaling in all ways but especially the sub 100% scaling so that it now correctly fills the panel maintaining aspect ratio.
Changes the background color definition so that it applies to the available svg panel area rather that the actual svg background.
Adds a new panelConfig field 'unitsPostfix'. This is an optional string that will be postfixed to the label value. It can be used for specifying custom units. In yaml, unicode characters are specified with a \u. i.e. "\u03bc" = Mu. New panel config terms:
- cells.cell-name.label.unitsPostfix
Adds a new panelConfig field 'condensed'. This mode which uses less vertical space for the controls when both the timeSlider and highlighter are enabled. New panelConfig terms:
- tagConfig.condensed
1.6.0
Adds resource links for website, license and yaml defs to the plugin landing page.
Fixes x-scaling ratio when the SVG x-dimension is smaller than the available window. Now it scales with the window whereas before it scaled at twice the rate resulting in it being much smaller than necessary.
Adds the ability to drive the SVG background. New panelConfig terms:
- background.darkThemeColor
- background.lightThemeColor Can be used with the normal color-names, rbg, hex values. When the relevant term is undefined the background color is not driven.
Extends the datapoint choice from 'last' to 'last' or 'lastNotNull'. 'last' remains the default. When coupled with graphite functions 'keepLastValue' and 'transformNull', 'last' offers the best control over the display. Where those graphite functions are not available 'lastNotNull' offers a consistent display when dealing with sparse data. 'lastNotNull' starts with the same datapoint as 'last' and then walks back in time till a non-null value is found. It's configurable in the panel yaml at the panel level and overridable at the cell level and cell-attribute level. To make this testable a 'test' table has been added to the yaml to allow the testData to be generated in sparse mode. New panel config terms of:
- datapoint
- cells.cell-name.datapoint
- cells.cell-name.label.datapoint
- cells.cell-name.labelColor.datapoint
- cells.cell-name.fillColor.datapoint
- test.testDataSparse
Adds 'Thread highlighting'. Each driven SVG cell can now be given an associated tag set and these tags are selectable from an optional 'Highlighter' legend. This provides a way to bring related terms to the fore to help spot correlations in flow. New panel config terms of:
- tagConfig
- cells.tags
1.5.0
Fixes the grafana variable threshold matching to break out on first rule match for a given variable/cell tuple. Before it was continuing through the rule set which meant various negative rules were also needed to achieve the right effect.
Fix rendering of SVGs that contain multi-line text blocks. Before the domPurify step was breaking the content making the image unrenderable. This is now fixed by using PARSER_MEDIA_TYPE: 'application/xhtml+xml' in the domPurify sanitization.
Fix link time forwarding when sourced from the args. Before this worked correctly if from/to arguments were present in the url, but when they were missing it would add them in but set to 'null' resulting in a downstream dashboard have a non-existent time window. Now if the values aren't in the url, they aren't appended to the link.
Expose decimalPoints=auto. Before the default was '0' and there was no way to specify auto. Now setting decimalPoints to null will forward through as 'auto'. There's also now a panel level override 'cellLabelDecimalPoints' that will be applied if the value is not specified at the cell level. To keep back-compatibility, if not specified on the cell or in this panel fallback it will still default to '0'.
1.4.0
Changes the data-series name to be sourced from getFieldDisplayName(field, frame). This is a much more involved grafana backed name resolution that should work with all the various ways grafana allows series to be named. Added to resolve issue raised with a prometheus data query.
1.3.6
Grafana 10.0.0 base.
- rebases the required dependency to Grafana 10.0.0
- corrects readme example picture links to work from grafana plugins page
- starts maintaining this changelog
1.3.4
Grafana 10.0.3 base.
Initial release.