Plugins 〉Druid


Druid


Druid as a Data Source for Grafana
Table of Contents
What is this Druid-Grafana plugin?
Grafana doesn't supports Druid as a Data Source, this plugin aims to do so.
Features
At the time of writing, the plugin supports all Grafana features and all Druid queries:
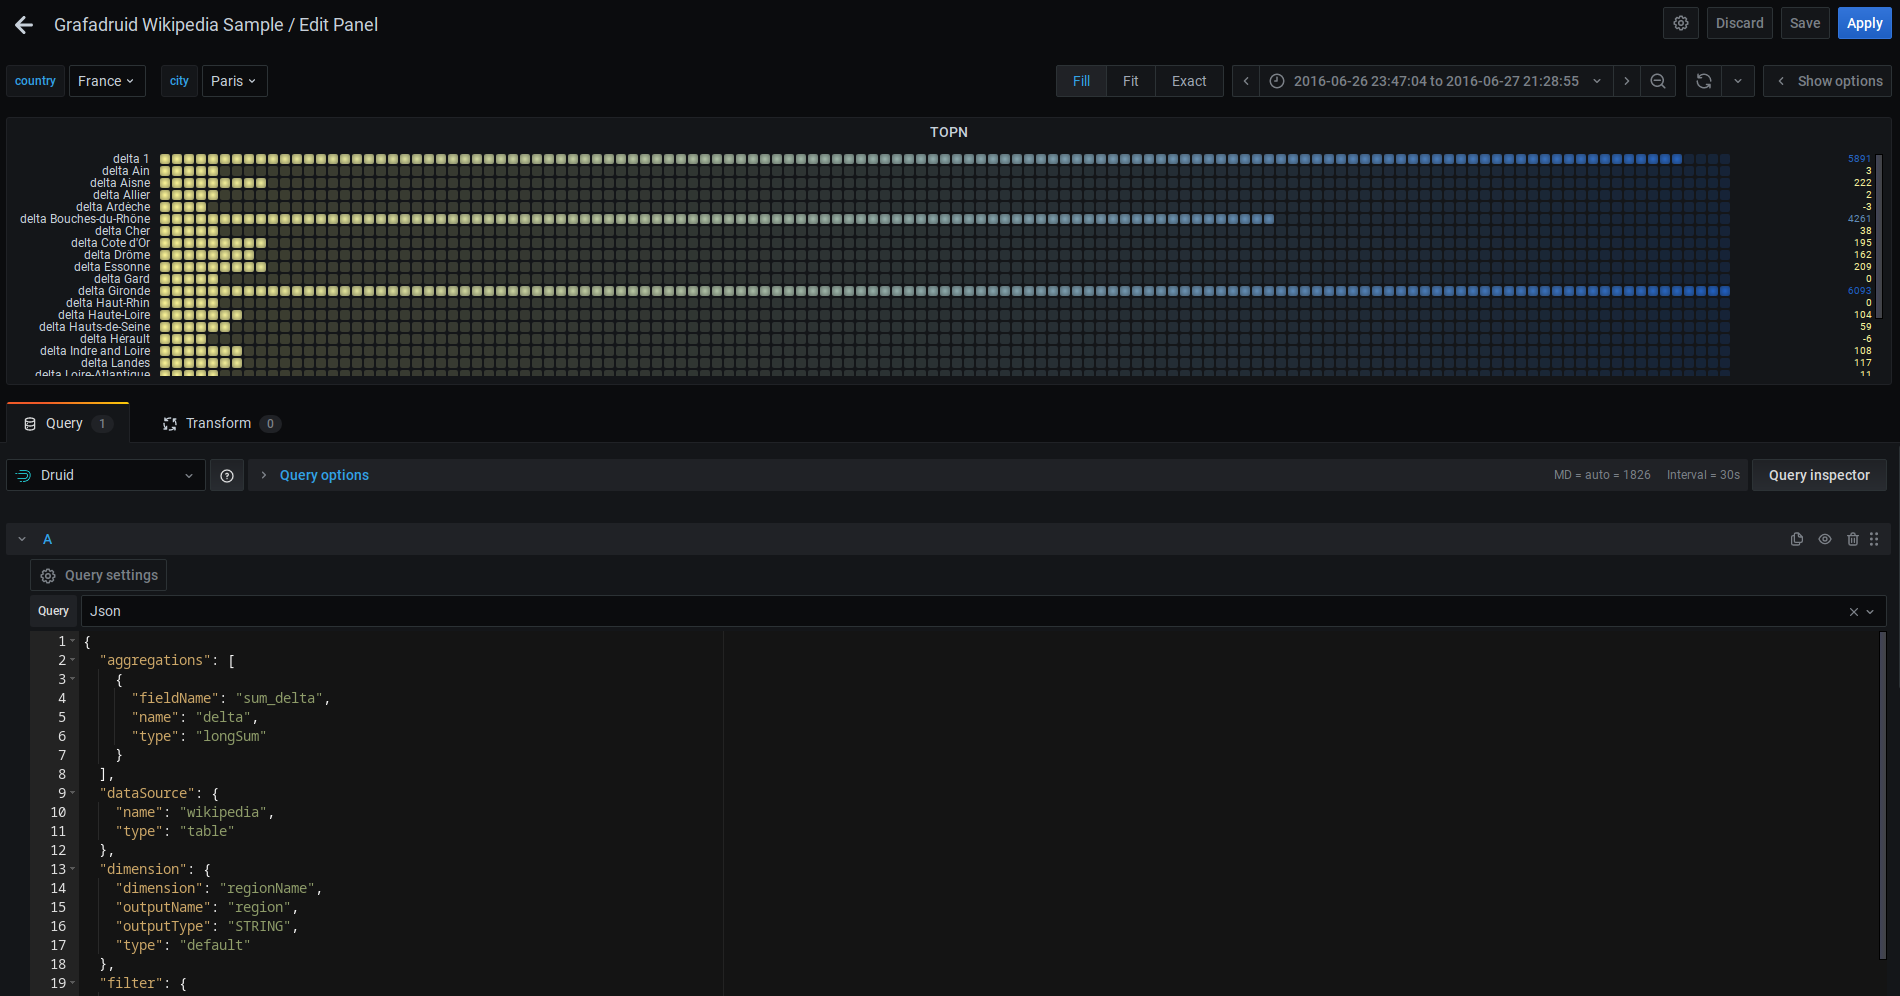
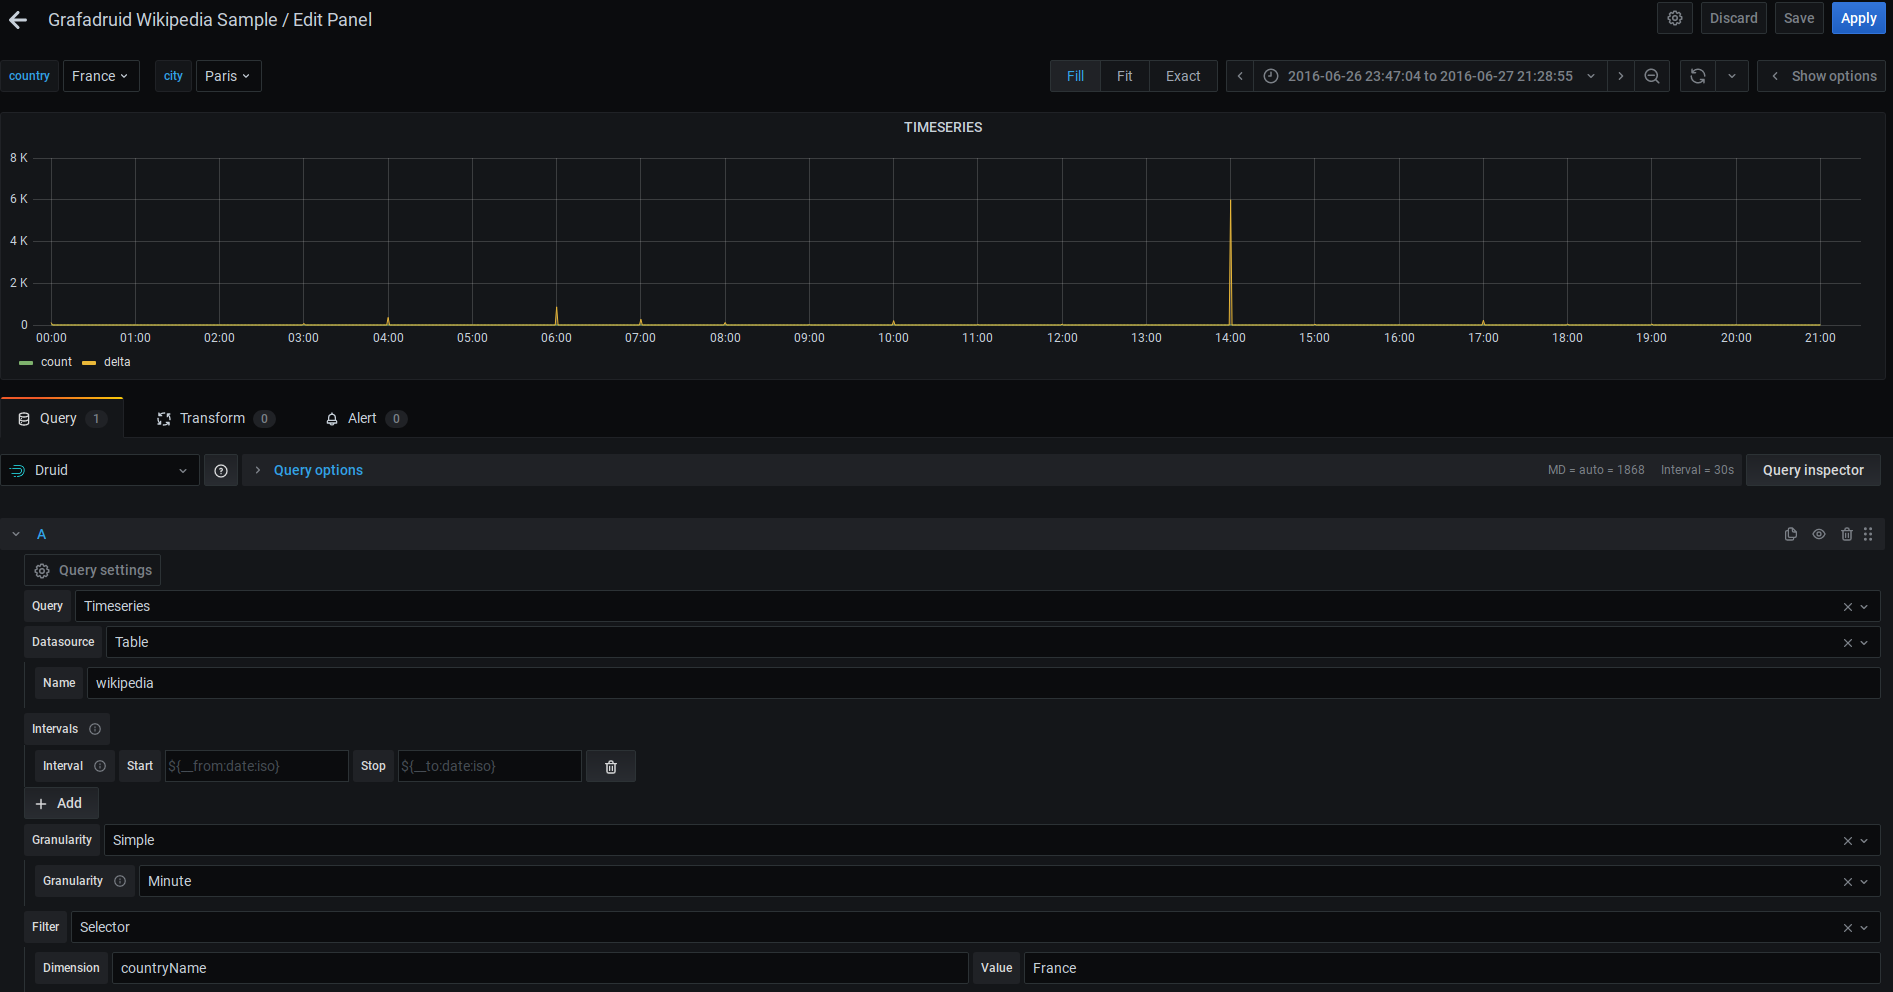
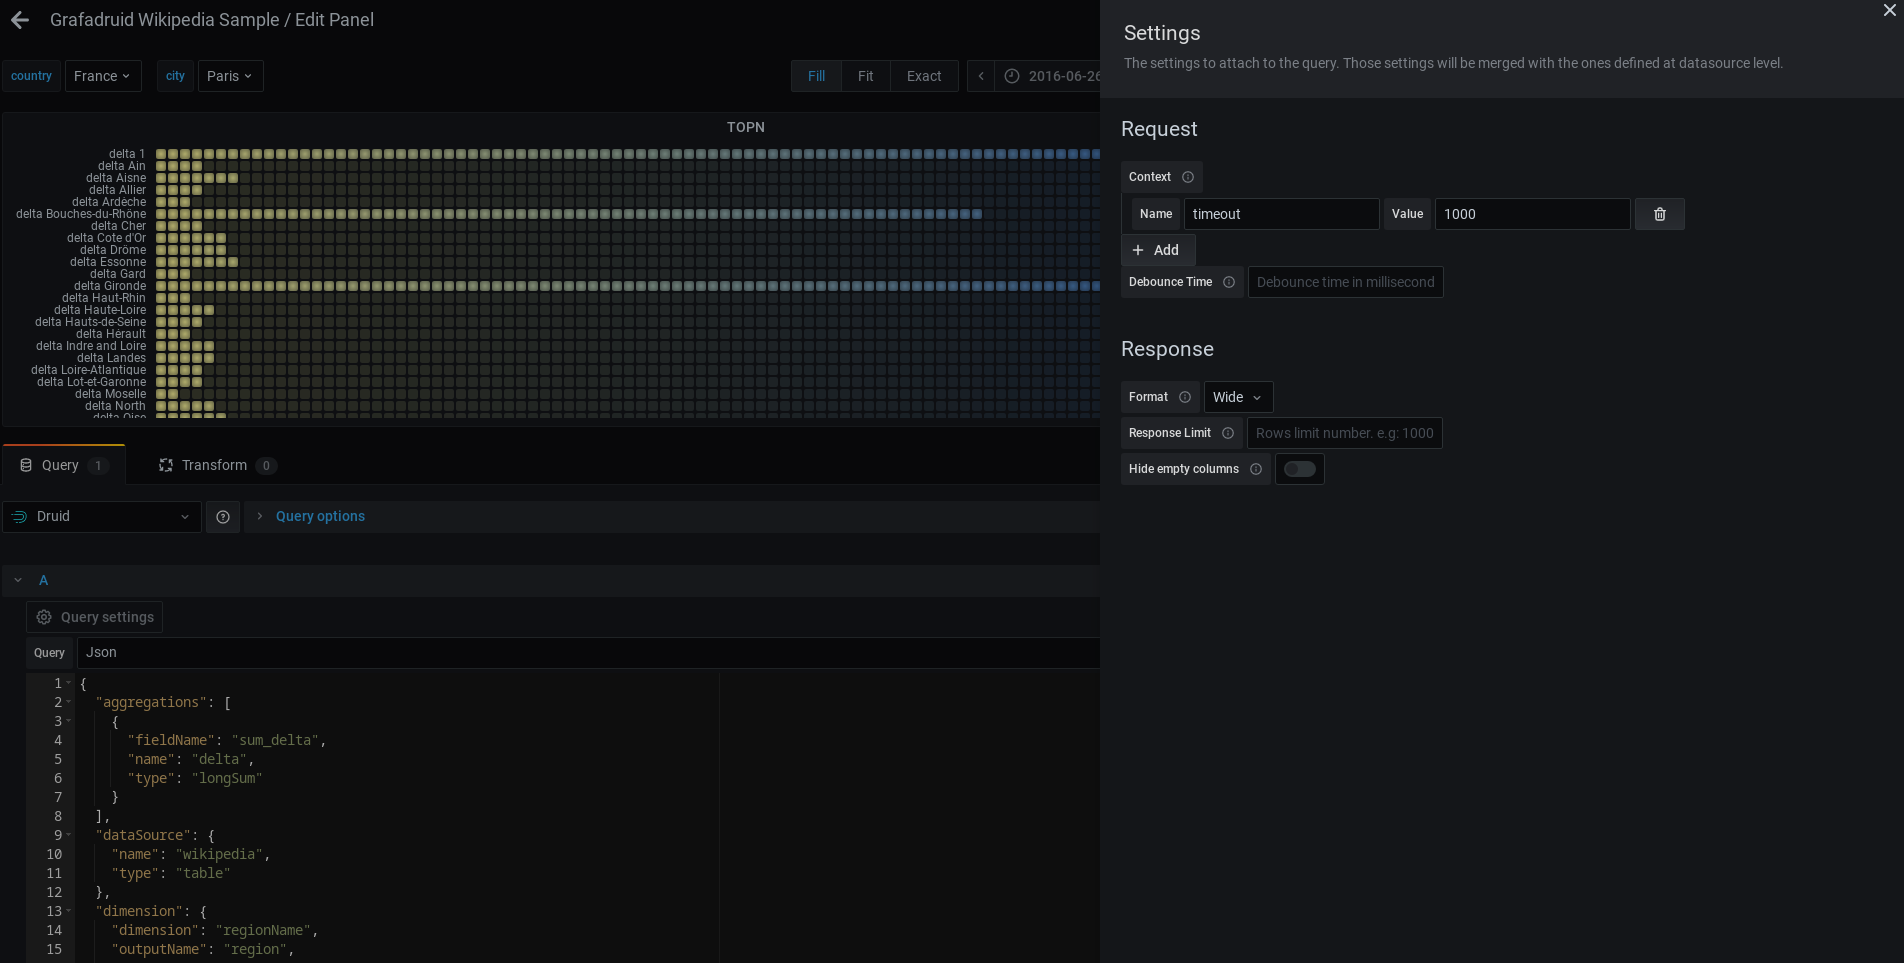
- Druid queries: SQL, timeseries, topn, groupby, timeboundary, segmentmetadata, datasourcemetadata, scan, search, JSON
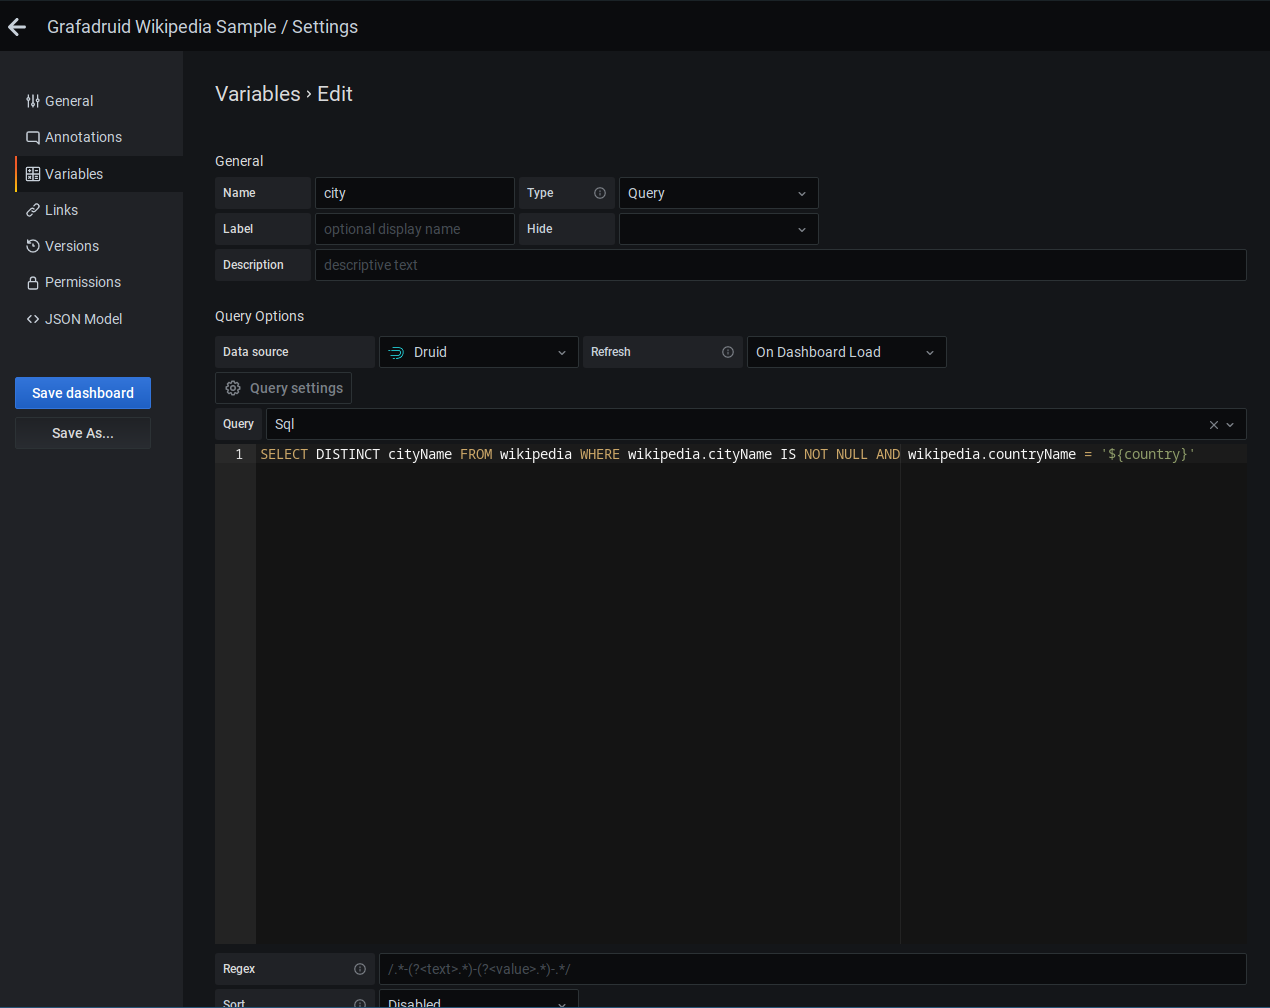
- Variables: Grafana global variables replacement, query variables, formatter
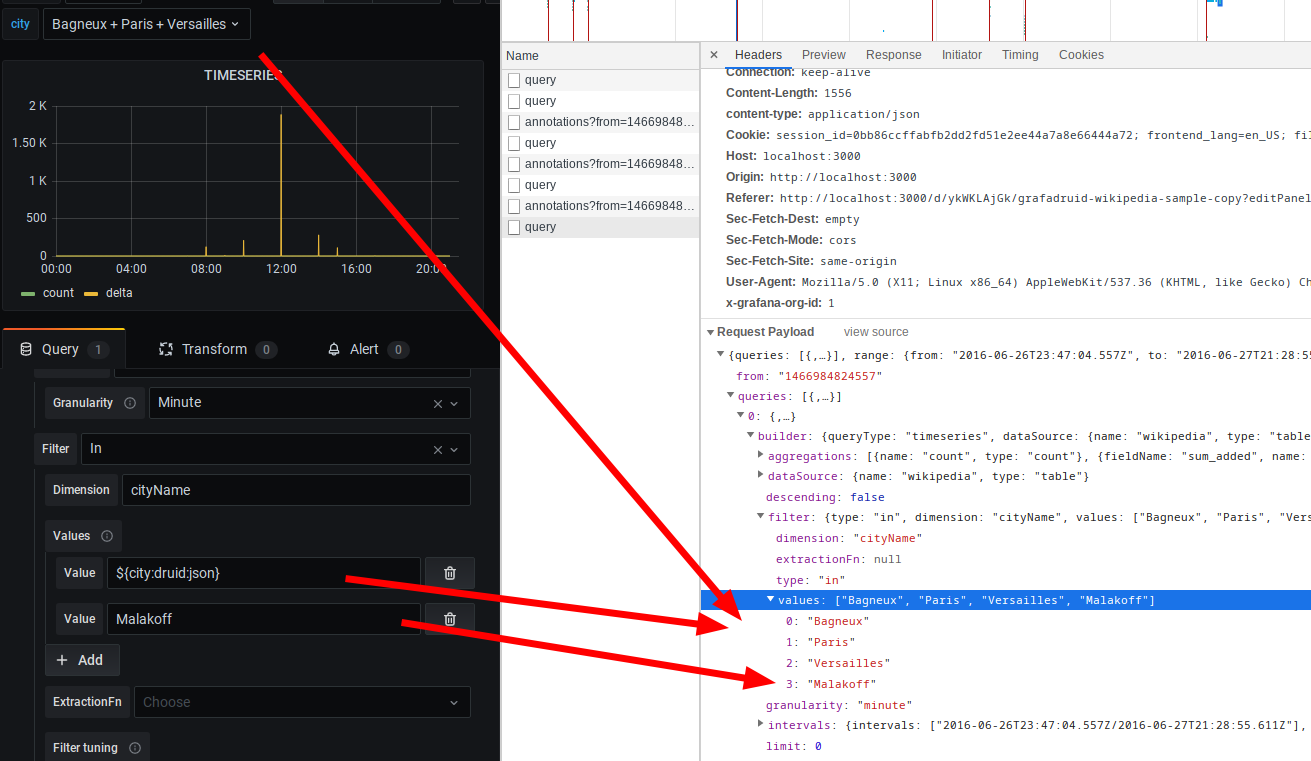
druid:json(provide support for multi-value variables within rune queries). - Alerts
- Explore
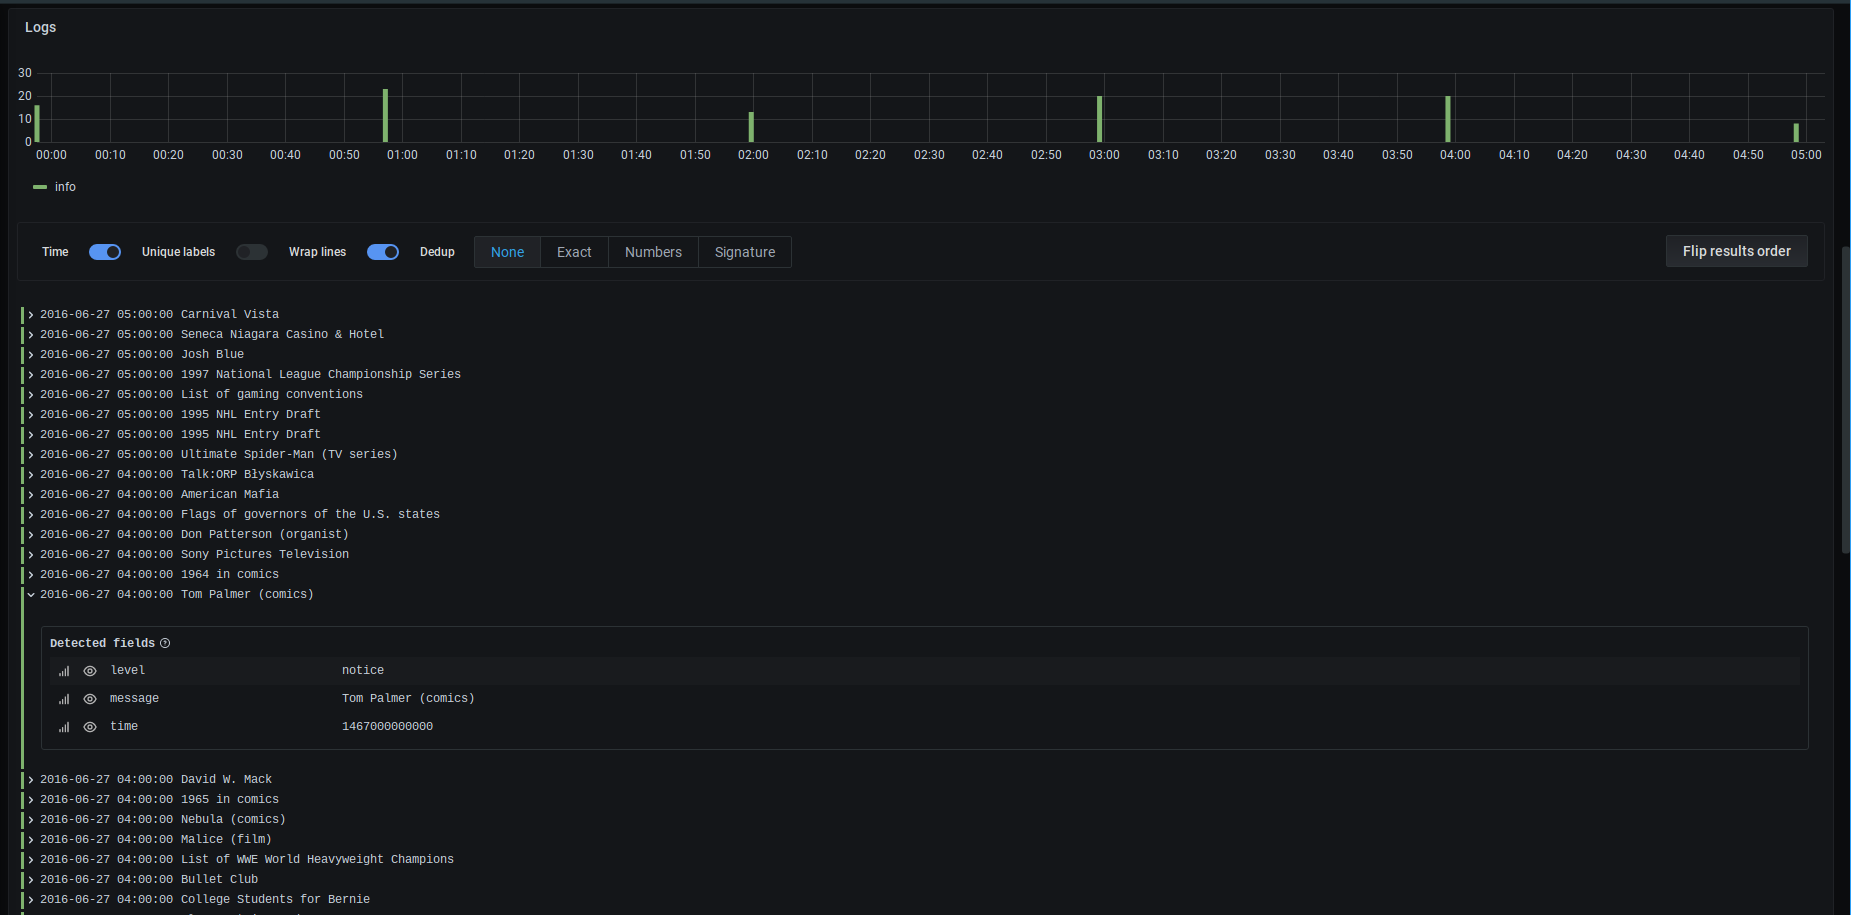
- Logs
if you're using a self-signed TLS certificate, an option to "Skip TLS verify" will be shown when "https" is used in datasource URI)
Screenshots
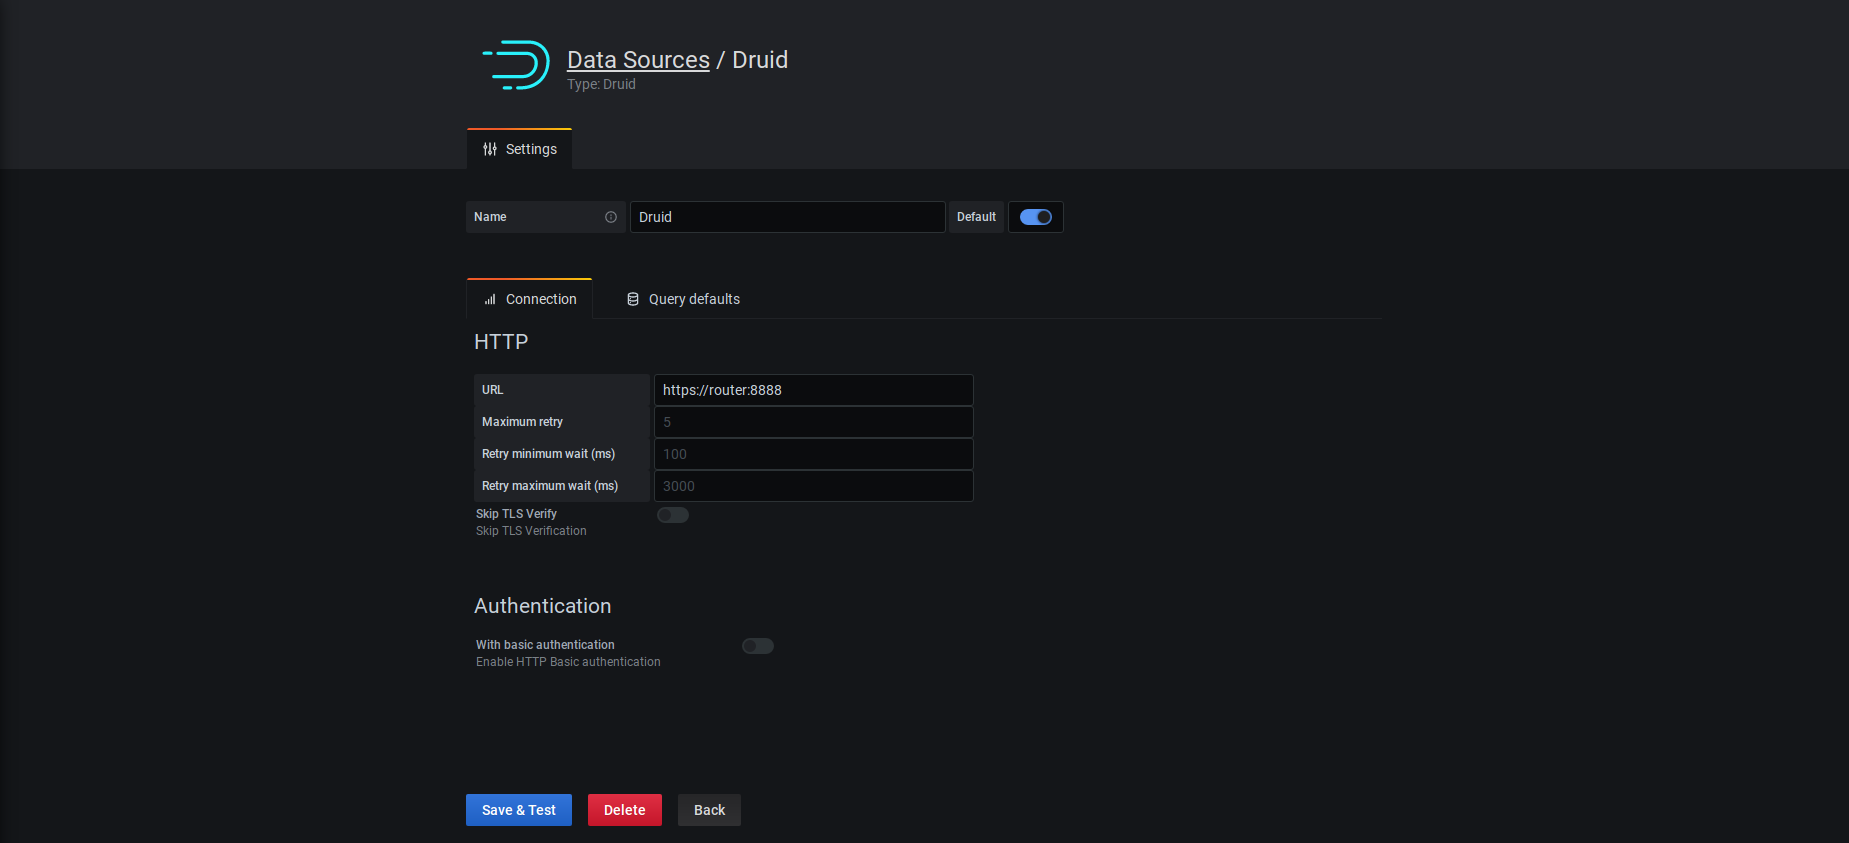
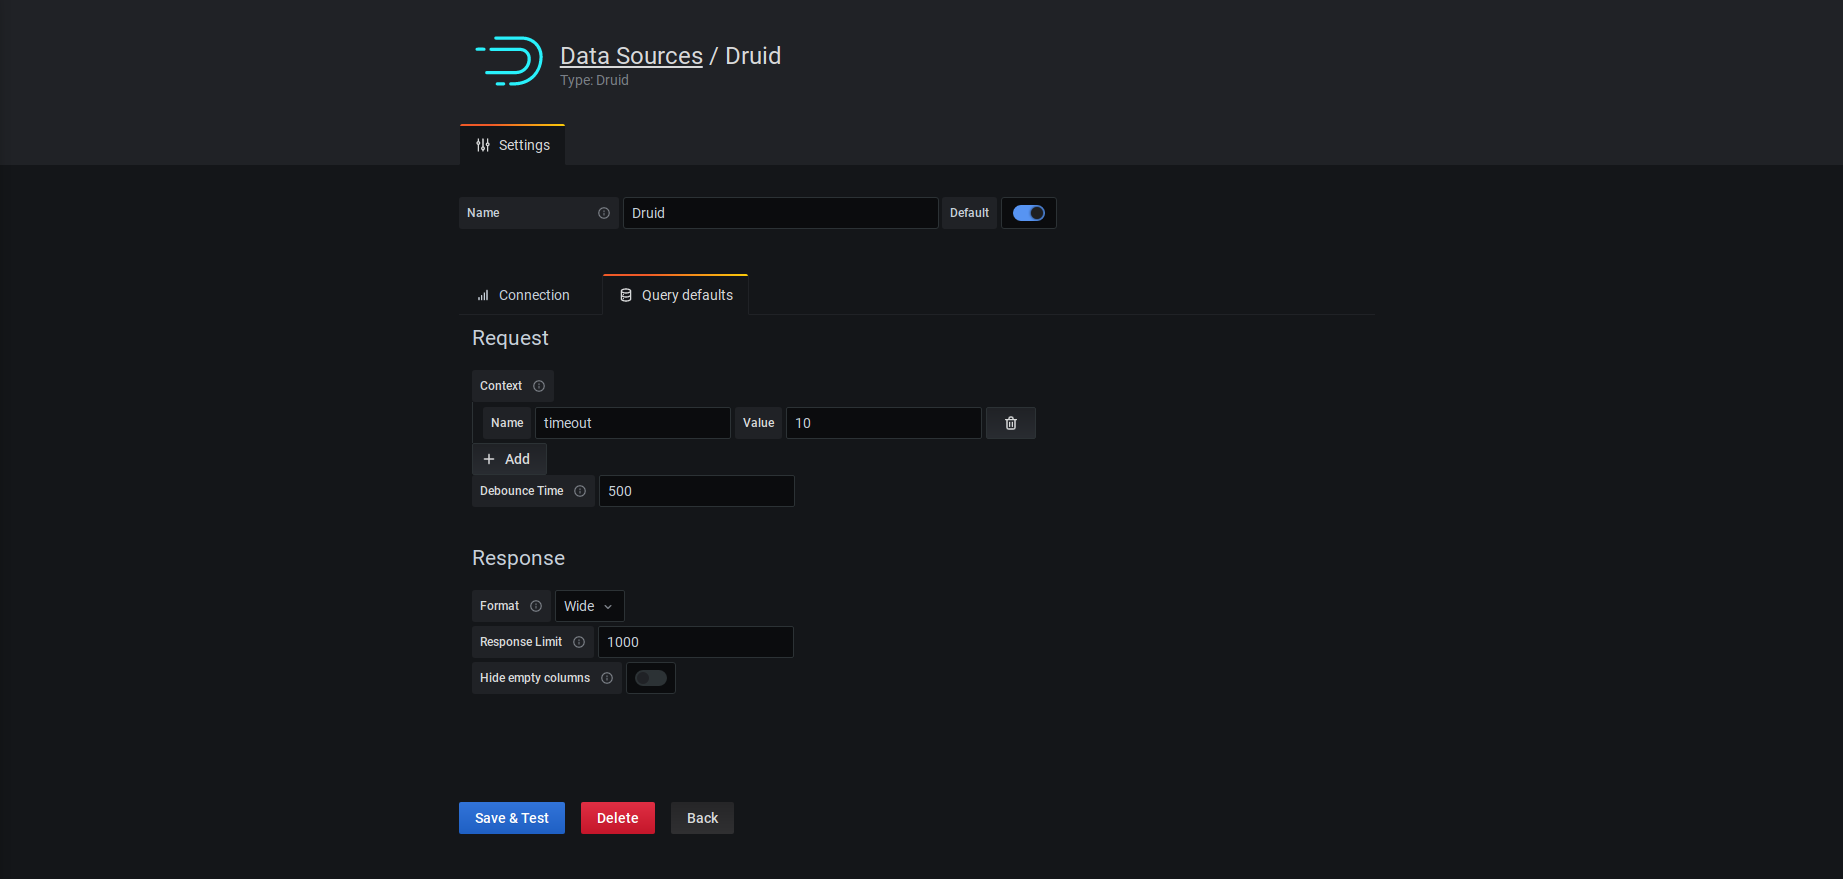
Datasource - Connection
Datasource - Default settings
Panels
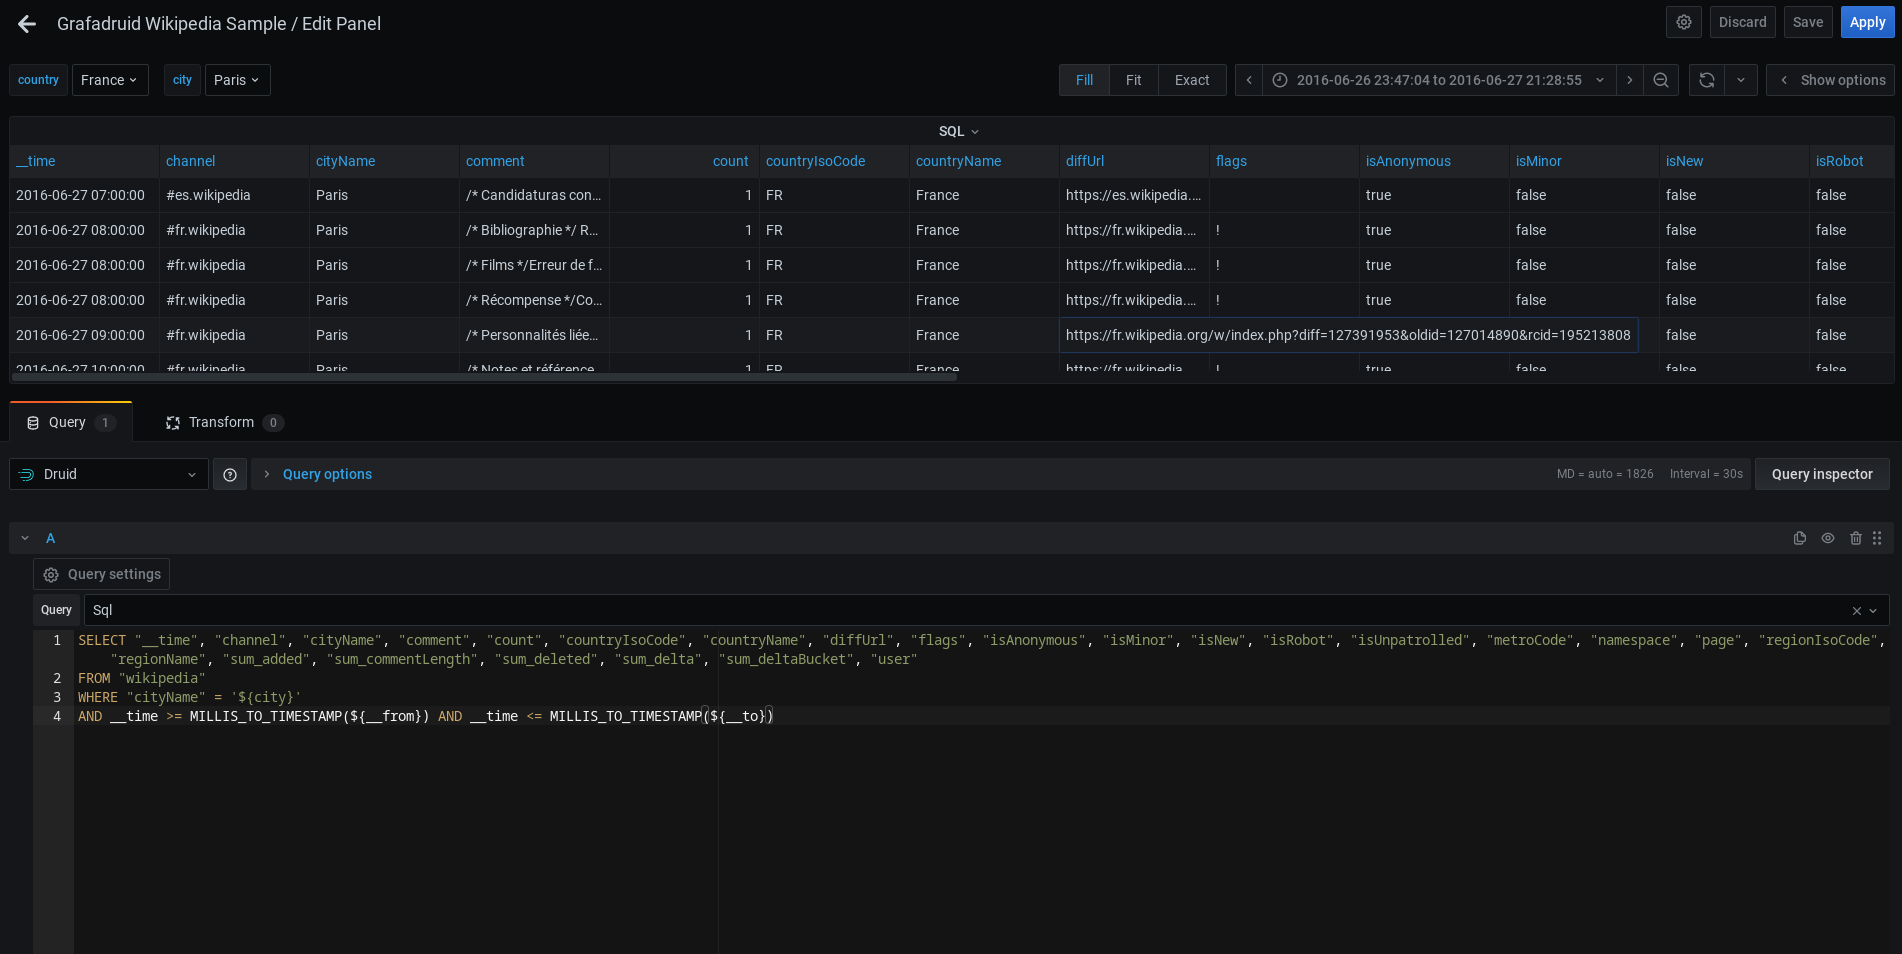
Query builder - JSON

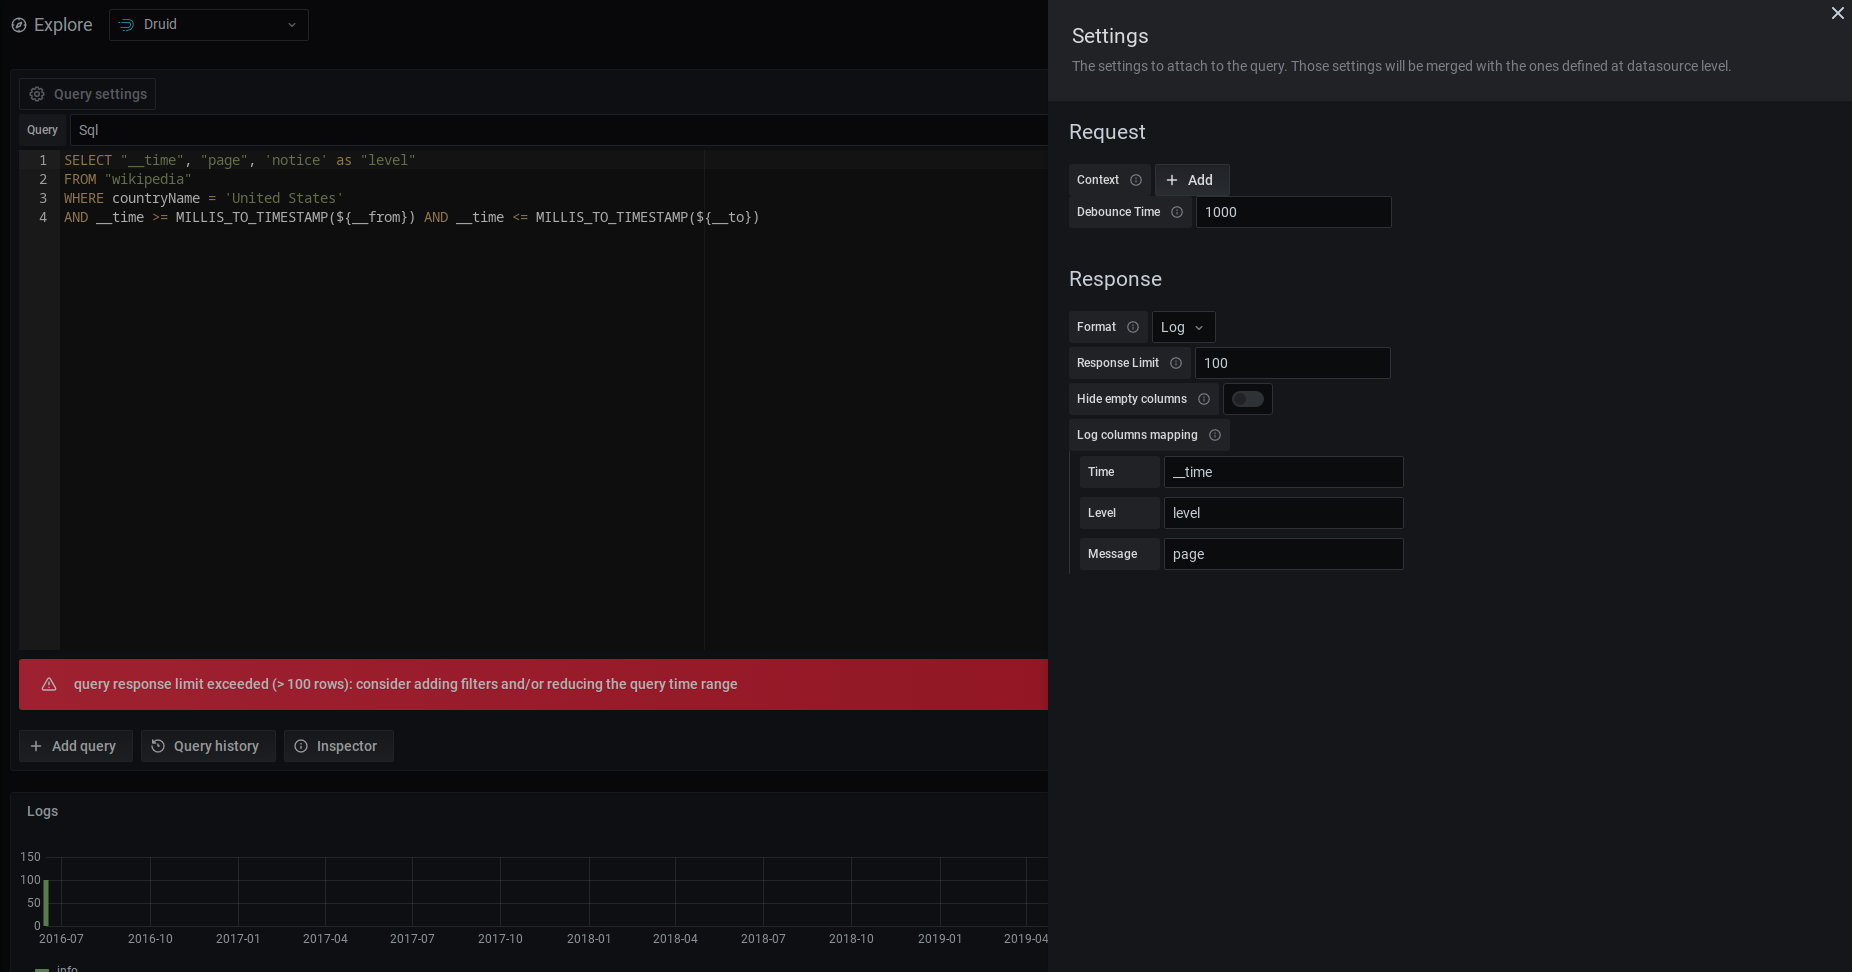
Query builder - SQL
Query builder - Timeseries

Query builder - Settings

Variables

Variables - Formatter - druid:json

Explore - Logs

Query builder - Settings - Logs

Contribute
Any contribution is welcome! Feel free to join on Slack to discuss :) To go further, see Contribute
Install
- From Grafana.com:
grafana-cli plugins install grafadruid-druid-datasource $VERSION- If
$VERSIONis not specified latest version will be installed
- If
- From remote archive:
grafana-cli --pluginUrl https://github.com/grafadruid/druid-grafana/releases/download/v$VERSION/grafadruid-druid-datasource-$VERSION.zip plugins install grafadruid-druid-datasource - From local archive:
unzip grafadruid-druid-datasource-$VERSION.zip -d $YOUR_PLUGIN_DIR
Where $VERSION is for instance 1.0.0 and $YOUR_PLUGIN_DIR is for instance /var/lib/grafana/plugins
(Source: https://grafana.com/docs/grafana/latest/plugins/installation/)
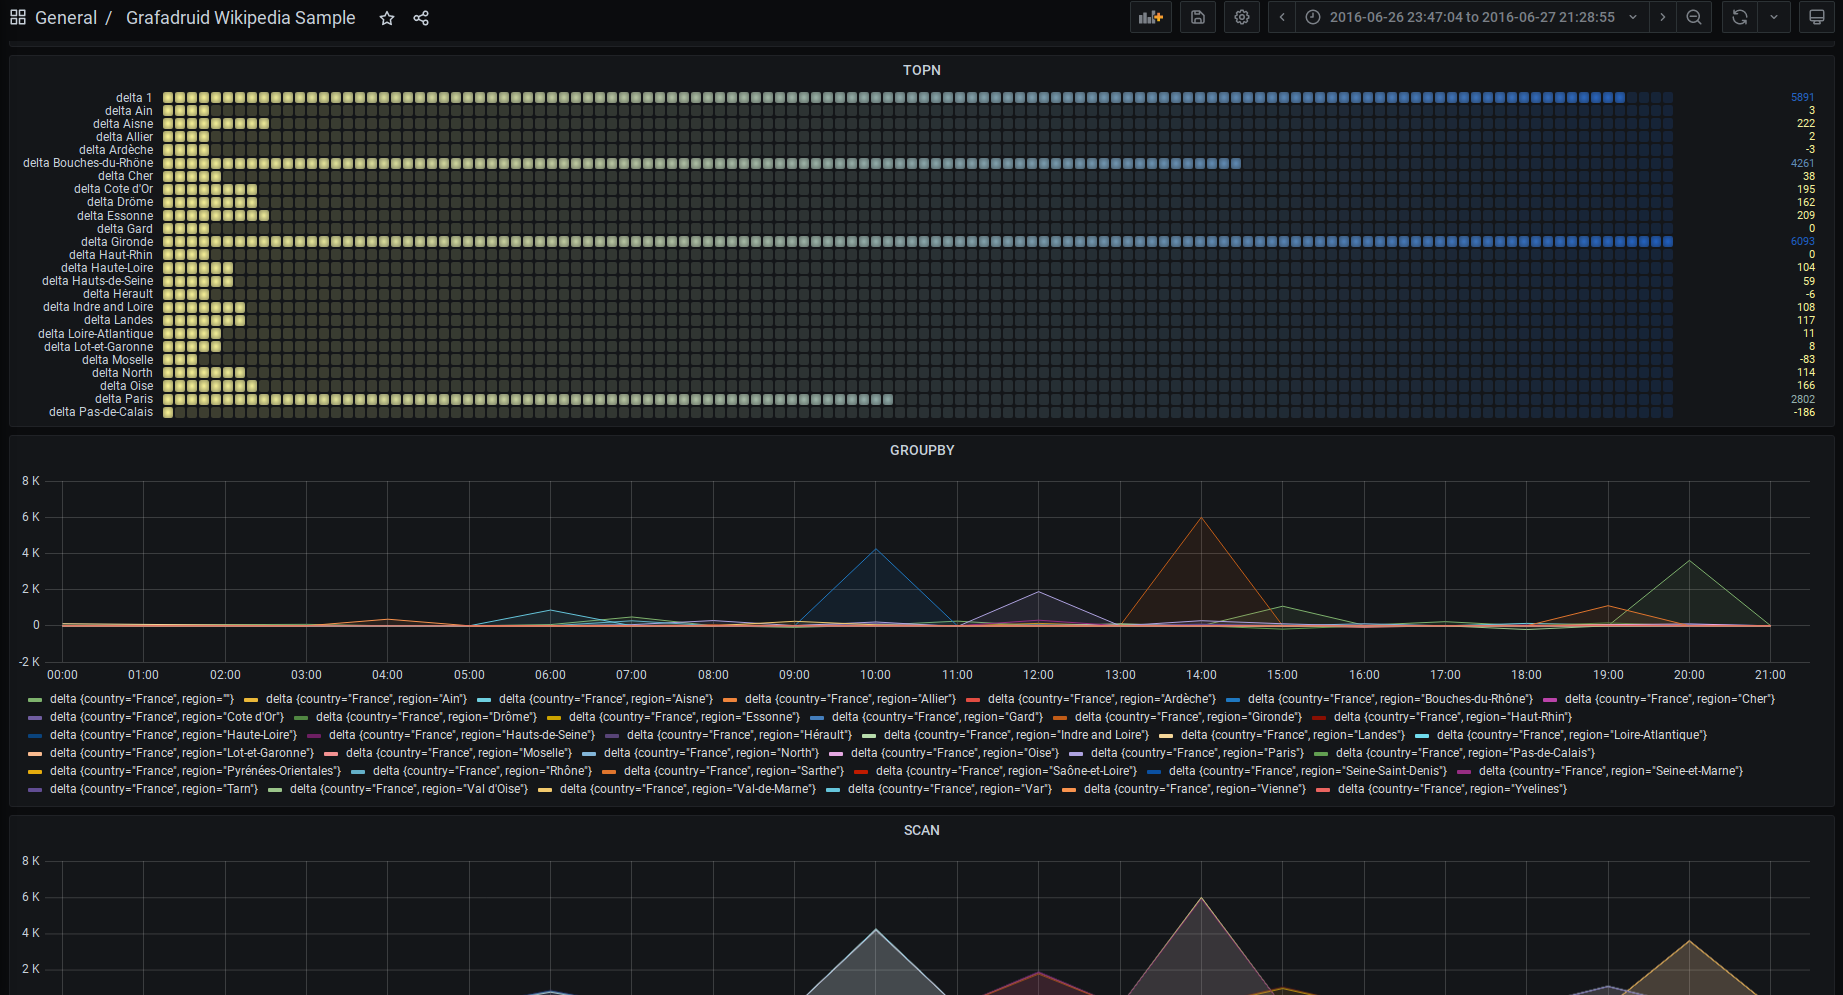
Examples
You can try out various advanced features of the plugin by importing the demo dashboard and running it against the Wikipedia dataset used in the Druid quickstart tutorial.
When using the provided docker based environment (
./mage env:start && ./mage), the dataset is automatically ingested in Druid, the datasource and dashboard are automatically provisionned in Grafana.
Grafana Cloud Free
- Free tier: Limited to 3 users
- Paid plans: $55 / user / month above included usage
- Access to all Enterprise Plugins
- Fully managed service (not available to self-manage)
Self-hosted Grafana Enterprise
- Access to all Enterprise plugins
- All Grafana Enterprise features
- Self-manage on your own infrastructure
Install on Grafana Cloud
Plugins can be installed directly from within your Grafana instance or automated using the Cloud API or Terraform.
Learn more about plugin installationMarketplace plugins
This is a paid plugin developed by a marketplace partner. To purchase an entitlement, sign in first, then fill out the contact form.
Get this plugin
This is a paid for plugin developed by a marketplace partner. To purchase entitlement please fill out the contact us form.
What to expect:
- Grafana Labs will reach out to discuss your needs
- Payment will be taken by Grafana Labs
- Once purchased the plugin will be available for you to install (cloud) or a signed version will be provided (on-premise)
Thank you! We will be in touch.
For more information, visit the docs on plugin installation.
Installing on a local Grafana:
For local instances, plugins are installed and updated via a simple CLI command. Plugins are not updated automatically, however you will be notified when updates are available right within your Grafana.
1. Install the Data Source
Use the grafana-cli tool to install Druid from the commandline:
grafana-cli plugins install The plugin will be installed into your grafana plugins directory; the default is /var/lib/grafana/plugins. More information on the cli tool.
Alternatively, you can manually download the .zip file for your architecture below and unpack it into your grafana plugins directory.
Alternatively, you can manually download the .zip file and unpack it into your grafana plugins directory.
2. Configure the Data Source
Accessed from the Grafana main menu, newly installed data sources can be added immediately within the Data Sources section.
Next, click the Add data source button in the upper right. The data source will be available for selection in the Type select box.
To see a list of installed data sources, click the Plugins item in the main menu. Both core data sources and installed data sources will appear.
Changelog
1.0.0 (Unreleased)
Initial release.